Last Modified on January 7, 2025
Are you looking to kickstart your GA4 adventure?
In this Google Analytics 4 tutorial for beginners, you will learn what GA4 is and why it is essential for online businesses.
Working with GA4 is about having the ability to take action based on the data you have gathered.
By the end of our Google Analytics 4 tutorial for beginners, you will be proficient at GA4, even if you are new to this tool.
Here is an overview of what we’ll cover:
- Google Analytics 4 Tutorial for Beginners: The Basics
- Installing Google Analytics 4 on Your Website
- Installing Google Tag Manager on Your Website
- GA4 DebugView
- GA4 Configurations
- Events in Google Analytics 4
- GA4 Standard Reports
- Filters in Google Analytics 4
- Exploration Reports in GA4
- Tip for Getting an ROI
- Beyond the Basics
We have lots to cover, so let’s dive in!
Google Analytics 4 Tutorial for Beginners: The Basics
First, let’s take a look at the interface.

Here, we have the GA4 Google Merch Shop demo account.

Google provides this fully functional Google Analytics account for any user to access. It is connected to the Google official merchandise store, giving you access to diverse data sets you may not possess.

It provides a way to explore existing business data and experiment with Google Analytics features.
💡 Top Tip: Check out our guide on the Practical Values of the Google Analytics 4 Demo Account to learn what account types and data sources are available for testing and how to access the GA4 demo account.
What is Google Analytics 4 all about?
Whether you’re an online store owner, you have a blog or a SaaS business, you probably have decisions to make. These decisions may involve deciding whether you change something on your website.
To determine what things you can do and how you can optimize them, a helpful thing to do as an online business owner is to look at your numbers.
Google Analytics is a tool that lets you track all your different user interactions. Google Analytics 4 is the latest (and now the only) version of Google Analytics.
When users go to your product page, add a product to the cart, or check out and buy something from your store, you can track all these with Google Analytics 4.
Once you’ve tracked this data, you can use GA4 as your answering machine. You can go into the tool and say, “How many people visited my website last month?“
Here, we see that in the last 28 days, we had 68K users and $127K total revenue.
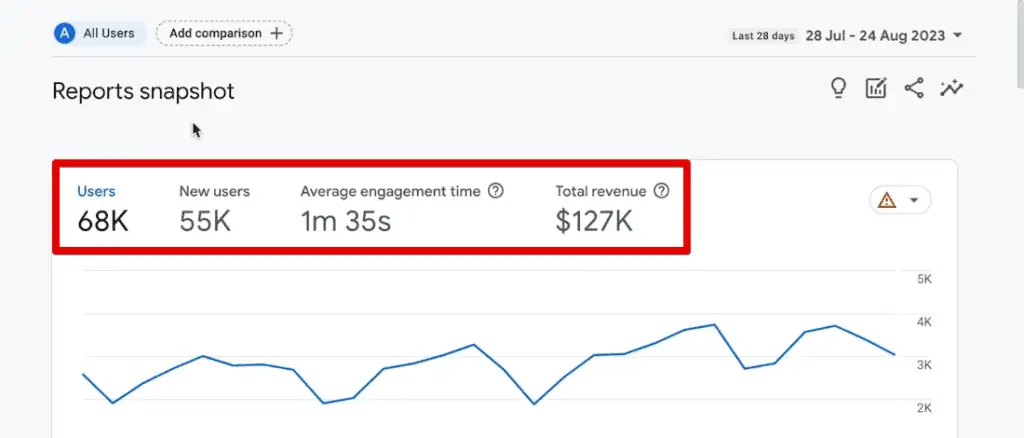
There are more things we can look at. We can see the number of users that visited our website in the last 30 minutes and which countries they come from. We can also get some insights into our data.

We can determine which channels our users come from and which campaigns perform best.

Finally, we can also see the locations where our users come from.
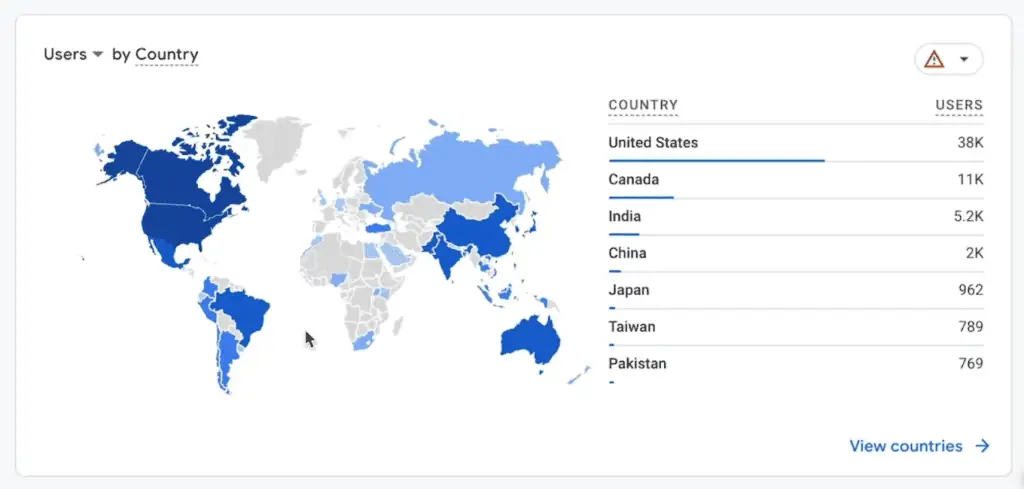
These are just a sliver of what you can do with GA4. There are more tools to it. When we do marketing analytics, for example, we dive right into the user acquisition reports that let us know how users come to our website.
Go to Acquisition → Traffic Acquisition.

Here, you can see a table of the users that came through, the number of sessions, engaged sessions, and average engagement time per session.

We can quickly look at a channel and determine how many people came and how long they stayed on our website. We can also learn the engagement rate, conversion rate, and how many conversions they generate.
Conversions are actions that you want your users to take on your website. With Google Analytics 4, you can track these easily.
After building out your tracking and making it more custom to your platform, you can gather more insights about your business. Let’s look at what data we can collect for a website.
Go to Monetisation → E-commerce Purchases.

Here, we can see a list of the items we sell in our store, the number of times users viewed them, added them to the cart, purchased them, and how much revenue we generated.

Next, we can go to the User Purchase Journey report.

You can look at the funnel of how many people entered your store, viewed a product, added it to the cart, began checkout, and purchased, along with the equivalent abandonment rates.

In the Tech Overview report, you can find more information about your users, like what devices they use to arrive at your website and which operating system.

All of this will inform you about who is visiting your website, where they come from, and what they do once they are on your site.
It also lets you ask specific questions about your business. Then, hopefully, you can take action based on what the data shows you.
For example, if you have many Android users coming to your website, you could check the Android compatibility of your website, see if people can make a purchase without issues, or if there is anything you can optimize.
It is a crucial step in any digital analytics process. You need to make a recommendation and take action on that data – this is how you can get an ROI on your analytics investment.
Why do online stores often use Google Analytics on their website?
Multiple other tools can do web tracking and web analytics for you. Some share many similarities to GA4, but the big differentiator with Google Analytics is that it’s free.
🚨 Note: If you are interested in what other analytics tools are available and their capabilities, check out our list of the Top 5 GA4 Alternatives.
Nowadays, GA4 is a must-have for whoever is operating a professional website. One drawback of Google Analytics, however, is that it is not as intuitive when you look at the interface.
Do not feel overwhelmed with all this data. We are going to discover all of this together.
Let’s kick off our Google Analytics 4 tutorial for beginners by installing Google Analytics on our website!
Installing Google Analytics 4 on Your Website
To start, go to the Google Analytics website.

If you are setting up Google Analytics for the first time, you must have a Google account ready.
After logging into your Google account, we will see this overview for setting up your GA4 account.

In Google Analytics, we have accounts and properties. An account acts like a container in which you put your properties. Usually, you would choose your company name as the account name if you have multiple websites (properties).
Let’s call this account Company LLC.

Next, we can go through the Account Data Sharing Settings with Google. If you want to tweak which data you share with Google, read through and adjust these settings.

Once you have finished your data sharing, click Next.

Next, we’ll get to the property settings. If you have several websites, you can create a property for each and store them in a single account.
In our case, we have a property here, which is our demo shop.

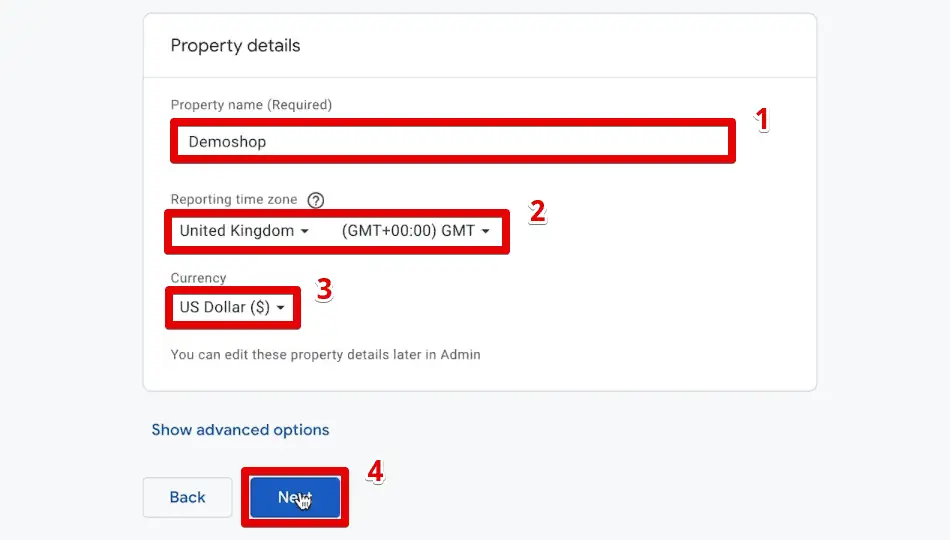
Then, we have the property details. We need to provide a name, reporting time zone, and currency.
Choosing the correct reporting time zone is vital because we need to sync it to whatever time zone you are working on or align it to your backend. Afterwards, pick the currency. The currency is vital when you are working with an eCommerce website.
Let’s go with Demoshop for the name, select the United Kingdom for the time zone, and use the US Dollar as the currency. Finally, click Next.
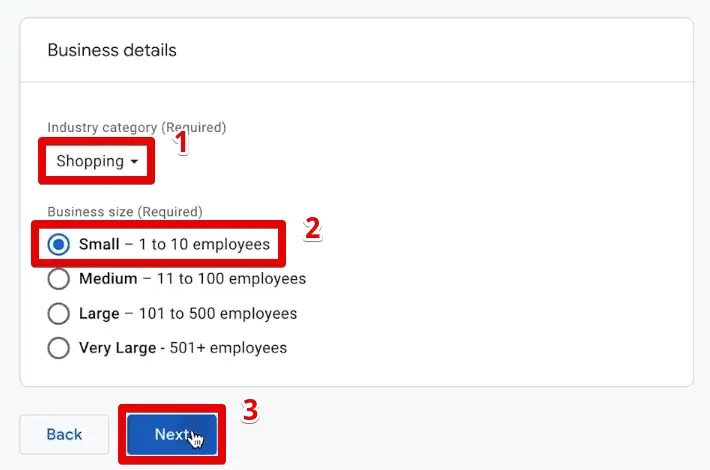
Then, we’ll go to the business details section. Google wants some information about your business to help them understand your business better and tailor your experience to your business type.
First, we should provide our industry category. In our case, we have a Shopping website. Next, specify the business size. Let’s go with Small. Then, click Next.
Next, we get to the business objectives.

Your selection here decides what reports you can see in the interface later. I want to keep it generic, but feel free to choose whatever suits you and your business best.
I’ll go with the Get baseline reports option and click Create.

Next, go through the Terms of Service agreement. Read through all of this and check the data processing terms. Finally, click I Accept.

Finally, we are at the last step, which is data collection. We’ll get to this step later in our tutorial, so click Skip for now.

We are almost there. We only need to set everything up. Click Continue to Home.

We are now in our brand new Google Analytics account.

No data is flowing into our account yet. So, let’s go ahead and set it up now.
🚨 Note: If you’re hesitant about changing something on your website while still testing how GA4 works, consider making a demo website for all your testing needs.
Your case might be completely different from what we are showing here. If you are running a website on Shopify, Magento, a completely different CMS, or it’s even self-built, you can still follow the steps. They will only differ a little from what we are doing.
💡 Top Tip: We have created more specific tutorials for Shopify and ThriveCart websites that you might want to check out. Follow our guides on the new Google Analytics 4 Shopify Connector and ThriveCart Tracking with GA4 and GTM.
We’ll set up data collection for a website built on WordPress. So, try to follow along even if you don’t use WordPress since the process is general.
First, we must set up a data stream to start measuring inside Google Analytics. Go to the Admin section. Then, click Data Streams.
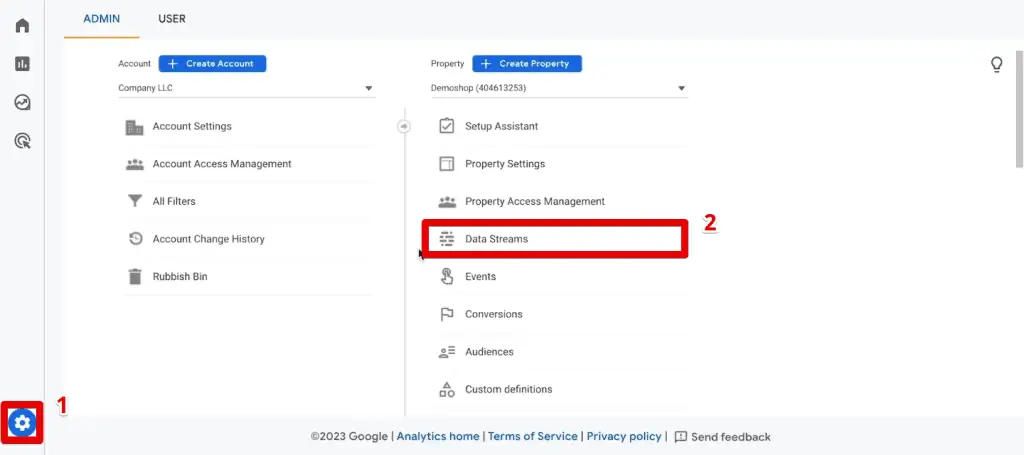
Data streams are the sources of data that go into your account.
You can send data between different platforms such as from a website, an Android app, or an iOS app, and theoretically, through a measurement protocol.
For our case, we are looking at a website, so select Web.

We need to provide our website URL to set up a web stream. Go to our demo shop and copy the URL.

Paste the URL back into Google Analytics. Next, name our stream Demo Website. If you have multiple data streams, you should easily distinguish this from them.
Then, we have the enhanced measurement option. These are a bunch of data that Google Analytics will try to gather for you automatically. We’ll leave this turned on and look at it later on. Click Create Stream.

Here, we get the web stream details and the instructions on installing our Google Analytics code onto our website. Google automatically detected that we were tracking a WordPress website and were using the WooCommerce plugin.

Using a plugin is one way to install Google Analytics on our website. The plugin deploys a JavaScript code in the background that gathers your data.
We can see the exact code by going to the Install Manually tab. The Google tag below needs to be installed on all the pages of your website for Google Analytics to work correctly.
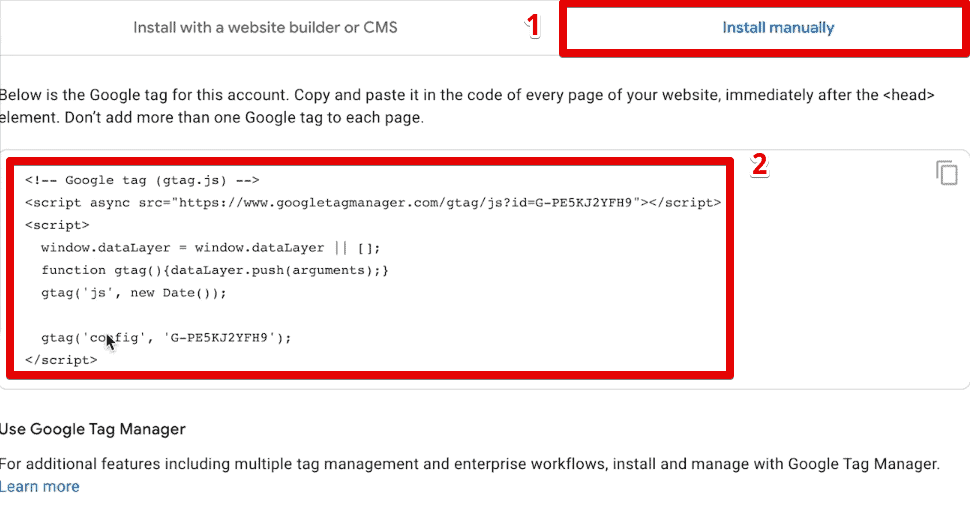
You might be intimidated and not want to do anything with code, but it’s only a copy-and-paste method. Depending on your website and its complexity, you might want to get some help from a developer to install this.
There are three methods for installing GA4 on your website.
The first method is using plugins. If your CMS is popular and has a plugin store or extensions, there is likely a way to install Google Analytics to your website without coding.
You can install a plugin onto your website and enter a measurement ID or tag ID. For example, here we have our tag ID.

Next, let’s go into the backend of WordPress, for example. Go to Plugins → Add New.

Search for available Google Analytics 4 plugins. Here, we have over 400 search result items.

The second way to install Google Analytics is by doing it manually. We will take this code and place it in the HTML source code of your website.
Go to your website, right-click on the page, and select View Page Source.

Viewing the page source opens up the HTML your browser downloads from the server.

We need to place the Google Analytics code here for your GA4 tracking to work, and you need to do this for all the pages on your website.
Now, the third way is my preferred way of installing Google Analytics. It’s a more involved process with a few more steps, but it will set you up for the future.
My recommended method is to use a tool called Google Tag Manager.
However, check out this guide if you want to delete an account in GA4.
Installing Google Tag Manager on Your Website
Google Tag Manager is a tag management system where you can set up certain tags like these Javascript codes.
If you do any professional digital marketing, you will deploy multiple tags and need some way to manage them. You would copy all these tags into your code base or use a tag management system like Google Tag Manager.
To set it up, go to tagmanager.google.com. Then, you need to create a new GTM account. Let’s model what we did inside GA4.
Let’s use Company LLC as the account name and select the United States for the country.
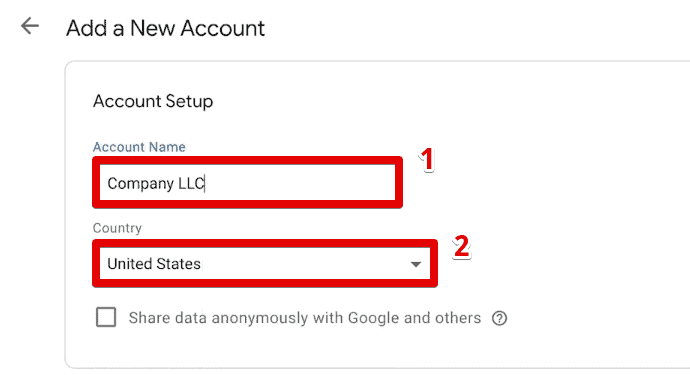
Next, we will set up our container. Containers work similarly to properties in GA4. They represent the type of your digital property. You will store all your tags, triggers, variables, and other related configurations within your GTM container.
Let’s use our website URL for the container name. Next, our target platform is the Web since we use a website. Finally, click Create.

Read through the TOS and tick the checkbox below to accept the conditions.

Finally, click Yes at the top to confirm.

Great! We have successfully created a Google Tag Manager container. To install GTM on our website, we only need to copy two pieces of code onto every page.

Again, there are plugins out there that you can use to make this easier. We will do this manually to show you the process.
💡 Top Tip: One plugin we can recommend for WordPress users is the GTM4WP or Google Tag Manager for WordPress plugin. If you need detailed instructions on how to use it, follow our GTM4WP Plugin Guide.
Let’s start with the first code. Copy the code.

Let’s go back to the backend of our demo store. Go to Appearance → Theme File Editor.
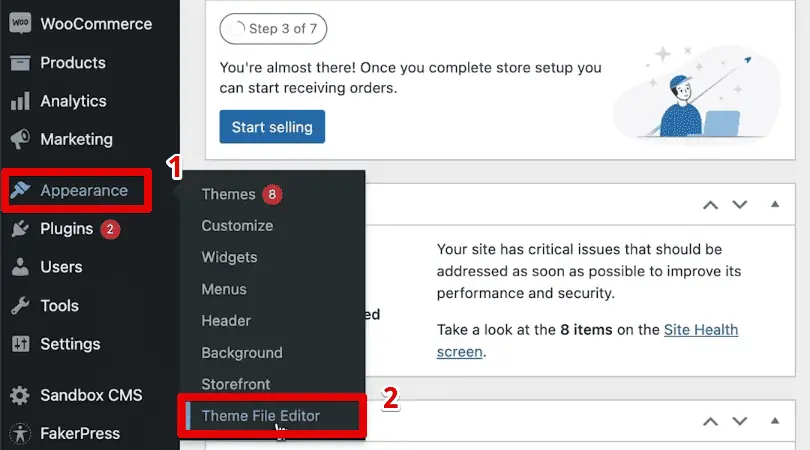
Next, open the Theme Header or the header.php theme file.

We will apply this theme file on all pages, so any change we make here will apply to all the pages.
Let’s dig through the code and look for the head section. Let’s paste the GTM code after the meta tags.
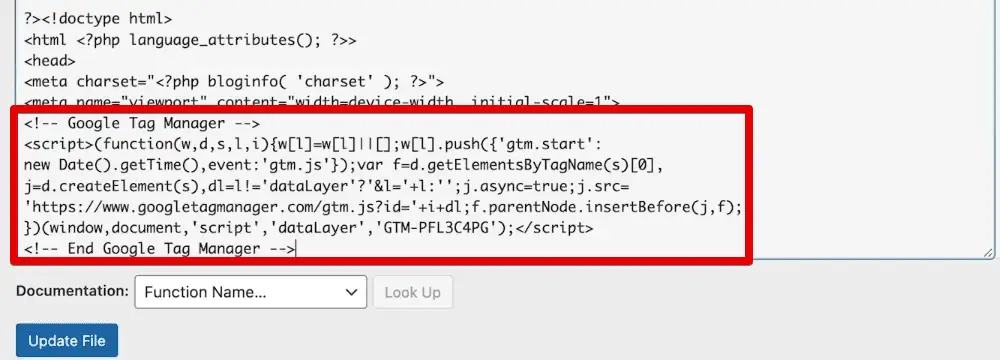
Next, we have the second code that we need to place immediately after the body tag. Copy this code.

Paste this code right after the body tag, then click Update File.

We now have GTM installed on our website. Let’s quickly verify if the code is running.
Go back to our demo shop and reload the page. Next, view the page source. We should now see the GTM code in the source code.

Great! Another check is to go into the GTM preview mode. Go to your Google Tag Manager account and click on Preview.

The preview mode puts the browser into a state where we can test our marketing tags before we deploy them live on our website.
Paste our website URL, then click Connect.

Here we go! Our demo shop will open in a new tab, and we should see that the Tag Assistant is connected. If you see this, it means that GTM is now installed on the website correctly.
With GTM installed, we can take our GA4 code and deploy it to our website through Google Tag Manager. We no longer need to touch the code anymore.
Go to Tags → New. Next, select the Google Analytics: GA4 Configuration tag template.

The New Google Tag Update
If you do not see the GA4 configuration tag, Google may have already replaced it with the new Google tag. Google announced they would replace the GA4 configuration tag with the Google tag. Both tags work the same.
Here is a diagram showing the difference between the two tag templates.

If you configured a GA4 configuration tag before, Google will automatically upgrade it.
🚨 Note: To learn more about this update, check out our article on the New Google Tag.
Here, we need to provide our measurement ID or tag ID, which we can get inside GA4. Next, check the option to send a page view when the configuration tag loads. If you use the new Google tag, you will not see the page view option, but Google enables it by default.

Next, we need to define the trigger.
Setting a Trigger
Triggers are rules on when you want to deploy your marketing tags. You can set rules to fire at specific pages or fire tags on all pages.
Click on Triggering.

Select the All Pages trigger.

Give a name to our tag, and then click Save.

We need to update our preview mode to try out our changes to the workspace. This mode only deploys our tags to our browser, so we can test it before publishing them on our website.
Click the preview button again and connect the Tag Assistant to our website. Here, we have fired our GA4 configuration tag successfully.
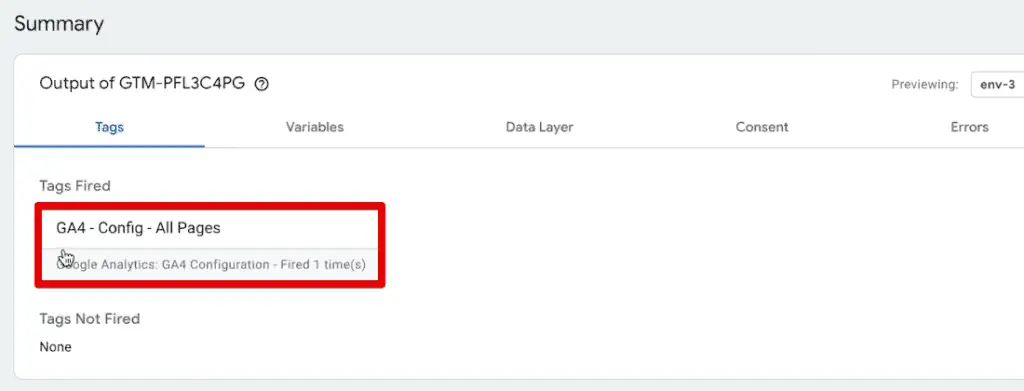
With our GA4 configuration tag, we should theoretically be sending data to Google Analytics. To test this, we can go into the admin section of GA4. Here, go to the DebugView.

GA4 DebugView
A crucial part of our Google Analytics 4 tutorial for beginners is learning how to test your implementations. With the DebugView, you can see all the hits from our browser.
The DebugView tries to show you events in real time, but batching occurs in the background. It usually takes a few seconds before seeing any hits.

For new websites, it will usually take up to a couple of minutes before any results come in. If you still have problems getting hits, try to go from page to page on your website.
Let’s open the beanie product page.

Great! We are now registering events in the DebugView. If we click on an event, we can look at the data that comes into GA4.
Click the page_view event.

Here, let’s check the page_location. This parameter should contain the URL of the page we just visited. It says we are on the beanie product page, which is correct!

Let’s go to another page again and confirm if events and parameters update correctly.
Go to Form → Newsletter Sign Up.

Open the new page_view event and check the page_location parameter. The URL should now be for the newsletter sign-up form.

Great! We are now sending data to Google Analytics properly. However, don’t forget that this is only for our browser. We need to submit a version of our container to publish our changes live on our website.
Click Submit.

Provide a version name so we can easily distinguish the different versions. Click Publish.

If anything goes wrong, you can restore previous versions of your tag implementation.

It is a refreshing system of Google Tag Manager. That is why it is my preferred way to install any tracking. This ability will be helpful in the latter section of our tutorial when we customize our GA4 installation.
🚨 Note: The steps we discussed for installing GA4 with GTM cover only the basics of the process. Our tutorial for Installing Google Analytics 4 with Google Tag Manager covers it in more detail.
Now that we have data flowing into our GA4 account, we need to ensure that the processing of that data is correct. We can influence this with some configurations.
Key takeaways:
- DebugView for Testing: DebugView in Google Analytics 4 is crucial for testing and verifying real-time event tracking on your website.
- Real-Time Event Tracking: It displays events such as page views in real-time, though there may be a slight delay due to data batching.
- Verifying Event Data: By navigating to different pages (like a product page or a newsletter sign-up form) and checking the page_location parameter in DebugView, you can confirm if events and their data are being captured correctly.
- Publishing Changes with Google Tag Manager (GTM): To make tracking live on your website, you need to submit and publish a version of your GTM container. This process allows for easy management and rollback of changes if needed.
- Ensuring Accurate Data Processing: After setting up data flow into GA4, it’s important to configure and verify the correct processing of this data for accurate analytics.
GA4 Configurations
Inside the admin section of our GA4 account, the account settings are all listed on the left, and the property settings are on the right.
Your configurations will mostly depend on your website, what data you’re gathering, and what you’re trying to achieve with it. However, below are a couple of base configurations that can apply to any account type.
Go to Property Settings.

We looked at the property details in the setup stage earlier. If you made a mistake earlier, you can correct them here.

In the Data Streams, you can connect multiple streams you want to track in parallel, choosing between an iOS app, an Android app, or a Website.

Then, we have Conversions. It is essential to set up your conversions properly. We’ll skip this for now and discuss it later.
Conversions are related to events, and we’ll get to event tracking once we customize our installation.

The most important setting that many people forget is under Data Settings → Data Retention.

Data retention sets how long Google Analytics will hold onto your data. By default, it is two months.
For privacy reasons, two months might make sense for your business. However, I usually tell clients to go for a maximum of 14 months. Next, click Save.

Next are the Data Collection settings. One to take note of is the Google signals data collection.

If you want to make GA4 into a data-gathering machine for advertising, turn on Google Signals. These settings are privacy-relevant, so take the time to read through these extra settings.
You can keep this setting off if you only want to use GA4 as an analytics solution.
Moving on to the Reporting Identity.

The reporting identity dictates how Google Analytics associates events with your users. We can choose between Blended or Observed. By default, Google uses the Blended method, which uses modeled data on top of the user ID, device ID, and Google signals.
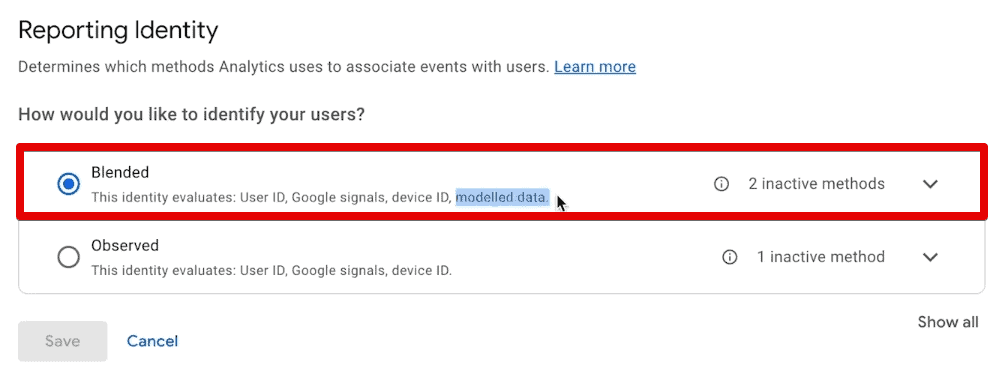
The blended method utilizes machine learning, where you feed your raw data into Google Analytics, and their model will try to figure out if somebody converted or not.
Next, we have the reporting attribution model. You can access this by going to the Attribution Settings. By default, Data-driven is the attribution model used.

The data-driven attribution model uses an algorithm to give credit to different touchpoints. The algorithm combines historical data from your account with AI modeling to determine how to credit each channel.
The other attribution model we can pick is the Last Click. As the name implies, it gives credit to the last touchpoint.
Finally, below are a couple of ways to connect Google Analytics to other products from Google.
For example, we have the Google Ads links.

I recommend linking the two products if you run ads on Google Ads and use Google Analytics to see user insights. Syncing up the two products lets you get richer insights.
Here, you need to be logged into the same Google account and click Link.

Next, the link setup is relatively simple. Select your Google Ads account, configure some settings, and establish the connection.

💡 Top Tip: Check out our guide on How to Link Google Ads to Google Analytics 4 to see how to import your conversions, find Google Ads data in GA4, and determine why there could be discrepancies between the data presented in each tool.
Second, we have something called BigQuery.

If you want to get a hold of the raw data and put it into the data warehousing solution of Google, then BigQuery is something you might want to set up.
🚨 Note: If you will use BigQuery with GA4, check out our guide on How to Use the GA4 SQL Tool for BigQuery. Learn how to use this tool to generate queries for BigQuery.
Finally, we also have a link to the Search Console.
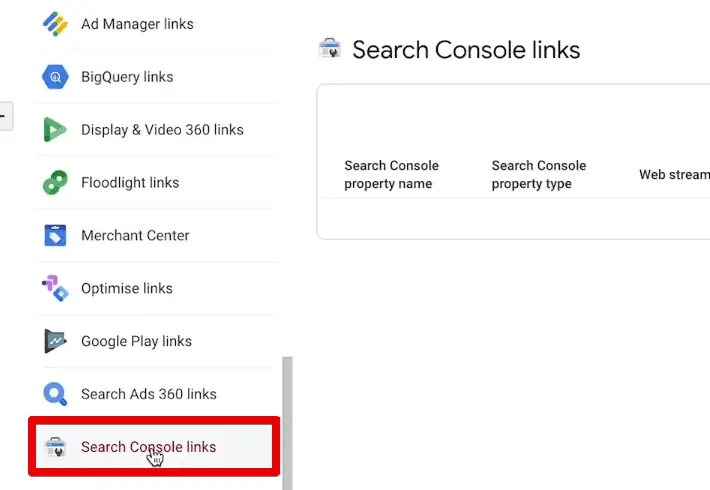
If you’re really into SEO and want to get insights from what Google sees from their search engine results, then you can connect the Search Console to Google Analytics.
Have a look and see if you can make use of these product links.
These are the most essential configurations you should set up. If you haven’t done these steps upon account creation, you can change them whenever you need to. If you change these settings later, some may not be retroactive.
Therefore, it is better to set your configurations up at the beginning.
With all these configurations done, we already have a pretty solid GA4 tracking setup. We are already gathering data through the GA4 configuration tag.
💡 Top Tip: To set your GA4 setup up for success, check out our Google Analytics 4 Setup Best Practices, where we explain the different settings you need to pay attention to during your GA4 setup.
It takes about 48 hours for Google Analytics to process the data correctly. Besides real-time reporting, GA4 is not as accurate in the first 48 hours after you install it.
Before we dive into all the reporting capabilities of GA4, an essential topic we need to discuss is events.
Events in Google Analytics 4
First, you must understand that everything you send to Google Analytics is an event. Think of events as tiny little data points. When users interact with your website, this information is sent to Google Analytics as an event, and GA4 processes it accordingly into reports.
There are four event types in GA4. Google collects the first two types automatically and requires minimal to no setup. Next, the last two types require that you implement them manually to see them in your Analytics.
First, we have automatically collected events.
These events come with your GA4 implementation, and Google tracks them automatically. Some examples include page view and session start events.
The second event type is enhanced measurement events.
Let’s go back to the admin section of our GA4 account and go to Data Streams. Here, open our web data stream.

Remember that we enabled Enhanced measurements during our GA4 setup? You can view that setting again here under the Events section.
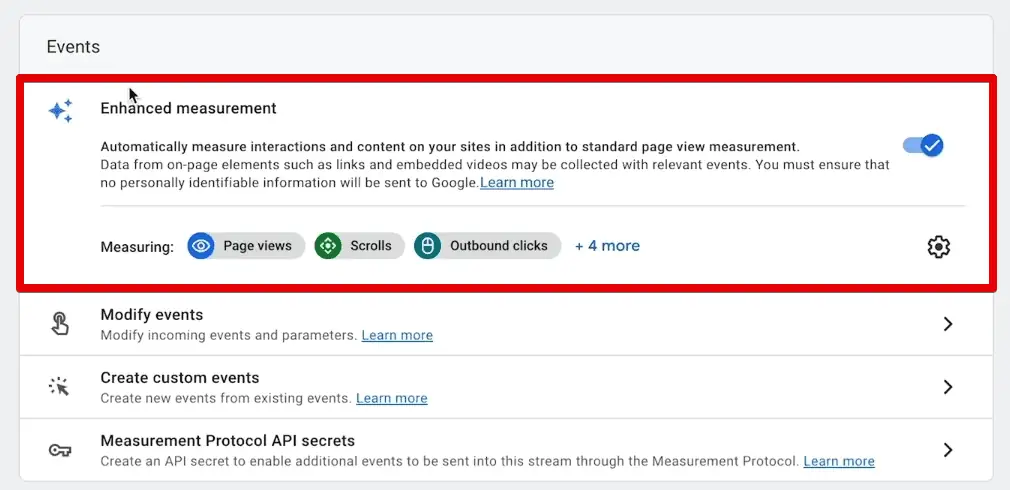
Enhanced measurement events are specialized automatic event trackings from Google Analytics, but you can turn each on or off.
We have the following measurement options: page views, scrolls, outbound clicks, site search, form interactions, video engagement, and file downloads.
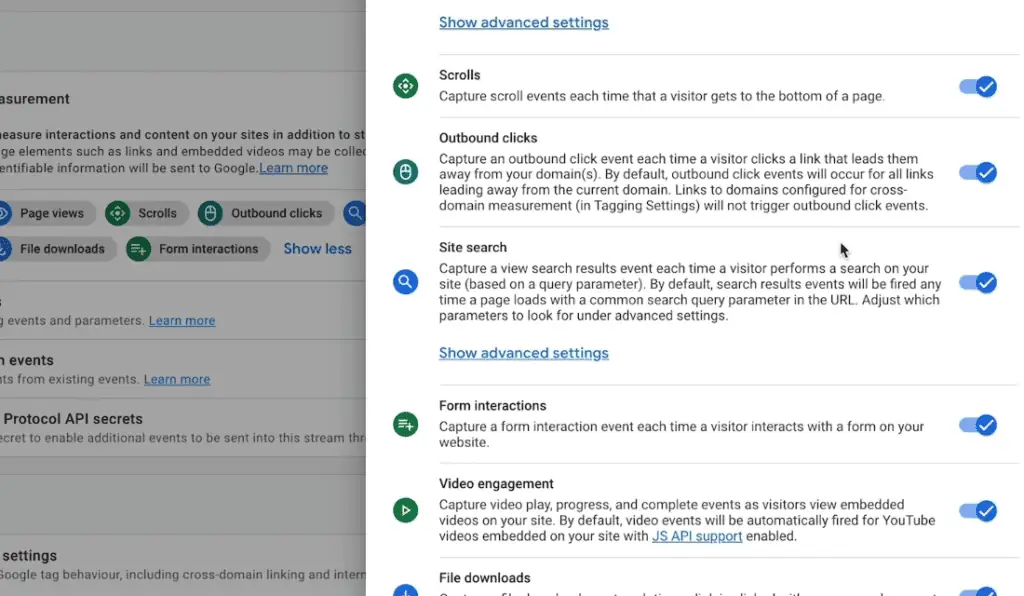
Generally, it is beneficial to implement these options. While they are worth considering, I have seen some problems with some of them. For instance, the form interactions option is something I prefer to create my custom tracking for.
Let’s turn off the form interactions.

If we want to continue monitoring form interactions, like when users submit their information on a newsletter form, we must set it up ourselves. We’ll add it back in shortly.
We will track explicit events with Google Analytics for the following two types. We will install them with our trusted tool, Google Tag Manager.
Let’s create our newsletter sign-up form interaction with the help of GTM.
💡 Top Tip: For an in-depth guide on GA4 event tracking, check out our guide on How to Track Events with GA4 and GTM.
Create a new tag. This time, select the Google Analytics: GA4 Event tag configuration.

Select the GA4 configuration tag, which stores our measurement ID. Hover over the question mark symbol next to the event name header and click Learn More to see Google’s recommended names.

Here, we will reach the recommended events documentation page.
Recommended events are the third GA4 event type. These are events with prescribed names and parameters so that you can get the most detail in your reports.
We have a list of events recommended to all customers for all business types.
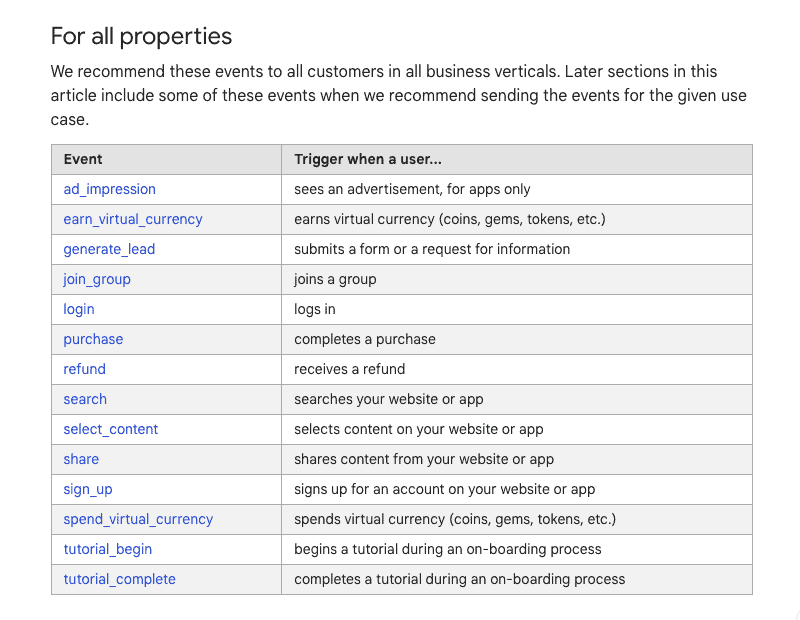
If you don’t find these appealing, you can create custom events, the fourth event type. You define this type of event when no other event works for your use case.
🚨 Note: Custom events won’t show in most standard reports, so you need to set up custom reports or explorations for more meaningful analysis.
Let’s create a custom event to track our newsletter sign-up.
Looking at the naming convention Google Analytics uses, all letters are lowercase and use an underscore instead of spaces. This naming convention is called the snake case.
Let’s adhere to the naming convention. Use newsletter_signup for the event name.

Now, we need to have a trigger. We want to fire our tag when someone fills out our newsletter form. There are different ways to track a form submission. These depend on how your website behaves when a user submits a form.
First, let’s determine how our website handles form submissions. Go to the sign-up form and fill out a test email. Next, click Submit.

We redirect to a thank-you page with a unique URL.

When someone arrives at this page, they have filled out our form. Let’s use this distinct URL as the trigger.
🚨 Note: We will only discuss tracking form submissions when you have a thank you page. Check out these 3 Form Tracking Techniques if your website behaves differently.
Back to Google Tag Manager, let’s create a new trigger.

Select the Page View trigger type.

We want to fire our trigger on only Some Page Views. Next, specify the condition for when the Page URL contains /form-thank-you/.
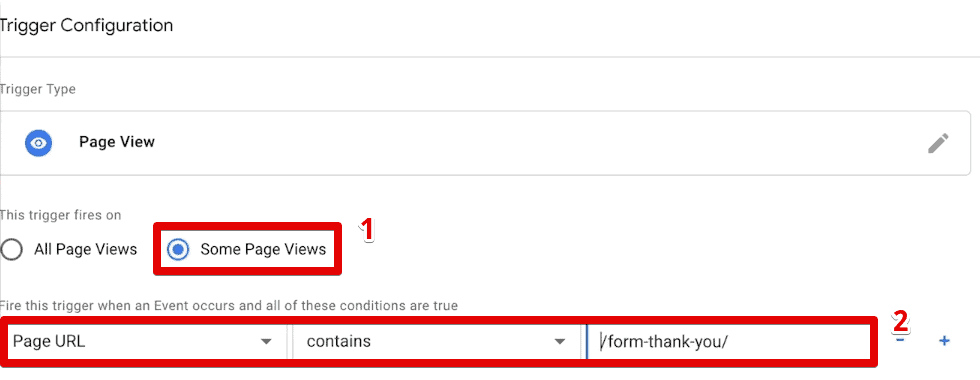
Let’s give a distinct name to the trigger. Then, click Save.

Now, let’s give the tag a name. Next, click Save.

Refresh the preview mode again and reload the page. Fill out and submit the form until you reach the thank you page.
Go to the Tag Assistant tab. We have successfully fired our GA4 event newsletter sign-up tag.

Let’s check if this also shows up in Google Analytics.
Go back to the DebugView. Here, we can see our brand new event called newsletter_signup.
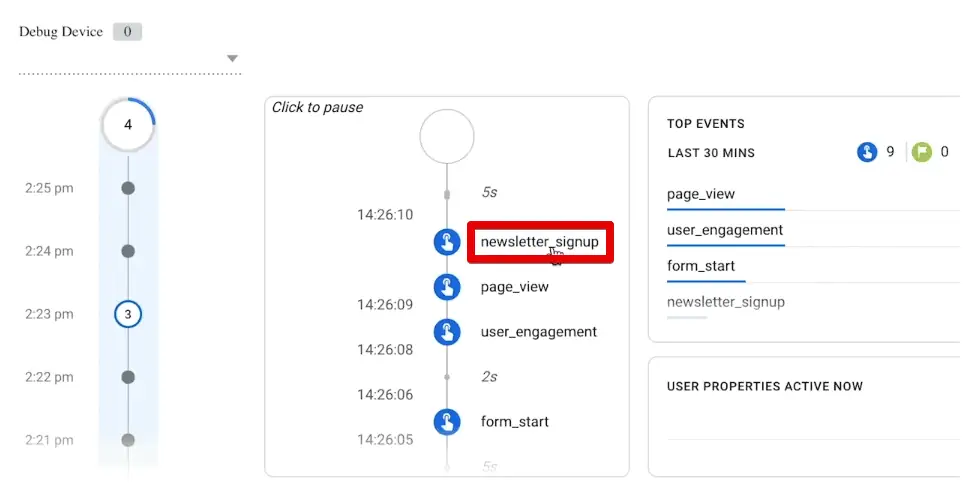
With this, we now have a distinct event for the sign-up form. We have made our GA4 setup more customized to our use case. It is way more controllable than what we have with enhanced measurement events.
🚨 Note: We should create custom definitions to see our custom events and their parameters in our reports. Follow our guide to learn How to Set Up GA4 Custom Dimensions.
Now, we created our event in Google Tag Manager, but have yet to publish it on our website. So, go ahead and submit the current version of our GTM workspace.
Provide a version name. Next, click Publish.

Now, we should be able to track all users who fill out the form.
I know you are eager to dive into your data inside Google Analytics. Since we have a new account, it can take up to 48 hours to process our changes. So, be patient!
Note that in the latter sections of our guide, you will see that we left the implementation running, and continued once we had data in our system.
Key takeaways:
- All User Interactions are Events: In GA4, every user interaction on your website is sent as an event, which GA4 processes into reports.
- Four Types of Events:
- Automatically Collected Events: These are tracked by default (e.g., page views, session starts).
- Enhanced Measurement Events: Specialized events that can be toggled on or off, such as scrolls, outbound clicks, and video engagement.
- Recommended Events: Prescribed by Google for detailed reporting, suitable for all business types.
- Custom Events: Created for specific use cases not covered by other event types; require custom reports for analysis.
- Recommended naming convention: using snake case (all letters are lowercase and use an underscore instead of spaces)
- Publishing and Patience: After creating events in GTM, they must be published to go live. Data processing in GA4, especially for new accounts, can take up to 48 hours.
GA4 Standard Reports
To see our data inside GA4, we need to go to the reports section. This section contains all the standard reports that show all the data gathered in our account.
I always go into the GA4 interface and ask a question. Then, I dug through the data and see where I could find the answer.
Since we have installed a custom event, a simple question we can ask is how many people signed up for our newsletter.
To answer this question, go to the Engagement reports and open the Events report.

Here, we have a chart on top and a table at the bottom. In the table, we can see the different events that happened on our website.

Where is our custom event? It is further down the table since we have only recorded this event a few times.

We can see that two users have gone through the form and have signed up for our newsletter three times. We can click on the event and get more information about it. Here, we have a chart with a timeline of the event count.

We can also see where the users that triggered this event came from.

Next, if you have Google Signals installed, you also get information about demographic data.
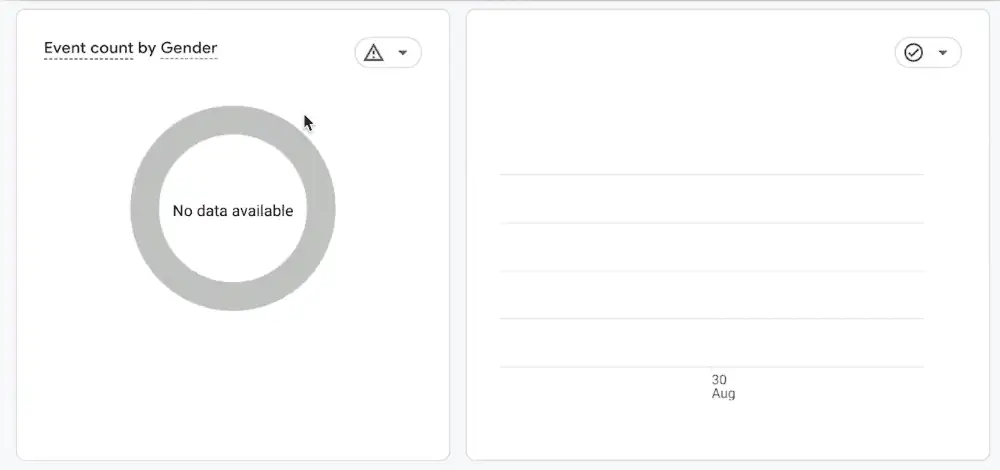
With these charts and tables, we have answered our question.
What about other questions? For example, where do people generally come from when they enter our website? We can answer this by going to Acquisition → Traffic acquisition.

If we scroll down, we see a table of the different session default channel groups.

💡 Top Tip: To better understand the different GA4 scopes of traffic, check out our article: Understanding GA4 Scopes of Traffic-Source Dimensions.
I often switch the primary dimension to the Session source/medium.

I chose this dimension because these are the ones I base my UTM parameters on.
💡 Top Tip: If you have no idea what UTM parameters are, you can check out our Guide to UTM Parameters in GA4. You can also look into How to Track UTM Codes in GA4.
We have a lot of people coming from Google Organic – this is our top channel.
We can see the number of users that came through, the sessions these users generated, how many engaged sessions there were, the average engagement time per session, etc.
Finally, we have the conversions.

What are conversions? Conversions are actions that you want users to take on your website. Depending on the website’s purpose, valuable actions may be for the user to buy a product, sign up for your newsletter, or click an ad.
In our case, our newsletter sign-up is an important event. How can we classify this as a conversion? Let’s go back to our admin section.
There are two ways of setting an event as a conversion. First, go to Events.

Here, we can see all the events we track on our website.

Here, we have the event names. We can toggle each event that we define as a conversion.
Toggle the option for our newsletter_signup event.

With this, we have set up conversion tracking for the newsletter_signup event.
You get the same functionality by going to Conversions and clicking the New Conversion Event.

Next, manually type in the exact event name and click Save. It needs to match your existing events precisely to record the conversion correctly.

I prefer the convenience of the first method since you won’t need to worry about typos.
Note that purchase events are always marked as conversions automatically.

Let’s return to the traffic acquisition report. We have the conversions, and we also have the total revenue attached to it.

To track revenue, you need to set up eCommerce tracking.
You can ask infinitely more questions about your data, try to get the desired answer, and get the insight you are searching for.
Different tools are inside the GA4 interface to help you reach that point. What are these tools? They are filters. We can filter our data based on specific criteria and look at our data from different angles.
Key takeaways:
- Accessing Data through Reports: In GA4, the Reports section is where you find standard reports displaying all the data collected in your account. This section is the key to analyzing user interactions and events.
- Understanding Traffic Sources: The Traffic Acquisition report under Acquisition provides insights into where website visitors originate from, including session source/medium, which is useful for analyzing traffic driven by specific marketing efforts (e.g., UTM parameters).
- Conversion Tracking: Conversions, which are the key user actions on your site (like newsletter sign-ups or purchases), can be tracked in GA4. You can set an event as a conversion either directly in the Events settings or under the Conversions section.
- Revenue Tracking and Data Filtering: For eCommerce sites, tracking revenue is crucial and can be done through eCommerce tracking. GA4 also offers various tools like filters to analyze data from different perspectives, allowing for more targeted insights.
Filters in Google Analytics 4
The first angle everyone usually learns about is looking at the data at different date ranges.
By default, standard reports show data for the last 28 days.

We can change this around and only look at specific dates. Let’s look at the data from August 30, 2023. Then, click Apply.

Doing this will filter our data to just the time frame that we have chosen.

The date range is one way to filter your data.
But, what if you want to concentrate on just Google Organic, for example? We can go to the search bar and search Google/organic.

If you have a big table, filtering by groups is more valuable than trimming it down to a single result.
Next, we can also add comparisons to our reports. First, let’s add a comparison date range.
Back to the date filter, and toggle the Compare option. Let’s say we want to compare it to the previous day. Select the Preceding period. Then, click Apply.

The results will give us a row for each comparison item and show the percent changes between each.

We also see the same thing in our visualizations. Seeing these figures side by side allows you to see trends or anomalies in your data. You could compare your data to the last period, the week before, or months before spikes or dips happen and see if there is a pattern.
💡 Top Tip: If you require a more thorough method for determining inconsistencies with your data, check our guide on Anomaly Detection in GA4.
Next, we can also compare other things like different traffic channels against each other.
Click Add Comparison at the top.

Select the Session source/medium dimension. Next, choose Exactly matches for the match type and Google/organic for the value. Finally, click Apply.

Create another comparison item for the bing/organic session source/medium. Remove the default all users comparison item.

Comparing Google/organic to Bing/organic, we have 22-0 users, 59-1 sessions, and 0 engaged sessions.

You can dig into the data, filter it, and enhance your understanding of what’s going on on your website and how your users behave when using your website. Try to utilize these tools that are available in the reports.
Let’s look at the other available reports inside GA4. We will switch to the demo account since it has more data.
Return to the Reports section and look at Acquisition, Engagement, and Monetisation.
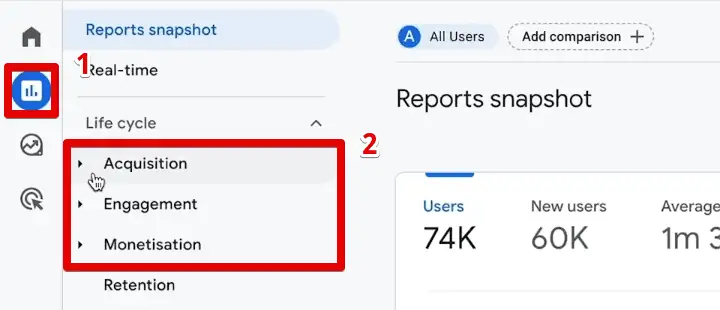
You can customize these eventually, but these are the categories by default.
💡 Top Tip: We have discussed the steps for customizing your reports interface in this article: How to Customize Your Google Analytics 4 Reports.
We have information about where users come from in the Acquisition Overview report. These are important for traffic tracking and marketing tracking or marketing analytics.

Next, we have the engagement reports. We looked at the Events report earlier. We also have the Conversions report. If you have multiple conversions, you can get insights into them.

Next, we also have the Pages and Screens report under the Engagement category.
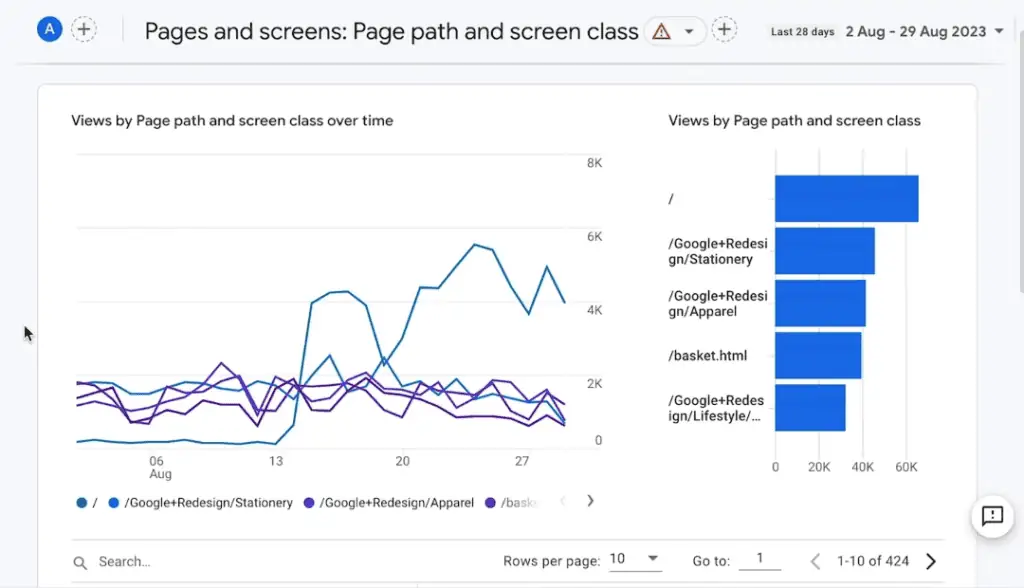
We can find out the most popular pages on your website, how users use them, whether they stay on these websites, and how long they stick around on each page.
Finally, we have the Landing page report.

The landing page report shows the first page the user sees in their session and what pages users use to enter your website. Knowing these pages is imperative because you want to have the best impression and present the best foot forward in the beginning.
💡 Top Tip: You can set up a landing page report in multiple ways. Check out our guide on How to Build a GA4 Landing Page Report to learn the four methods of building one.
Then, monetization reports are about the crucial actions on your website.
First, we have the E-commerce purchases report.

Here, you can see what products are sold the most in our merchandise store. You can see the number of times users viewed, added to the cart, and purchased each item. You also see the equivalent revenue.

Next, you can look up other information about the User purchase journey.
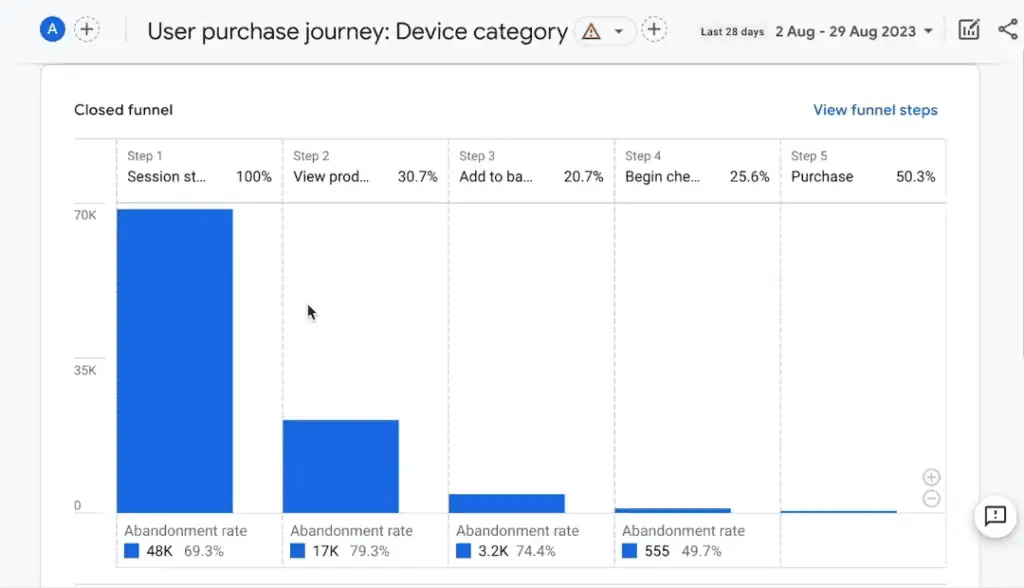
You can see how many people started their session, viewed the product, added a product to the basket, began checkout, and then completed the purchase.
Let’s go back to our demo store account to give a quick preview of how to customize your reports. Next, click Library at the bottom left.
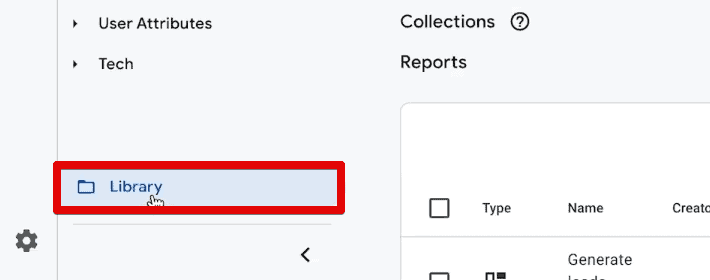
We can create more reports here from some templates or build one from scratch.

Reporting in GA4 does not stop with the standard reports. Our Google Analytics 4 tutorial for beginners would not be complete without discussing exploration reports.
Key takeaways:
- Date Range Filtering: Standard reports in GA4 default to the last 28 days, but you can customize this to focus on specific date ranges, allowing for targeted analysis of data within chosen time frames.
- Source/Medium Filtering: You can filter data to concentrate on specific traffic sources, like Google Organic, to analyze traffic from particular channels more closely.
- Comparative Analysis: GA4 allows you to add comparisons, such as comparing data to previous periods, to identify trends or anomalies. This can be done for date ranges or other dimensions like traffic channels.
- Report Categories and Customization: GA4 reports are categorized into Acquisition, Engagement, and Monetization. Each category provides insights into different aspects of user behavior and website performance. These reports can be customized for more tailored analysis.
- In-Depth Report Types:
- Acquisition Overview: Tracks where users come from.
- Engagement Reports: Includes Events, Conversions, Pages and Screens, and Landing Page reports, offering insights into user interactions and popular content.
- Monetization Reports: Focuses on eCommerce activities, showing product performance, purchase journeys, and revenue generated.
- Exploration Reports: Beyond standard reports, GA4 offers exploration reports for more advanced and customized data analysis.
Exploration Reports in GA4
One feature that GA4 offers is the ability to build your reports in a separate interface called Explorations.
To open this interface, click the Explore button below the reports section.
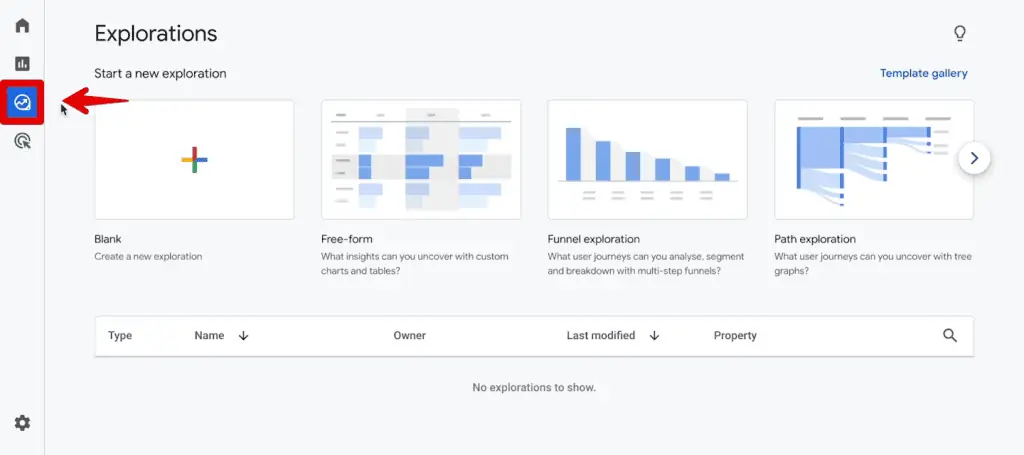
Here is the Exploration section where you can build different visualizations of your data based on predefined patterns.
Let’s return to the demo account. For this demonstration, let’s create a funnel exploration report.

It gives us this interface to add variables and tweak our settings for different funnel visualizations.

By default, we have a standard funnel. We can also create a Trended funnel.

You can see how each funnel step trends over time in a trended funnel. You can also specify if you want to make an open funnel.
These are the settings for the funnel visualization. It is excellent to use when you want to visualize the sequence of steps a user needs to take, like for a purchase.
You can also choose other report types. For example, let’s look at a Free-form exploration report. Here, we can build tables from scratch based on our event parameters.

Unfortunately, it is not yet possible to take your Exploration reports and put them into the reporting interface of GA4. It might happen further down the line since the only exception to this rule seems to be custom funnels.
You need to go in and explore the interface yourself because your website probably has different data than what we have here.
Now that you are familiar with the GA4 interface, you might ask yourself, where do I go from here? You want to get to the action step to get an ROI on your analytics investments.
I have three suggestions for you.
Key takeaways:
- Funnel Exploration Reports: These reports allow you to visualize user journeys through a sequence of steps, such as a purchase process. You can create standard or trended funnels, the latter showing how each step trends over time.
- Free-form Exploration Reports: This option lets you build custom tables from scratch, using various event parameters to tailor the data analysis to your needs.
- Current Limitations: As of now, exploration reports cannot be integrated directly into the main GA4 reporting interface, except for custom funnels. This might change in future updates.
Tips for Getting an ROI
The first thing is to look at your data regularly.
Look at all the questions you have for your data and try to find the answer. Check your data regularly to spot trends and elevate your understanding of your website user behavior.
Doing this will inevitably lead to action. Often, you will find things you want to change to improve user experience, optimize your funnel flow, or increase conversion rates.
Don’t forget to go back to GA4 and analyze if you see improvements once you have run the change. It is crucial to go through this feedback loop of experimenting and evaluating.
Our second tip is to connect another tool to Google Analytics called Google Ads.
If you use Google Ads to drive traffic to your website, you can improve your Google Ads campaigns through GA4 by connecting both of these tools.
There are different ways to utilize this connection. A powerful one is that you can build GA4 audiences and send them to Google Ads to retarget or use in your advertising.
For example, if you find out that certain people get stuck in a funnel flow and don’t buy, you can take this group as an audience. Then, push them to Google Ads and advertise to this group specifically.
Our third suggestion is applicable when you are only tasked with looking at the data.
For example, in larger organizations, you may not be the decision maker and cannot change something around right away. Instead, you need to present your findings to the decision-makers.
While Google Analytics has a decent interface, it can be overwhelming. Another tool from Google lets you visualize your data on a dashboard – Looker Studio.
With this tool, you can build dashboards like the one below.

It is easy to set up. To demonstrate, let’s build a report. In a report, you can connect to various data sources. Conveniently, it has a built-in Google Analytics connector.
Click Add Data → Google Analytics.

We can choose our demo property or our account and connect that to Looker Studio. Then, we have this open canvas where we can place charts.
For example, we can add a line chart, bar chart, or table.

Once we have finished creating our report, we can also share this with our stakeholders.

Your stakeholders don’t need to access Google Analytics itself.
💡 Top Tip: If you want to get started with Looker Studio, here is our Looker Studio Basics guide that contains all you need.
There are more action steps that you could take, but these are the crucial ones. Always ask yourself, what can I do based on this data? That is how you can get an ROI on your analytics.
Key takeaways:
- Regular Data Review: Consistently analyze your GA4 data to identify trends, understand user behavior, and find answers to specific questions. This regular review can lead to actionable insights for website improvements.
- Integrate with Google Ads: Linking GA4 with Google Ads enhances your advertising strategies.
- Data Presentation for Decision Making: In larger organizations, where you might not directly implement changes, use tools like Looker Studio to present data findings effectively.
Beyond the Basics
We are nearing the end of our Google Analytics 4 tutorial for beginners. You should have the basics down, but how can you go further with GA4? Let me give you a few more tips.
Since the knowledge involved in Google Analytics can get pretty deep, we created this little GA4 Mind Map that shows you GA4 and its basic concepts.
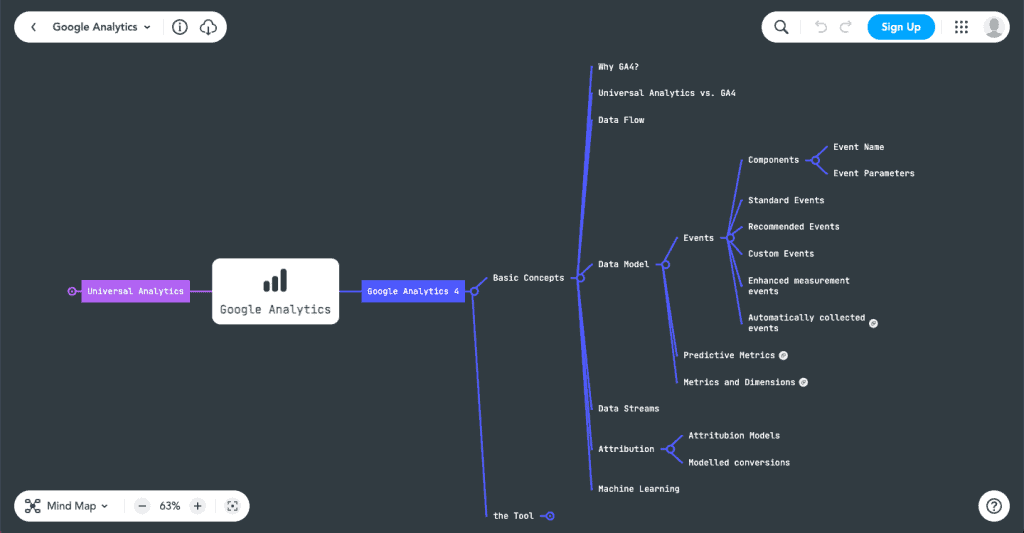
Here, you can see why you should use GA4, UA vs GA4, the data flows, data model, data streams, etc.
If you dive deeper into the tool, you might want to look at other measurement forms, how the processing works, and how you can efficiently go into the analysis.
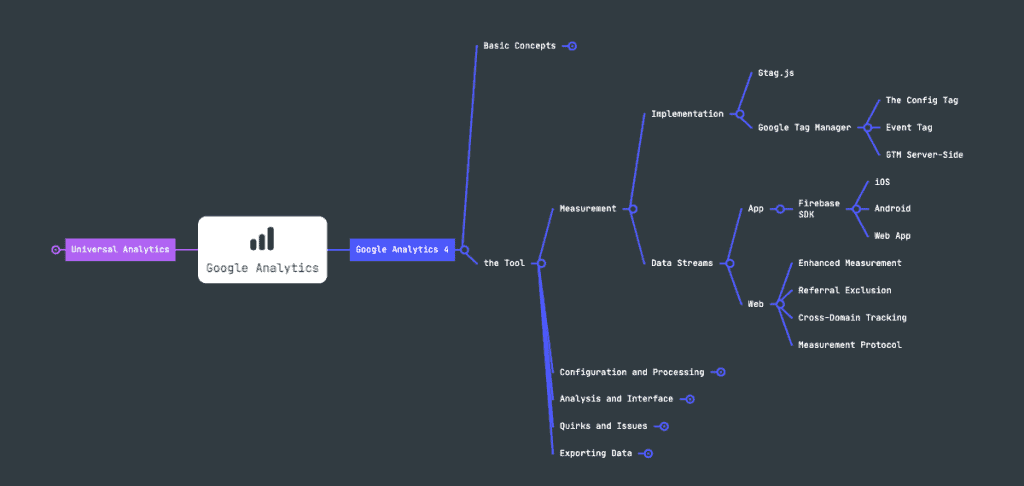
We also have some quirks and issues you will know once you are more experienced with the tool. Finally, exporting data is something you might want to discover with BigQuery, Google Sheets, or Google Data Studio, which is now Looker Studio.
We also have resources available for you. If you like to dive deeper, check out our MeasureSchool YouTube channel.
We have resources about Looker Studio, Google Tag Manager tutorials, and various tracking guides for GA4. All of these are available on YouTube and here on our MeasureSchool Blog.
We are always writing in-depth posts about GA4, Looker Studio, and other analytics tools.

If you want to go even deeper, we also have paid resources. We have the MeasureMasters membership, where we teach you how to master the art of tracking and becoming a data expert.
Another thing I want to shout out is our GA4 Firefighting Kit, which gives you essential templates and documents to show how to install analytics tools.

If you want to look at how to install tracking mechanisms for GA4, we have these SOPs. We also have these checklists. For example, there’s a GA4 audit that you can go through, as well. It is a handy resource for anyone who deals with these implementations often.
💡 Top Tip: We have this discounted link for you to check out if you want to get this resource.
Summary
That’s it with our Google Analytics 4 tutorial for beginners. We hope you enjoyed it! We covered how to install GA4 on your website and GTM to create custom events, how to use the GA4 DebugView, and configurations and filters you can implement.
Next, we also covered the reporting interface, the standard reports that come with your installation, and how to create custom reports in the exploration section. Finally, we shared tips for getting an ROI and going beyond the basics.
You must set up your event tracking properly since every action you want to track is an event. Check out our GA4 Event Tracking Checklist to ensure proper tracking configuration.
What data do you wish to pull from your website/app? Which GA4 feature is the most appealing to you as a data analyst? Let us know in the comments below!
If you need help with your Google Analytics, check out our Google Analytics services.


