
Last Modified on January 7, 2025
Google BigQuery is part of the Google Cloud Platform and provides a data warehouse on demand. You can upload structured data into tables and use Google’s cloud infrastructure to quickly analyze millions of data rows in seconds.
In this Google BigQuery tutorial, we’ll give you a quick overview of how you can use BigQuery to maximize your workflow efficiency.

Subscribe & Get our FREE Query GA4 data in BigQuery eBook
An overview of what we’ll cover:
- What is BigQuery, and Why Use It?
- How to use Google BigQuery
- Visualizing a BigQuery Dataset in Google Data Studio
Google BigQuery is part of the Google Cloud Platform and gives you an on-demand data warehouse.
You can upload structured data into tables and use Google’s cloud infrastructure to quickly analyze millions of data rows in seconds.
In this tutorial, I’m going to give you a quick overview on Google BigQuery. You might have heard of BigQuery before.
It has become more popular in recent years among marketers thanks to its ability to house and analyze data from sources like Google Analytics or Facebook Ads. BigQuery is especially effective with enormous datasets that can sometimes lag in smaller analysis programs.
I will focus here on taking you through Google BigQuery’s basic functionalities. We’ll discover what it’s primary uses are and how to improve your workflow with it. However, this is by no means a full tutorial on BigQuery. There’s much more to discover!
If you’re interested in finding out more about BigQuery, we’re offering a course as part of our MeasureMasters program. For now, let’s familiarize ourselves with BigQuery. Now we’ve got lots to cover, so let’s dive in.
What is BigQuery, and Why Use It?
BigQuery is a serverless data warehouse which you can use to analyze large volumes of data using SQL.
To give you an idea, BiqQuery can deal with petabytes, which is the equivalent of 1000 terabytes (or 500 billion printed pages).
Our journey starts at cloud.google.com/bigquery. Google BigQuery is actually part of the Google Cloud Platform, which has many different tools. BigQuery is just one of several, but it’s worth taking the time to get to know.
Some benefits of using BigQuery include:
- Real time analysis of massive datasets at lightning speed
- Predictions for business outcomes using machine learning
- Easy to share with team members and integrate with visualization tools
- Low (or no) cost, low maintenance
- High security, high reliability, high scalability
Needless to say, you need a Google Cloud account, but you can create one for free. You don’t have to give Google your credit card information, and if you don’t want to upgrade, you can actually leave it at that. In fact, BigQuery is part of Google’s Always Free coverage on Cloud, within certain data limitations.
So what is BigQuery? Well, Google Cloud’s page calls it a “serverless, highly scalable, and cost-effective cloud data warehouse designed for business agility.”

That’s a mouthful. What you just need to remember is the “data warehouse” part. Google BigQuery can store vast amounts of data and help you analyze them, transform them, or process them further according to your needs.
You might be familiar with this concept if you have been working with spreadsheets before, particularly applications like Google Sheets or Microsoft Excel.

Spreadsheet software will let you input data just like this in a table format. You have rows and columns for different categories and items, and then you can analyze the data that populates your cells.
For example, you can use formulas to calculate things in your dataset. Use the formula =SUM in your formula bar and you can get the sum of a whole column of data. The given sum will also update automatically if the data changes.
If you’re using spreadsheets, you might also use filter options to answer your questions. If you click the filter icon in your topbar, you will be given the option to filter by any of your columns. Clicking on a column’s filter button will give you a popup with which you can specify your filter.
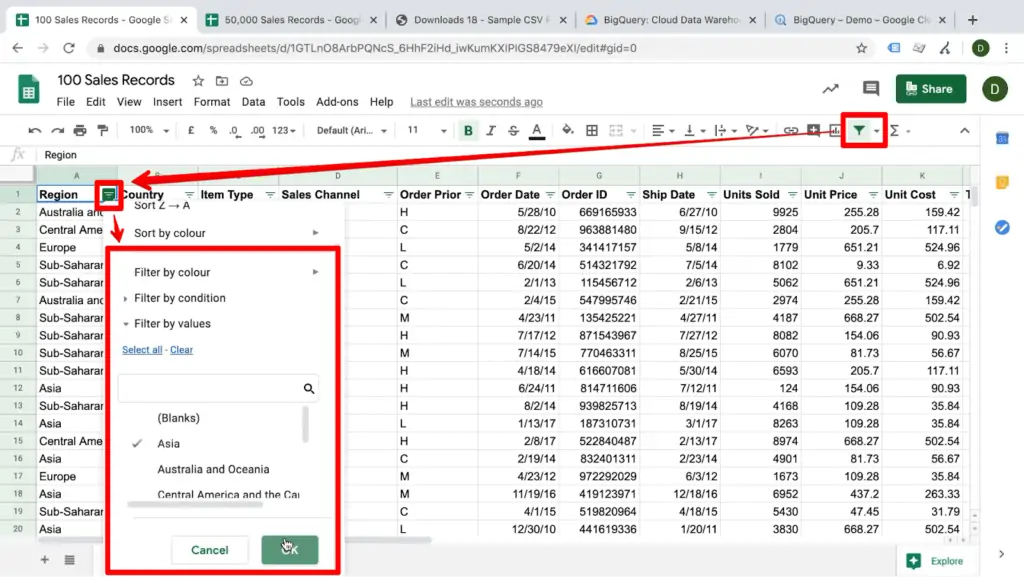
In this case, we’ve filtered a sample dataset of one hundred sales records to include only sales from Asia. If you wanted to analyze only sales to Asia, you could work with just this filtered data.

Now, this all works beautifully with this particular dataset. But what if you have more sales data? In this example, we had a hundred records. Let’s play with a sheet that has 50,000 sales records. Right away, you’ll notice that it’s not as responsive anymore.
If we try to use our sum formula again, it takes a little while to calculate. If you start asking your spreadsheet program to do too much, you’ll get stuck with this loading bar in the corner while you wait for your analysis.

Sometimes it may seem like the application is stuck, and you don’t have any indication that it’s actually still working. You can try reloading, which may or may not work and you may lose whatever analysis you just asked your program to do.
In general, a large dataset makes everything slower and sometimes even unworkable. This is where you might want to use BigQuery.
Using Google BigQuery
So let’s enter Google BigQuery. As mentioned earlier, you need a Google Cloud Platform account. Once you’re logged in, you create a project up in the toolset in the top bar.

If you open the menu, you’ll see all the different offerings and services of the Google Cloud Platform. Scroll down a bit to find BigQuery and open it.
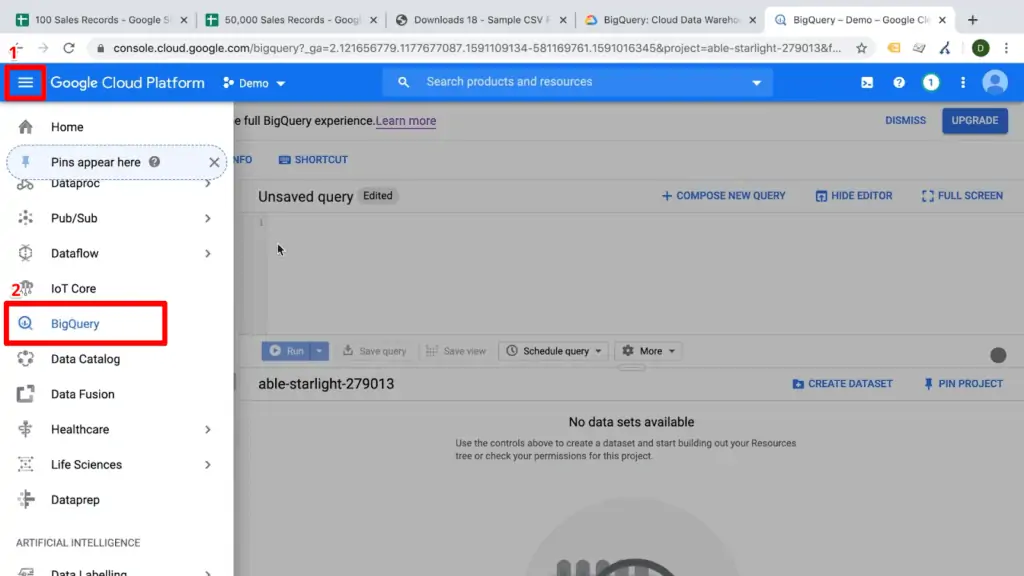
Once you’re in, you can see here we are in a sandbox. This means we are using the free version of BigQuery. This sandbox account is a bit limited, but it suffices for this tutorial. If you find that the limitations get in the way of your analysis, then you can always go back and upgrade your account. For now, you can go ahead and click Dismiss.

This is the BigQuery user interface. The middle of your interface will show all your data, queries, and analysis results. On the left side, we can see our Cloud project under Resources. This is where we will begin.

Creating a Dataset
The first thing we need to do in BigQuery is creating a dataset. Handily, there’s an aptly-named Create Dataset button right in the middle of our interface for you to click.

You’ll be prompted with a configuration popup. Let’s call this “Demo.” I’m going to skip all the other configurations for now and just click Create Dataset.

On your BigQuery interface, you’ll get a notification saying that your dataset was created. Follow the notification to see your new dataset.

And here is our Demo dataset. From here, we can create tables that we can populate with data, just like our earlier spreadsheets. Click on Create Table.

If we don’t want a blank table, we’ll need to upload our data from an existing source. You can upload from services like Google Storage or Google Bigtable, build a cloud function that pushes data automatically, or even utilize third-party platforms such as Supermetrics to pull your data for you.
Where you get your data depends on your individual workflow. For our demo, I will upload a CSV file from eforexcel.com/wp/downloads-18-sample-csv-files-data-sets-for-testing-sales/. Make sure this new table will be associated with your current project, and give it a recognizable name.
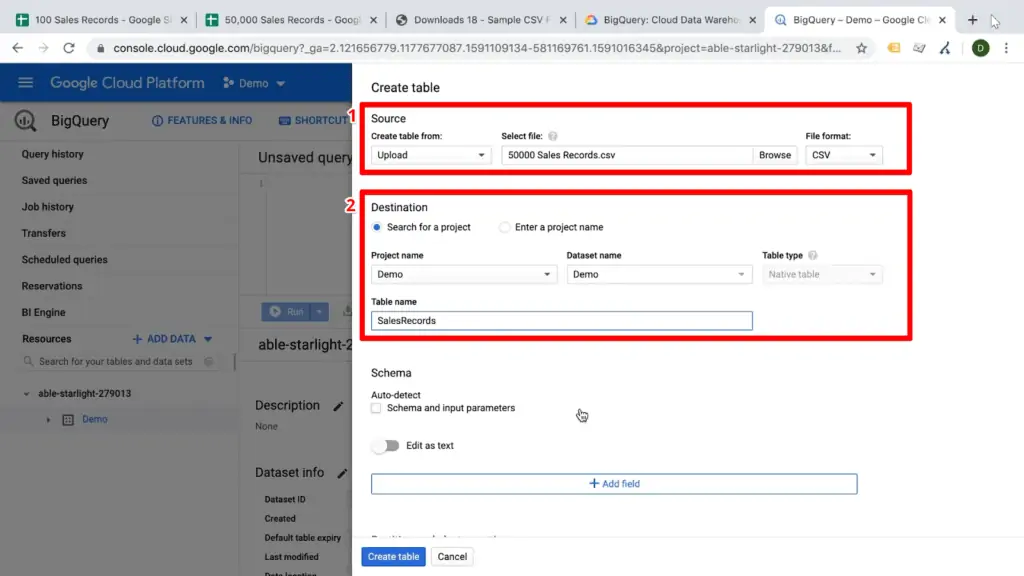
The table configuration popup will also ask if you’d like it to auto-detect schema. This is very important because we need to model our table after the table’s columns and what type of data they represent. Your data may include strings, Boolean, integers, and floating values.

BigQuery can auto-detect those schema if they’re correctly filled into the CSV, which simplifies your analysis considerably. Check the box to auto-detect schema. For now, we’ll skip these other advanced options and click Create table.

You’ll get an interface notification that your dataset has been created. Follow the notification to see the load job for your new dataset.

Now we have our sales records in our BigQuery table. Under the Schema tab, BigQuery will show you all the different columns that were detected.

If you click the Preview tab, you’ll see all the data was uploaded in basically the same format that we had in our sheet.

Querying Your Dataset
Now, what can we do with this table?
We can query it. This is where SQL comes in, if you are familiar with it. Don’t worry if you’re not, though, because I’ll walk you through the basic process.
In this top window, you will enter your query based on SQL. You can run all kinds of different operations to make an inquiry of your data.

What might this look like? Let’s click on this query table and add a simple SQL statement to select specific pieces of data. Click Query Table to get a statement template.
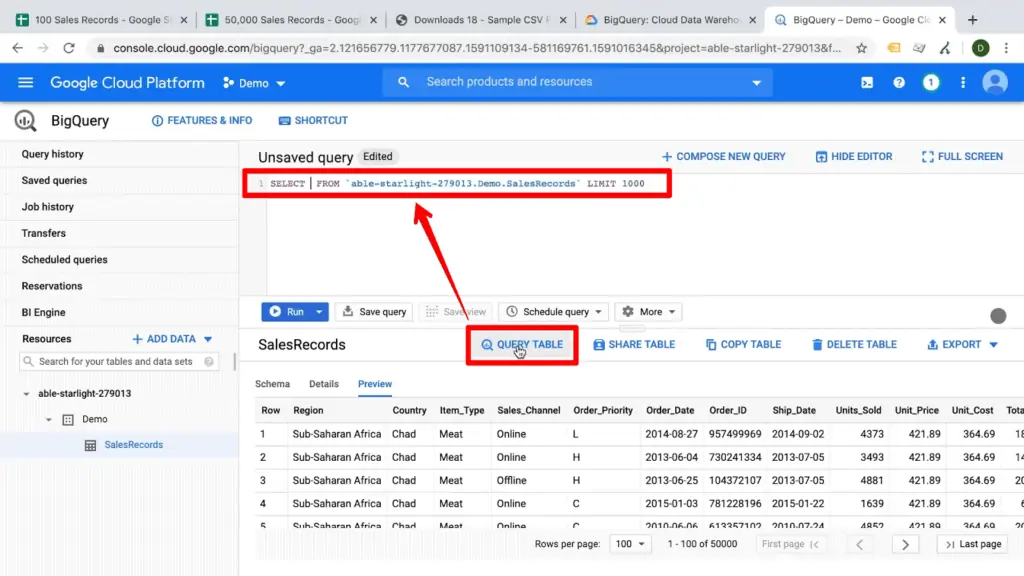
We can insert an asterisk into the statement to select everything from this table and then limit the output to 1000. Click the Run button to run your query.

After just one second, we get our data back with results in the bottom half of the interface. It’s basically the same table since we used the asterisk, which selects all the data.

But the beauty of SQL is that it can do pretty much any kind of analysis that you would be able to do in a spreadsheet. To make this a little cleaner and easier to follow, select Format from the More dropdown button.

Now that’s a little more readable, and you can see the keywords that SQL uses. If you want to learn more about SQL, see this cool YouTube tutorial on SQL, but for now you can just follow along with this tutorial.
To pull only certain pieces of your data, such as schema, we can delete the asterisk in our query and go back to the dataset by clicking on it under Resources. Then, with your insertion point under Select in your query, you can simply click on the schema in your dataset that you want to pull. They will be inserted into your query automatically.
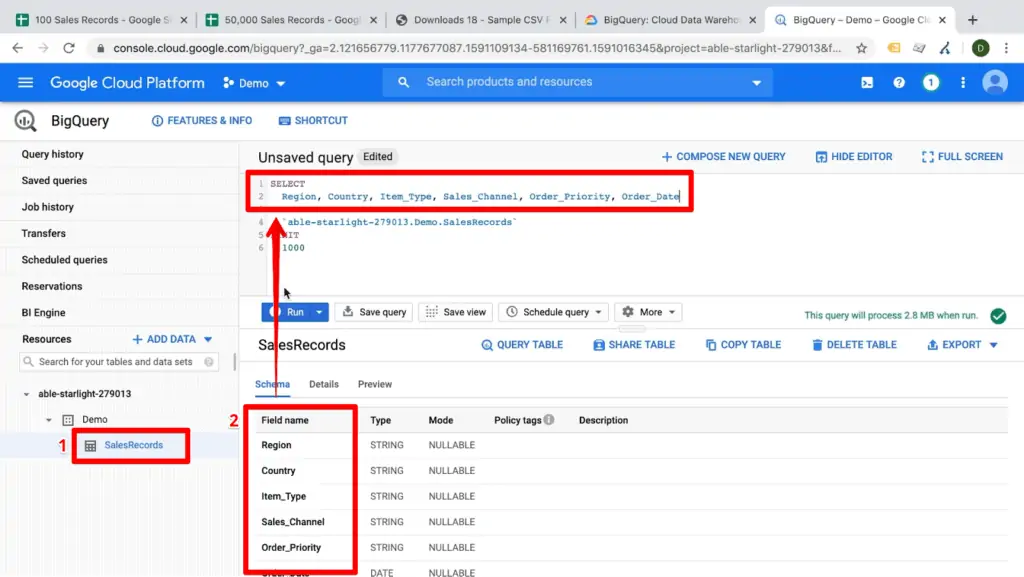
Click Run, and your query will return just the columns you requested. This is much cleaner and simpler to look at, especially if you don’t need all of the columns in your current analysis.
We can also run analyses like we did before with our spreadsheets. If you want to calculate something like total profit, you can enter a formula in your query. In this case, we can type “SUM” and put the name of the scheme “Total_Profit” in parentheses after it. Run this again, and you’ll get your summed results back.
Grouping Data
We can also order or group our data together. For example, we can group the sum of total profits by region to show us each individual region’s profits.
Add the column name “Region” to your Select section, and enter a new column name to label the results you want to pull. “Profit_by_Region” makes sense here. Next, add a new keyword Group By between From and Limit. Under this, insert “Region.”
Click Run to see some beautiful results sorted by region.
Saving Queries
If you want to run this analysis regularly, you can save this query for reuse by clicking Save query. You can also click Save results if you want to push the data somewhere else for additional storage or analysis. Lastly, there is an option called Save view.

Save view will actually create another table within your BigQuery dataset based on the query that you have just written. Give it a descriptive name and click Save to create a new table that we can work with even further.

This new table only has two columns as the schema data, and we can utilize and query this metadata even further. You can repeat this process as many times as you need to answer any and all questions about your data.

Visualizing a BigQuery Dataset in Google Data Studio
Google BigQuery can be super valuable to analyze large datasets with SQL, but I’m also a big fan of transforming my original data inside of BigQuery. Why? It’s in a super useful format for analysis, but it’s still kind of raw. Then, I can use the power of Data Studio to visualize my data.
To move your BigQuery table to Data Studio, click the Explore Data dropdown and select Explore with Data Studio.
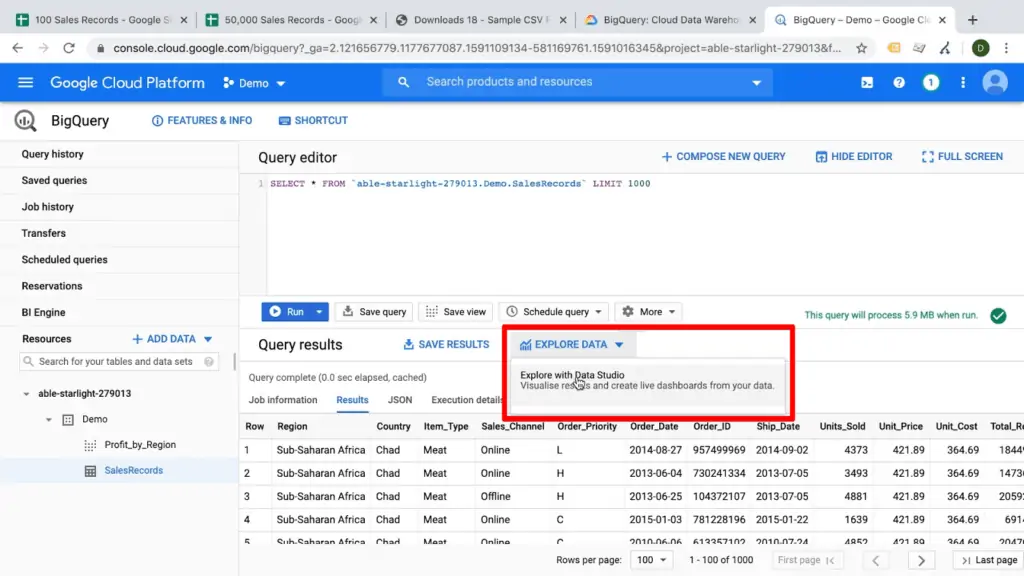
If your Google accounts are connected, this will open up Data Studio in a new tab with your dataset from BigQuery.

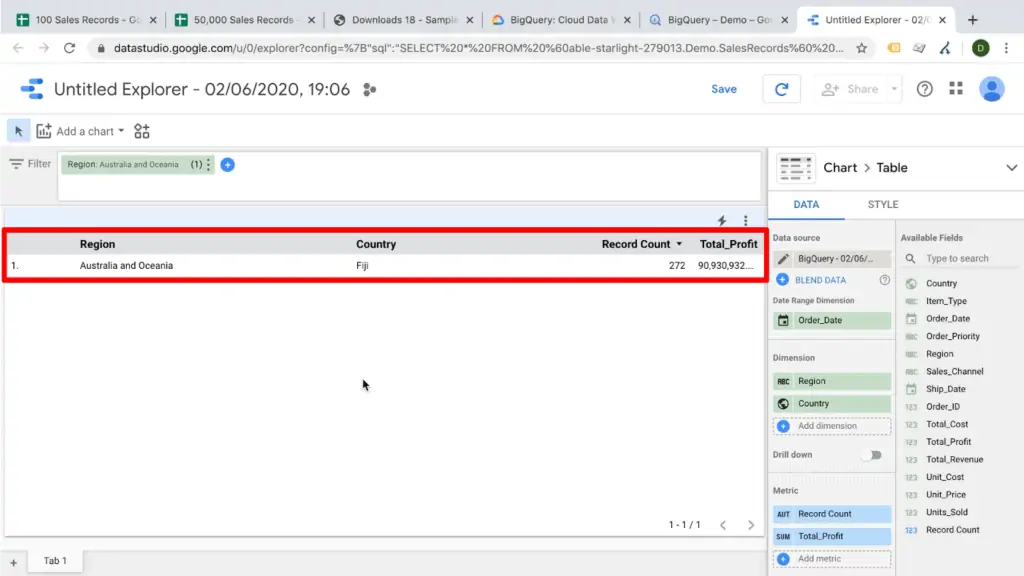
Now this is not a full dashboard, but rather simply one chart. You can add dimensions or metrics from your dataset to organize how your data is displayed.

The filter function at the top of your dashboard can filter your dataset to show only one specific area or subset. You can drag fields into your filter just as you would drag them into your metrics or dimensions

Once you have selected a field to filter by, you can open up a filter menu to specify which data you would like to pass through your filter.

Once filter parameters have been selected, your dashboard chart should only show your filtered data.
Now, you can run any kind of analysis right here. You could also build calculated fields, plant data together with other data, or use custom functions with custom metrics that you create in Data Studio.
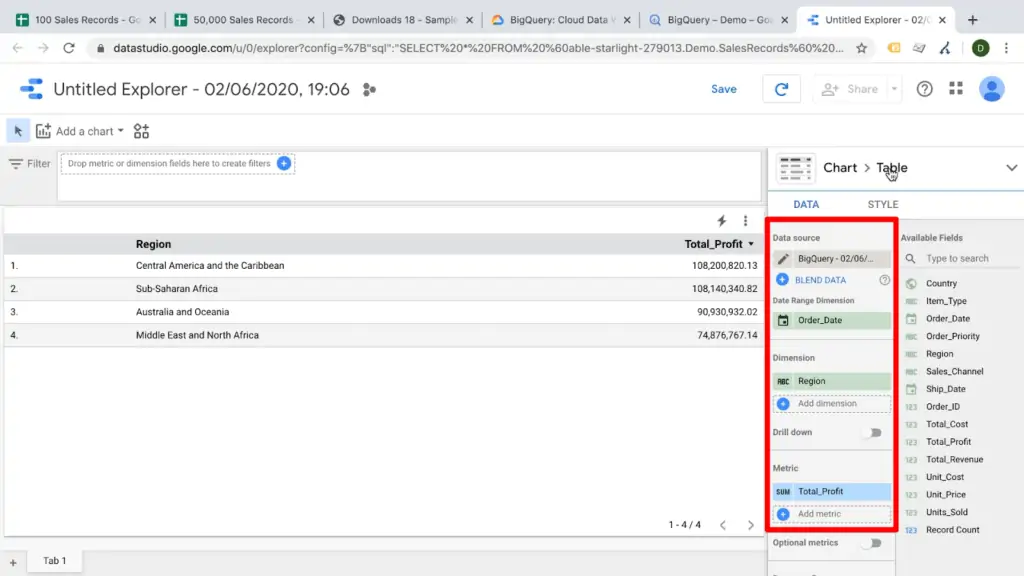
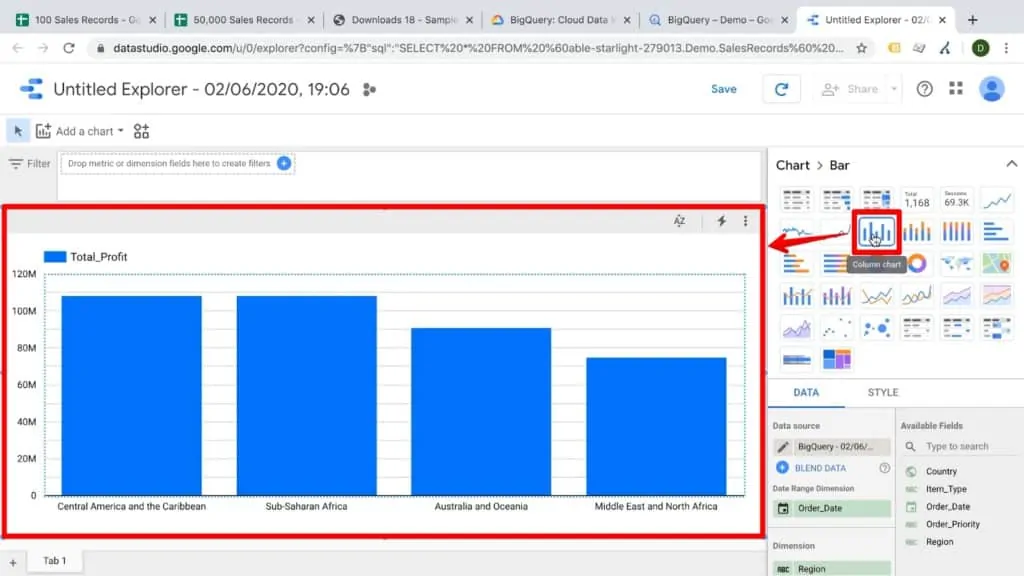
To show you how to work with your chart a little more, let’s remove the filter and go back with new parameters. In this case, let’s have “Region” as our dimension and “Total_Profit” as our metric.
Let’s visualize this data as a bar graph. Click the Chart > Bar dropdown and select a column chart.
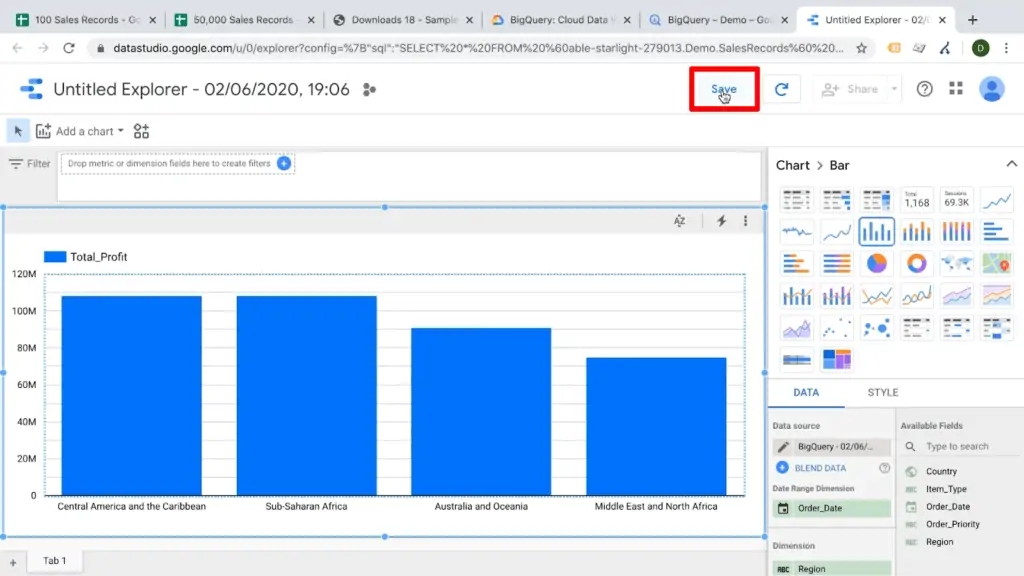
If you like what you’re seeing, you can integrate this chart into a new report to combine it with other visualizations. Start by clicking Save in the top bar.
Once it’s saved, click the Share dropdown and select Create a new report and share. This will generate a new Data Studio report that includes your bar graph.
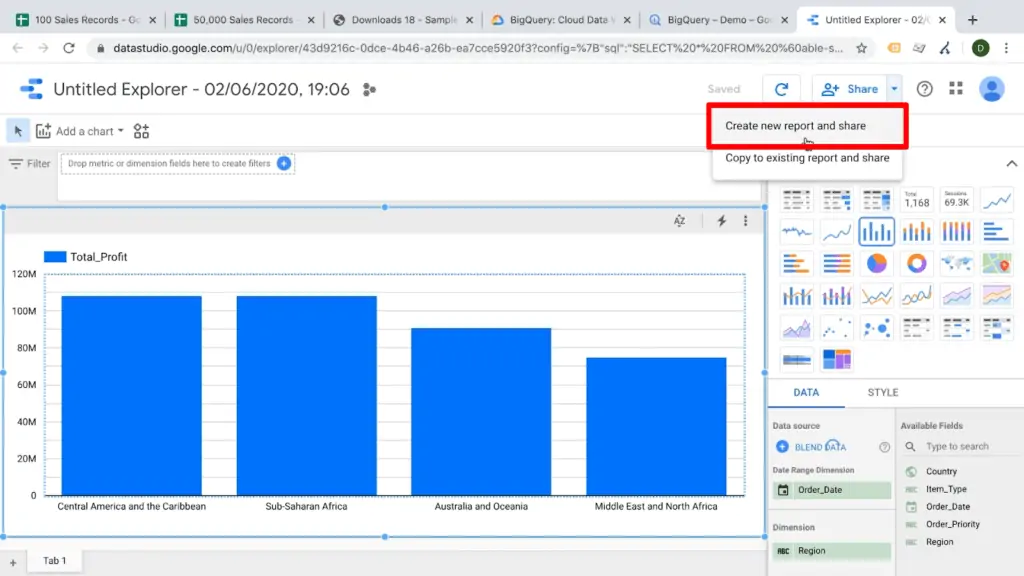
In the new report, you will be immediately prompted with a popup that informs you that you’re connecting this report to a data source in BigQuery. This is what we want, so click Add to Report.

From here, you can create more graphics and charts with the new BigQuery data source.

So this was a quick overview of the capabilities of BigQuery. There’s much more to explore by yourself on the BigQuery interface, but if you get stuck, Google has great documentation and support.
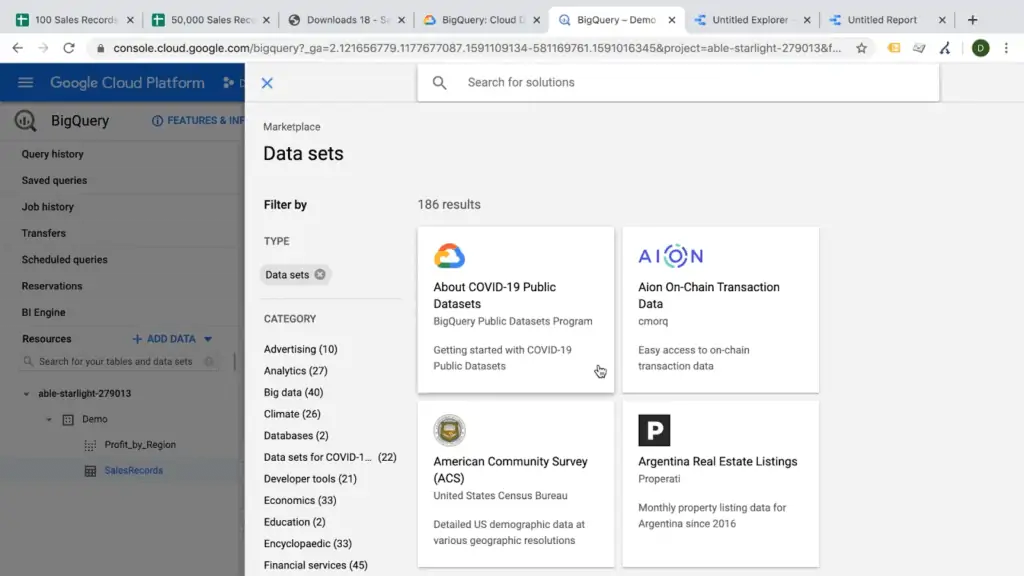
Although we just went through a very small example here, BigQuery is capable of analyzing huge datasets from Google Analytics, raw data, Facebook Ads account, and many other data sources. If you click the Add Data dropdown, you can even access public data sets in BigQuery.
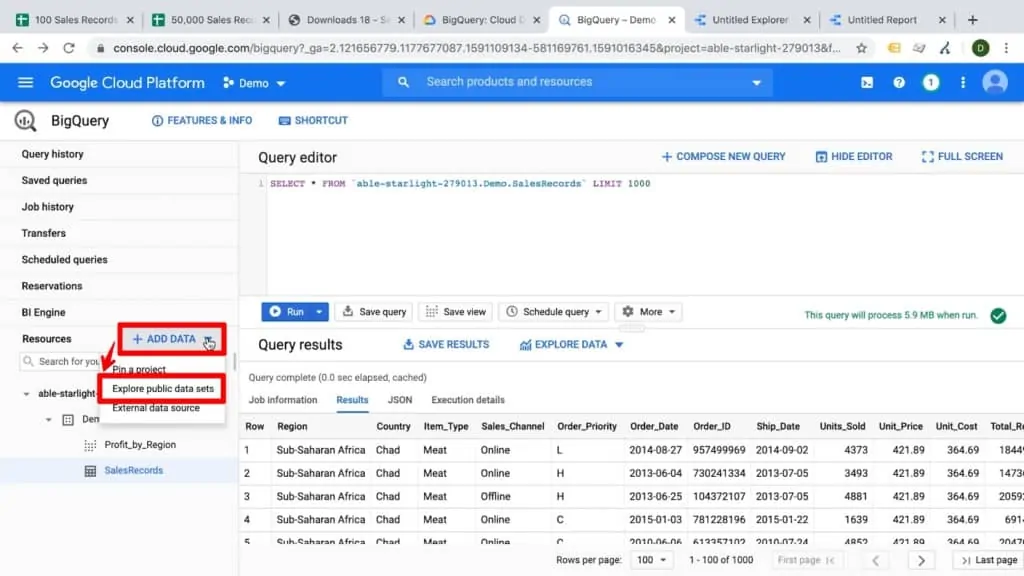
I encourage you to check these out just for fun. There are lots of cool and interesting public data sets that can show you all the capabilities of BigQuery. Happy analyzing!
FAQ
How do I query my dataset in BigQuery?
To query your dataset in BigQuery, you need to use SQL. You can enter your SQL query in the query field provided in the user interface. BigQuery allows you to perform various operations on your data, similar to analyzing data in a spreadsheet.
How can I visualize my BigQuery dataset in Google Data Studio?
To visualize your BigQuery dataset in Google Data Studio, you can use the “Explore with Data Studio” option in BigQuery. This will open Data Studio with your dataset, where you can create visualizations and build interactive dashboards to analyze and present your data.
Is there a cost associated with using BigQuery?
There may be costs associated with using BigQuery, depending on your usage and the amount of data processed. Google Cloud Platform offers pricing plans and options based on the volume of data processed and storage used. You can refer to the Google Cloud Platform pricing documentation for more details.
Summary
All right, so there you have it. This was a quick overview of Google BigQuery. I hope you now know what it is and how you can use it to improve your workflow. And if you have worked with BigQuery already, and I’d love to know from you in the comments what your specific uses and strategies are.
If you want to dive deeper into Google BigQuery, we just launched a new BigQuery course in our MeasureMasters platform.
Due to the recent increase in interest in ChatGPT, we’ve created a guide on how to use BigQuery with ChatGPT, be sure to check it out.
Got an idea for more tutorials or BigQuery content? Let us know in the comments!
Subscribe & Get our FREE Query GA4 data in BigQuery eBook


")
Thanks for the content. In GBQ, how do I select all columns that contain a specific term for a given column? for example: if column A has the term xxx, select everything.