
Last Modified on September 18, 2024
Not sure how to properly utilize the preview mode in Google Tag Manager?
In this guide, we’ll explain how to use the Google Tag Manager preview mode as well as share some useful tips and tricks.
We’ll cover:
- What is the GTM preview mode?
- What’s new in the updated version?
- How do I use the new GTM preview mode?
All of these have important implications, so we’ll be discussing what these mean for you as a trackers.
If you learn the new system well, it will serve you far better than the old preview mode.
💡 Top Tip: We recommend creating a demo website for practicing GTM instead of just trying out new methods on your website.
As always, we have a lot to cover. Let’s dive in!
Old vs. New: Google Tag Manager Preview and Debug Mode
If you’re new to Google Tag Manager, you might be wondering what this commotion is all about.
The preview and debug mode is an essential tool for all GTM users. It allows you to test and debug any tracking implementations before actually making them live on your website.
This gives you the power to make sure that every single update you make to your tracking system is perfect. No double-tracking, no lost conversions, and no confusing data.
Both the old and new preview modes were designed to help you accomplish this. In 2020, the new preview mode completely and automatically replaced the old one. Google Tag Manager users had little warning or time to adjust to the new interface.
While the primary functions in the new preview mode are still the same, there are some significant updates that make the GTM preview mode much more effective…while at the same time confusing some users.
The new preview and debug mode is pretty easy to learn. But it’s helpful to have a quick guide to point out the major changes and show you the updated system.
What’s New in GTM Preview Mode?
So what’s so special about the new GTM preview mode that we wrote a whole blog post about it?
Here are the most important new features of preview mode:
- The debugger lives in a separate tab
- Events stay recorded—even when you navigate to a new page
- Visibility of the API Call
- Debug multiple containers in one window
- Use the Tag Assistant to debug across multiple tabs
- No more third-party cookies, so you can use any browser
Preview Mode Gets Its Own Tab
If you open your Google Tag Manager account, you’ll find the GTM interface unchanged. Everything should look and feel the same until you click the Preview button in your topbar.

Instead of opening your website with a GTM console across the bottom, you’ll be directed to a new tab with Tag Assistant. Here, it will ask you to provide the URL for the site you want to debug.
With this update, the Google Tag Assistant has adopted a new role. Instead of a browser extension, the Tag Assistant is now a tool independent of cookies or extensions. It is now the central hub to debug all your different Tags.
Having a separate tab for the Tag Assistant is a huge perk for GTM users.
For example, you can pull these tabs into separate monitors. If you have multiple screens, this makes it much easier to see everything that is going on both on your site and in your debugger.
You can also just split the two windows on one screen, if your monitor is big enough. This is also especially handy for mobile debugging.
💡 Top Tip: Debug for Mobile Users Mobile developers, rejoice! Keeping the debugger in a separate tab is a huge improvement when debugging for mobile users. The mobile view of your site is so small that the old preview console would obscure most of the page. This made both navigating and debugging way harder. But now with our debugger tucked neatly away in a different tab, we can see all that information quite nicely now.

Debugger Records Events Across Different Pageviews
If you check out the Tag Assistant debugger, you’ll notice some changes in the events menu on the left. In the old preview mode, we had a simple list of events tracked on the current pageview.
Now, we see different pageviews in these dropdown menus. Under each dropdown is a list of all the events recorded for that pageview. (You can expand and condense these by clicking the arrow next to the pageview.)

What makes this change so special? This record of multiple pageviews helps us get around some major inconveniences that we had with the old GTM preview mode.
For example, say you have a Tag that is triggered when a user clicks on a button that navigates them to a new page. With the old preview mode, you wouldn’t be able to see the Tag fire in your preview console because the events would disappear when you were sent to the new page.
There were some workarounds, like opening the link in a new tab, but they were tedious and inelegant. With the new GTM preview mode, all of your events and Tags will be visible even if you navigate to a new page.
This is a huge improvement over the old GTM preview mode. Now, we can debug Tags across multiple pages. The Tag Assistant records all the pageviews (and their events) during your entire preview session, so you’ll always know what’s going on across your different pages.
💡 Top Tip: Copy Text from the Data Layer In the old GTM preview mode, you couldn’t copy text from your preview console. This made it harder to quickly and accurately build Tags and variables that relied on information from the Variables and Data Layer tabs. Now, you can copy out of the preview mode and paste all kinds of values that you formerly needed to type out manually. Neat!

New Event Field: API Call
You’ll notice that the events for each pageview are numbered. Otherwise, most of these events and their data fields will look very familiar—at first.
Just like in the old preview console, you can check out the variables, the Data Layer, and any errors that may have occurred. But you’ll also see something new. At the top, there’s a field named API Call.

Formerly, we’ve referred to the timeline of events in the waterfall menu as an “events menu” (at least in our videos and blog posts). When a page loads, it shows which items have loaded and in what order. These items are essentially our API Calls.
The API Call field describes the script that loads for each call. In many cases, these will be Data Layer pushes that include the event names in the script.
For many GTM users, this isn’t a huge change. It’s really just extra information on how your tracking code itself is functioning. That said, I imagine our future guides will refer to an event in GTM as an API Call. It’s certainly helpful to have a definitive term for each script event.
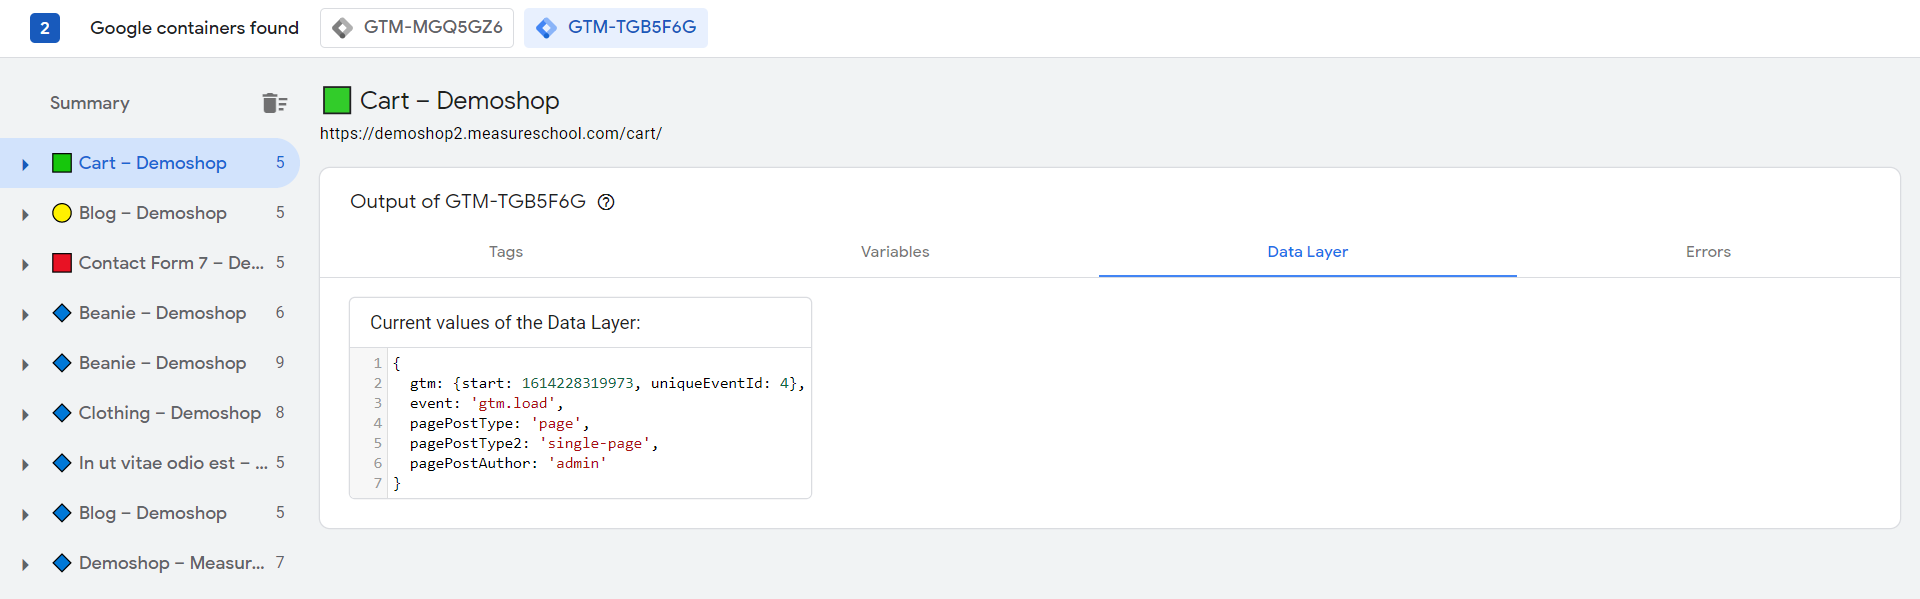
Debug Multiple Containers at Once
If you’ve been peeking at my events menu in my debugger, you may have noticed that I have two API Calls for loading a GTM container. This isn’t a bug.

On this demo site, I’ve installed Google Tag Manager multiple times using both the Google Tag Manager for WordPress plugin by Thomas Geiger and a manual installation in my theme header file. With these separate installations, I’ve installed a couple of different GTM containers, each with a completely different set of tags for different tracking (and demonstration) purposes.
If you have multiple GTM containers installed on your site, then debugging just got a lot simpler. At the top of your Tag Assistant window, you have a drop down menu where you can choose any of your GTM or Gtag implementations to debug.

With the new dropdown menu, you can switch effortlessly between any of your Google tracking implementations without leaving preview mode. Thanks to this feature, you can run through some potential user actions and check your tags in all of your containers at once.
💡 Top Tip: Debug Cross-Domain Tracking in One Window If you have Google Tag Manager installed on two linked domains, you can debug your cross-domain tracking all in one window. Initially, the domain will not be recognized and you won’t have a log of what’s happening on your second domain. But if you go to the Domains screen on your Tag Assistant, you can connect your two domains to start tracking them together. Then, you’d be able to go seamlessly from one domain to the next.
Debug in Multiple Tabs with the Tag Assistant Extension
Now that Google has released the new GTM preview mode under the name “Tag Assistant,” what does this mean for the Tag Assistant browser extension?
If you’ve been using Google Tag Manager or Google’s Global Site Tag for any length of time, you should already know about the Tag Assistant browser extension. This extension was always super helpful for debugging any Google tags.
Since GTM’s new preview mode is also called the Tag Assistant, you might be fearing that our beloved little extension has been made obsolete. On the contrary—it has now become part of a complex but awesome debugging ecosystem.
If you ever tried debugging on multiple tabs at once on the old system (maybe when tracking button clicks, for example?), you know that you had a separate preview console at the bottom of each tab. This meant flipping between tabs to check each tab’s individual Tags.
With your Tag Assistant extension enabled, go ahead and try opening up multiple tabs in preview mode. Everything shows up in your single Tag Assistant window! But how do you tell each tab’s events apart?
Check out this colorful set of icons—a blue diamond, a tiger emoji, and a yellow square. Each of these signals that the event is from a specific tab. You can now distinguish events from separate tabs all inside one Tag debugger system.
To know which tab each icon belongs to, just open one of the tabs and check out the Debugger connected popup in the bottom right corner. The icon for that tab will display on the left side of the popup’s text. Nifty.
The icon shapes and colors are totally randomized and don’t mean anything except for which tab it identifies. So if one of your tabs has a green circle and another has a red square, don’t worry—it doesn’t mean that your system is broken or faulty.
And while the Tag Assistant extension certainly makes the debugging process easier, you’re certainly not required to install it in order to debug your Tag system. This means that you don’t have to worry about being locked into the Chrome ecosystem if you use a different browser. And speaking of browsers…
🚨 Note: Find and fix any issue in your container with the new feature Google Tag Manager container diagnostics.
No More Cookies! Use Any Browser You Want
If you’re a Safari user, this may be your favorite update. GTM’s new preview mode has completely done away with cookies.
Why is this important? The old GTM preview mode relied on third-party cookies in order to track down your events. (This is what also limited your Summary to include only events from a single pageview.)
Now, lots of browsers block all third-party cookies by default, such as Safari and Firefox. You can also adjust the setting of most other browsers, including Chrome and Edge, to block third-party cookies.
This was a huge pain for GTM users on browsers that block third-party cookies. There were some workarounds, but it was a big inconvenience. In the new GTM preview mode, this hurdle has been resolved. The preview mode is also just more stable without the reliance on cookies.
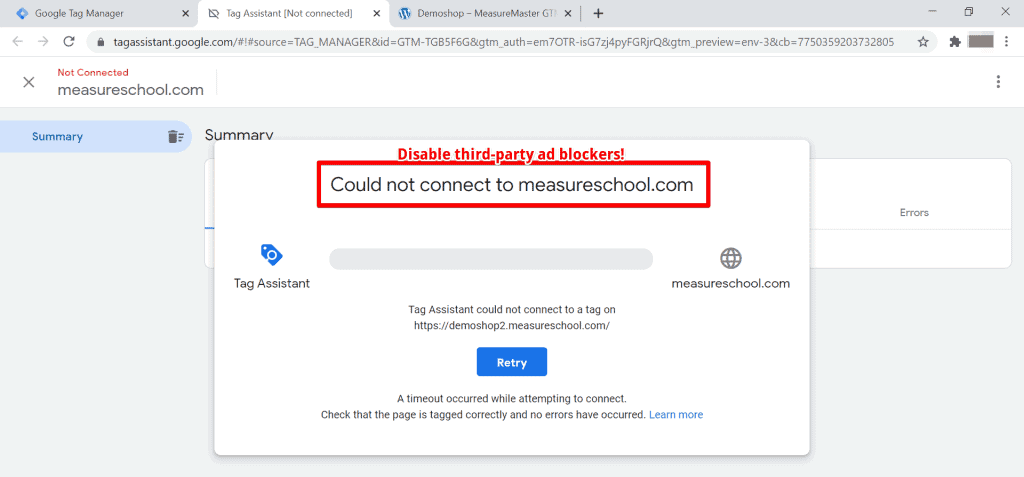
🚨 Note: For now, you may still need to disable any third-party ad blockers or popup blockers to use the new GTM preview mode. Otherwise, your debugger may not connect correctly to your website.
How to Use the New Preview Mode
To use the new preview mode, you’ll click the same Preview button on your workspace as before.
When you do, the Tag Assistant tool will launch on a new tab. Here, you’ll need to enter your website’s URL in order to connect it to the Tag Assistant.

Once you click Start, GTM will launch your website in a separate tab. This is where you’ll be doing all of your testing and debugging.
How to Navigate the GTM Preview Mode
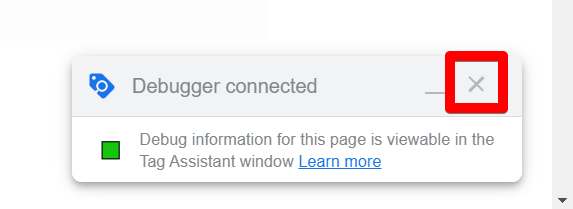
You’ll know that you successfully connected your website and container to the Tag Assistant if you see this box in the lower-right corner of your window.

The little icon on the left may be different—that’s ok! The icon is only for identification purposes if you’re debugging multiple tabs at once.
In the Tag Assistant tab, you’ll find that the interface looks a lot like the tiny console that used to appear on the bottom of your window in the old preview mode. You’ll navigate it really similarly, too. It’s just a lot bigger and easier to find things now!
On the left, you’ll get a list of every pageview recorded in preview mode, including all of their associated API calls . At the top of that list, the Summary gives you overall session information, including any Tags that fired and the most current Data Layer values.

Each pageview’s contents can be minimized, and API calls display their variables in a much more legible table. You can even copy text from your Variables table and Data Layer field, which wasn’t available in the old preview mode!

If you want to debug across multiple tabs, then different tabs (and user flows) will be labeled with a unique icon next to the pageview listing. You can also debug the same pageviews and API calls across multiple GTM Containers by clicking on the Container ID at the top of the Tag Assistant.
How to Close Preview Mode
There are two ways to exit the GTM preview and debug mode.
First, you can go to any tab with your website. On the Debugger connected window, click on the X to stop debugging. This will disconnect the Tag Assistant from all tabs that are currently in preview mode.
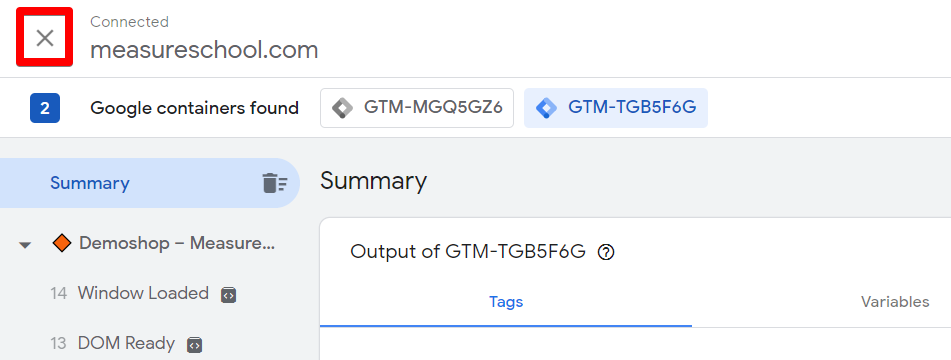
The other way to close preview mode is to go to the Tag Assistant tab and click the X next to your domain name.
None of your tabs will be closed automatically, so you can either reconnect the debugger or continue to work on other things outside of preview mode at your convenience.
Tips for using the GTM Preview mode
- Always ensure that your browser’s ad blockers or extensions aren’t interfering with the GTM Preview mode.
- If you’re working on a site with Content Security Policy (CSP), ensure that GTM is whitelisted.
- Remember to refresh the Preview mode if you make changes in your GTM container.
FAQ
Can I debug across multiple tabs in the new GTM preview mode?
Yes, you can debug across multiple tabs. Different tabs and user flows are labeled with unique icons next to the pageview listings, making it easier to distinguish them. You can also debug the same pageviews and API calls across multiple GTM Containers by clicking on the Container ID at the top of the Tag Assistant.
How can I exit the GTM preview and debug mode?
There are two ways to exit the GTM preview and debug mode. First, you can go to any tab with your website and click on the X button in the “Debugger connected” window. This will disconnect the Tag Assistant from all tabs in preview mode. Alternatively, you can go to the Tag Assistant tab and click the X button next to your domain name. None of your tabs will be closed automatically, allowing you to reconnect the debugger or continue working outside of preview mode.
Are there any changes to the functionality of GTM preview mode?
While there are visual changes in the new preview mode, most of the functionality remains preserved. In fact, some functions are even improved, such as events being preserved across pageviews, the ability to debug multiple containers, and the elimination of third-party cookies.
Why are there always three events on every page?
In Google Tag Manager, every time you load a page with the Preview mode enabled, you’ll notice three events: Page View, DOM Ready, and Window Loaded. These events represent different stages of the page loading process and can be crucial for triggering tags at the right moment.
Summary
Overall, there are plenty of new things to get used to. You may love some of the changes and hate others. There will probably be some adjustments and debugging from Google over the next couple of weeks, but this is essentially the new GTM preview mode.
If you can get through some of the visual changes, you’ll find that most of the functionality is preserved.
And thanks to events preserved across pageviews, the ability to debug multiple containers, and the elimination of third-party cookies, some functions are better than ever.
I wish you well in your new relationship with GTM preview mode, and I’d love to hear about your experience with it!
If you want to make sure that you know all the “essentials” of GTM, check out our in-depth Google Tag Manager tutorial.
What are your favorite new features? What do you miss about the old preview mode? Have you discovered any other changes that I missed here? Leave a comment below!


")
Hi, I’m getting two “Container Loaded” API calls like you did, but I don’t necessarily want an extra one. I also only have one GTM implementation. Any idea how to fix this so I only have one? Thanks!