
Last Modified on January 7, 2025
Did you know that you can finally see the conversion rate in Google Analytics 4?
When GA4 was released, users were puzzled upon seeing that the conversion rate was missing from the list of available metrics. Thankfully, the conversion rate in GA4 can now be viewed in both standard and exploration reports.

Master the basics with our FREE GA4 Course for Beginners
Google not only brought back the conversion rate which determines the percentage of converted sessions against the total, but they also introduced a new type that calculates the percentage of converted users over the total number of website visitors.
The basic idea is to get the percentage of conversions over the total. What is a conversion in GA4? Any valuable action can be considered one. Conversions can be tracked when someone submits a form, signs up for your newsletter, or makes a purchase.
If you are an experienced Universal Analytics user upgrading to GA4, we hope this guide be useful since the conversion rate is not shown in the GA4 interface like it used to be for UA goals. We’ll also explain the difference between the types of conversion rates in GA4.
Here is an overview of what we’ll cover:
- Adding Conversion Rate to Standard Reports
- User Conversion Rate vs Session Conversion Rate
- Analyzing the Conversion Rate of Specific Events
- Conversion Rate in Google Analytics 4 Explorations
Adding Conversion Rate to Standard Reports
Let’s start with viewing the conversion rate in standard reports.
In your Google Analytics account, go to Reports → Acquisition → Traffic acquisition.

Next, we’ll click on the < arrow symbol near the bottom-left corner to minimize our reports navigation pane. This should allow us to see more information in the traffic acquisition report more easily.
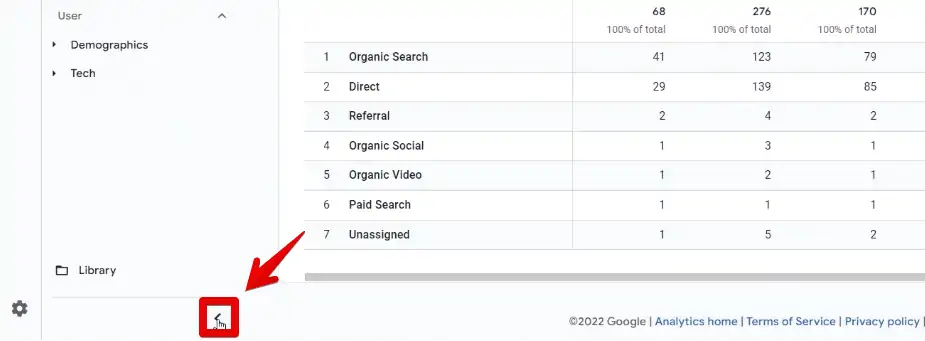
You may ask why can’t you see the conversion at this point.

Even if you scroll to the end of the table, you won’t be able to see it anywhere. Why not? You just have to add the conversion rate in Google Analytics 4 manually.
To customize standard reports, simply click on the pencil icon at the top-right corner.
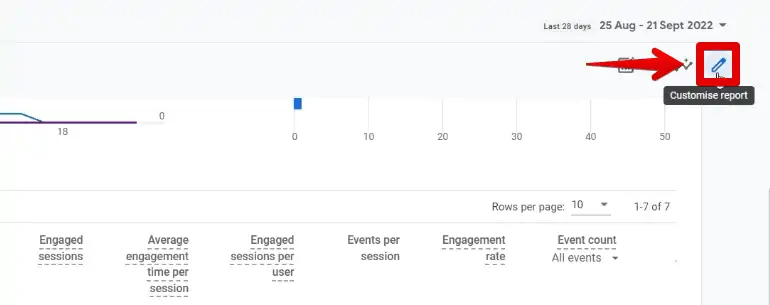
Since the conversion rate is a quantitative measurement – meaning it’s always a number rather than a text – GA4 considers this as a metric as opposed to a dimension.
So, click on Metrics.

The list of all metrics shown in the report will be shown. Here, you can remove or add new metrics to the report. Just note that you can only show up to 12 metrics at once.
Click on Add metric.

If you browse through the list that came up, you will notice that there are two conversion rates available. We’ll discuss the difference between the two later.
For now, select both the Session conversion rate and the User conversion rate.

Next, bring these two metrics near the top of the list so that we can easily see them later, then click Apply.

Great! We should now see the conversion rate in our traffic acquisition report.
🚨 Note: If you want to see the conversion rates in other reports, you have to repeat this process and customize each report individually.
Looking at the report, you will notice that there are different values for the session and user conversion rate.

Let’s discuss how GA4 gets these values to explain this difference.
User Conversion Rate vs Session Conversion Rate
First, let’s define what these conversion rates are. The user conversion rate is the percentage of users converted. Whereas the session conversion rate shows the percentage of sessions in which any conversion event took place.
Let’s look at an example to better illustrate the difference between the two.
We have two users who initiated three sessions each. The first user converted in the last two sessions while the second user did not convert in any of the three sessions.

Session Conversion Rate
First, let’s see the formula for calculating the session conversion rate.

To calculate the session conversion rate, we need to divide the number of sessions of any conversion event by the total number of sessions.
If you’re a previous Universal Analytics user, the session conversion rate in Google Analytics 4 is identical to how the conversion rate was previously calculated.
🚨 Note: Since Universal Analytics will be sunsetted on July 2023, we recommend starting the GA4 migration process.
Looking at our example, we have a total of 6 sessions with 2 converted sessions. Therefore, the session conversion rate for our example is 33.34%.

User Conversion Rate
Next, let’s compare this to the formula for calculating the user conversion rate.

To calculate the user conversion rate, we need to divide the number of users who triggered any conversion event by the total number of users.
In our example, we have two users and only one of them triggered any conversions. Therefore, the user converted rate for our example is 50%.

It doesn’t matter that the first user converted twice, as they will only be considered as one converted user. Even if another user has around 50 sessions and only converted once, they will still be considered a converted user.
Analyzing the Conversion Rate of Specific Events
Great. You can now view the conversion rate in Google Analytics 4 and understand the difference between its two types.
Since any valuable event can be considered a conversion in GA4, you may wonder if we can analyze the conversion rate for specific events. Luckily, we can easily do that in standard reports.
Simply click on the dropdown menu below any of the conversion rate headers.

By default, the conversion rates displayed will be calculated for all conversion events. Selecting any event from this list lets you analyze the conversion rate for that specific event.
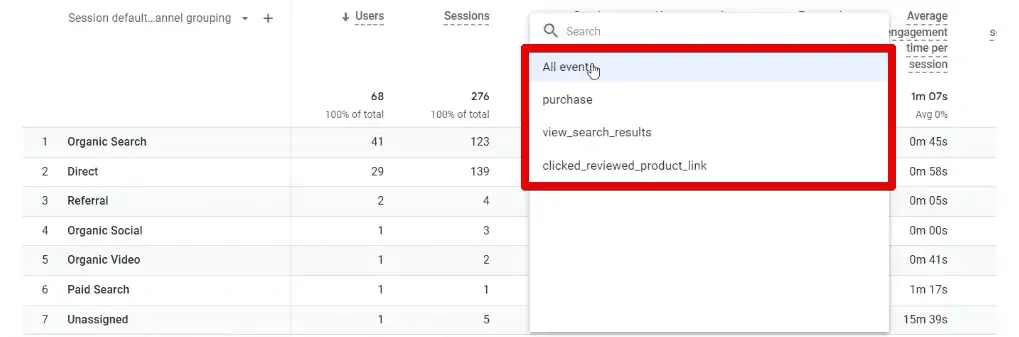
This is great because you can analyze the conversion rate for multiple conversion events that are valuable to you in your standard reports.
Before proceeding, click Save in the upper-right corner to ensure that the conversion rates can be viewed in your standard reports.

We can also dive deeper into our data, and work with this metric in the explorations report.
Conversion Rate in Google Analytics 4 Explorations
Let’s switch to Google’s demo account since they will have some data flowing to their property.
Go to the Explore tab → Blank to create a new exploration.

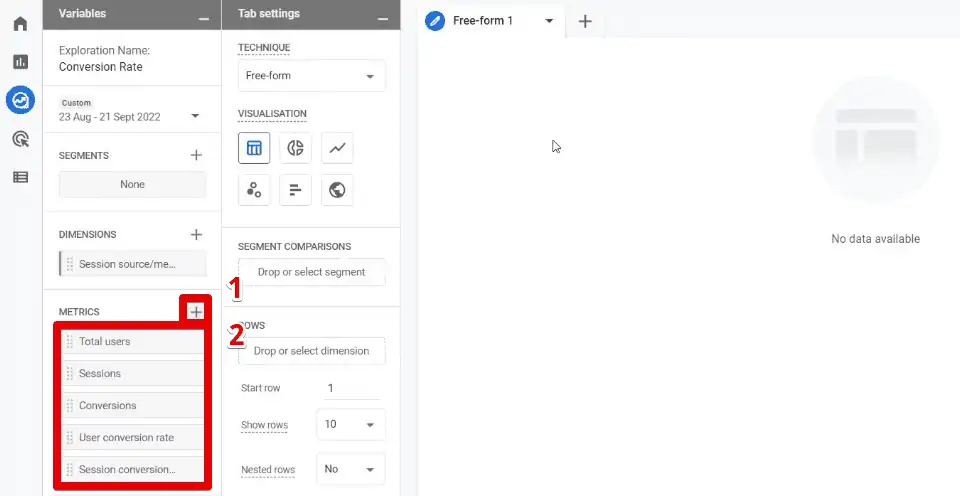
Provide a name for the exploration. Next, we’ll add a dimension to this exploration report by clicking on the + button beside the dimensions section.

For this report, we’ll add the session source/medium. Type this in the search bar above, then select it under the traffic source category. Finally, click Import.

Next, similarly, we’ll add Metrics to the exploration. This time, add Total users, Sessions, Conversions, User conversion rate, and Session conversion rate.
Now, let’s build our report.
There are two ways of adding dimensions/metrics to our visualization. One way is to drag them to the breakdown/values section and the other is simply by double-clicking.
Add our session source/medium dimension in the Rows section, and all the metrics in the Values section.

Here we go. We have our report and you can see both the user conversion rate and the session conversion rate.

You’ll notice that the user conversion rate is always higher than the session conversion rate.
This is because even if a user had multiple sessions and only converted in one session, this user will be counted as a converted user and the unconverted sessions will not impact the user conversion rate.
Another observation you may note is that if you divide the number of conversions by the number of sessions, it will not match the session conversion rate.
You may think that this doesn’t make sense and wonder if the formula we discussed or if GA4 calculates it wrong. No, these are correct and no mistakes are made.
The number of conversions in this column accounts for all conversions, while the one used in the conversion rate formula is the number of sessions with conversions. What’s the difference?
Let’s say there is a user that triggered three conversion events in one session. This will be counted as three conversions, but will only be a single converted session.
Great! That’s how you add the conversion rate in Google Analytics 4 explorations.
FAQ
What is the difference between the User conversion rate and Session conversion rate in GA4?
The User conversion rate represents the percentage of users who triggered any conversion event, while the Session conversion rate represents the percentage of sessions in which any conversion event took place. The User conversion rate considers the total number of users, while the Session conversion rate considers the total number of sessions.
Can I analyze the conversion rate for specific events in GA4?
Yes, you can analyze the conversion rate for specific events in GA4. In the standard reports, you can filter the events considered for the conversion rate by selecting the event from the dropdown menu below the conversion rate headers.
What is a conversion in GA4?
In GA4, a conversion refers to any valuable action that you consider as a conversion. This can include form submissions, newsletter sign-ups, or purchases.
How can I view the conversion rate in standard reports in GA4?
To view the conversion rate in standard reports, go to your Google Analytics account, navigate to Reports → Acquisition → Traffic acquisition. Click on the pencil icon at the top-right corner to customize the report, add the Session conversion rate and User conversion rate metrics, and apply the changes. You can customize other reports individually to see the conversion rates in them as well.
How can I view the conversion rate in GA4 explorations?
In GA4 explorations, you can create a new exploration report and add dimensions and metrics to it. Add the Session source/medium dimension and the Total users, Sessions, Conversions, User conversion rate, and Session conversion rate metrics. You can then build your report and visualize the user conversion rate and session conversion rate.
How are the conversion rates calculated in GA4?
The Session conversion rate is calculated by dividing the number of sessions with any conversion event by the total number of sessions. The User conversion rate is calculated by dividing the number of users who triggered any conversion event by the total number of users.
Do I need to set up conversion tracking in GA4 to see the conversion rate?
Yes, in order to see the conversion rate in GA4, you need to mark events as conversions or set up conversion tracking in your GA4 property. Once you have done that, the conversion rates will be automatically populated and can be added to your reports.
Summary
If you’re starting your measurement journey, knowing your conversion rate is a must. It will help you understand if your business is generating enough conversions and how your advertising strategy could be optimized.
The conversion rate in Google Analytics 4 will be populated automatically once you have marked events as conversions or have set up conversion tracking in your GA4 property. Next, you simply have to add them to your reports to gain valuable insights.
Will you add the conversion rate to your reports? Do you think the user conversion rate is a welcome addition? Let us know in the comments below!
Master the basics with our FREE GA4 Course for Beginners


")
Is there any way to show only the e-commerce conversion rate in the Exploration report? Thank you very much!
Yes there is. You should select the session conversion rate metrics and then apply a filter over the event name dimension. The filter should include a regex match that match session_start|purchase.
I hope it helps