
Last Modified on February 17, 2025
UTM parameters are essential for tracking website traffic sources in Google Analytics 4.
You’ve now successfully created UTM parameters for your incoming links, but don’t know how to see them in your GA4 account.
There are numerous tutorials on creating UTM parameters, but only a few show how to find UTM codes in GA4.
To understand the best way to analyze your UTMs in GA4, you must know how to look at data inside your GA4 account.
🚨 Note: We’ve created a tool that can help you track lead sources inside of your CRM.
We’ll show you these two ways of viewing data, their use cases, and our process when working with UTM parameters in Google Analytics 4.
Here’s what we’ll cover in this guide:
- What are UTM Parameters
- Why are They Useful
- Where Can They Be Used
- Common Use Case Scenarios
- Best Practices for UTM Parameters
- UTM Parameters in Google Analytics 4 Overview
- How to View UTM Parameters in GA4
- Analyzing UTM Parameters in Exploration Reports
- Comparing Different Versions of UTM Content Through Segments
- Advanced Strategies
- Troubleshooting Tips for Misattributed Traffic
Let’s dive in!
What are UTM Parameters
You’ve probably already seen some strange series of texts as part of a link, like this:

These are UTM parameters.
UTM parameters are small codes you add to URLs. They are very helpful in marketing and web analytics because they allow you to precisely understand where your traffic comes from and what led users to your online pages.
While UTM parameters are not recommended for internal linking, they help track links that direct users to your website pages or posts. Adding UTM parameters helps you clearly understand the “who,” “how,” and “what” behind your traffic sources.
Why are They Useful
UTM parameters are helpful for understanding where your traffic is coming from and uncovering the true story behind your analytics numbers.
For example, let’s say you are running a marketing campaign across Facebook, LinkedIn, and Google Ads to promote a product on page A of your website. If 1,000 users visit and purchase your product without UTMs, that’s all you would know.
With UTM codes, however, you can determine that, for example:
- 200 users came from Facebook,
- 400 from LinkedIn,
- and 400 from Google Ads.
This level of detail allows you to analyze your campaign’s performance more effectively.
Where Can They be Used
UTM parameters can be used across various platforms and tools, including:
- Analytics platforms
- Advertising campaigns
- CRM tools
- Social media posts
- Emails
- PDFs
- Messaging apps like WhatsApp
- Other websites or blogs
Essentially, they can be applied to any place where you share a link directing users to your website.
Common Use Case Scenarios
UTM parameters are commonly used in the following scenarios:
- Measuring the performance of social media campaigns
- Tracking email marketing effectiveness
- Monitoring paid advertising ROI
- Analyzing referral traffic from partner websites
- Identifying sources of conversions in CRM tools
Best Practices for UTM Parameters
- Use a Centralized UTM Tool
Start with tools like the Campaign URL Builder or a free tool like MeasureSchool’s UTM Tracking Tool to create UTM codes and establish consistent naming conventions. - Maintain Consistent Naming Conventions
- Keep all values lowercase, as GA4 is case-sensitive.
- Avoid spaces. Instead, use hyphens to separate words (e.g., “utm_campaign=summer-sale”).
- Add UTMs Habitually
Make it a standard practice to add UTM parameters whenever sharing links, whether on social media, in emails, or elsewhere. - Avoid Fragmentation
Consistent naming prevents fragmented data and reduces time reconciling traffic in tools like GA4 or Looker Studio.
UTM Parameters in Google Analytics 4 Overview
To start, a Google Merchandise Store will be the case that we’ll work on in this tutorial.
We can buy all kinds of Google products in this store, and there is also a newsletter you can sign up for. Accordingly, all links inside the newsletter have UTM parameters.
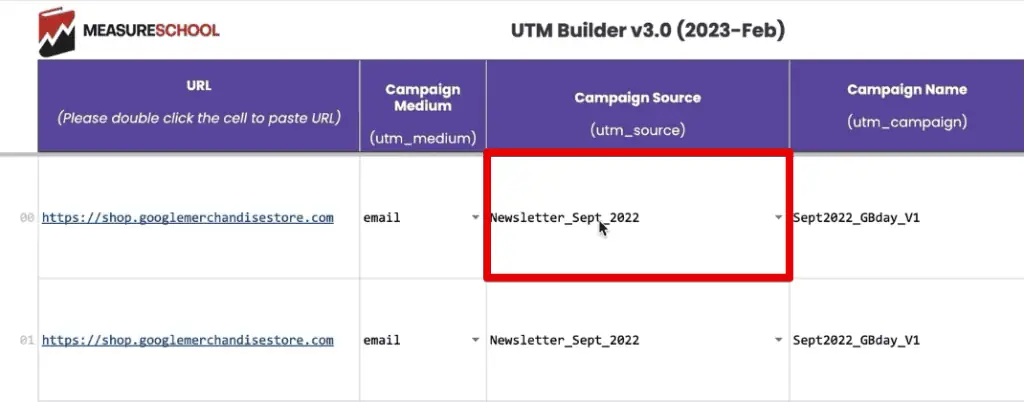
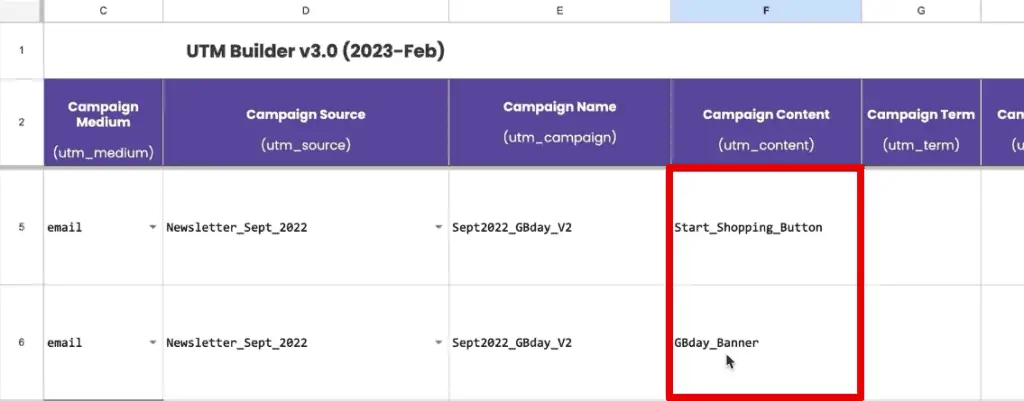
Many available resources help to attach UTM codes to your URLs, like the Campaign URL Builder. Here at MeasureSchool, we have this UTM Builder Sheet.
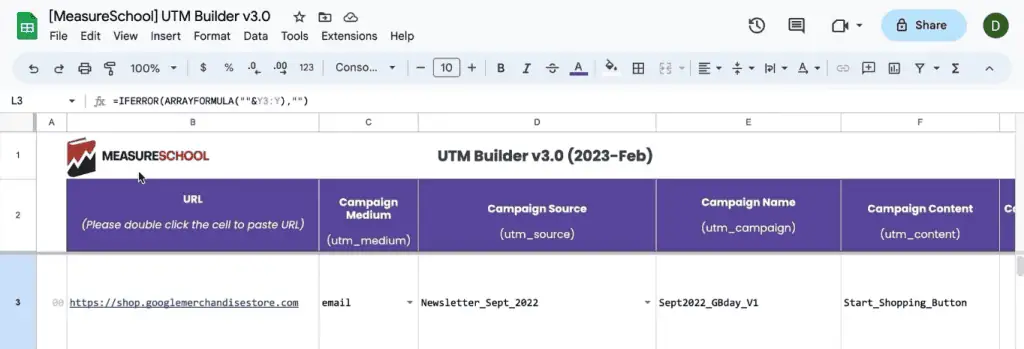
This tool is a free resource that helps create your landing page URL. You only need to populate the corresponding fields to each parameter, and the URL gets generated automatically.
When you add parameters to a URL, you should always use the utm_source, utm_medium, and utm_campaign fields.
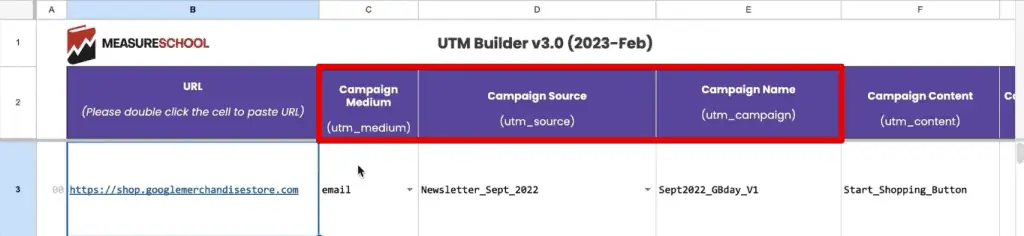
The next set of parameters is optional. These include utm_content, utm_term, utm_id, and utm_source_platform. The last two, utm_creative_format and utm_marketing_tactic, are currently not reported in GA4 properties.
🚨 Note: For complete details on the GA4 UTM parameters, check out Google’s documentation on GA4 URL builders.
The generated UTM appended URL is at the end.

These links can then be used inside your newsletter, for example. Once a user clicks on this link in the newsletter, they will be redirected to your website.
Let’s simulate this quickly. Notice the UTM key-value pairs at the end of the URL after the question mark (?) and separated by the ampersand (&) symbol.
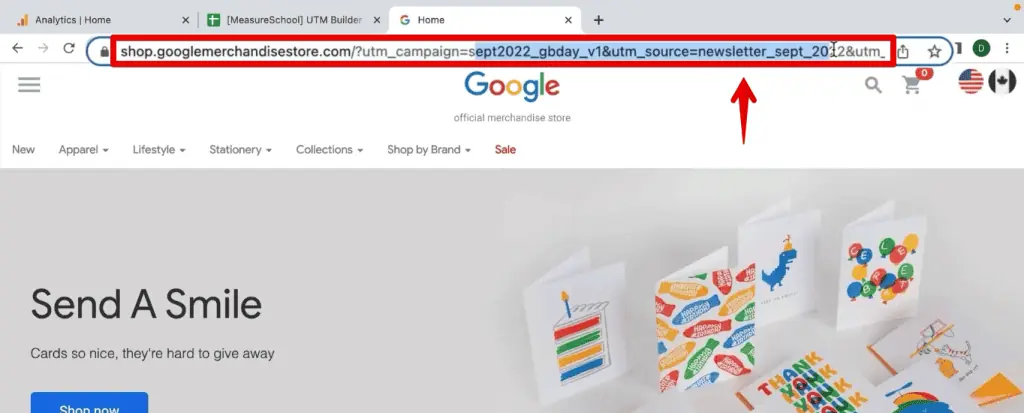
The UTMs will then get read and stored by GA4. They’ll help you know where the user came from.
How to View UTM Parameters in GA4
Once inside your account, how can you view these UTM parameters in Google Analytics 4 and read them correctly?
The first destination that you should know is under the standard reports.
Go to Reports → Acquisition → Traffic Acquisition.
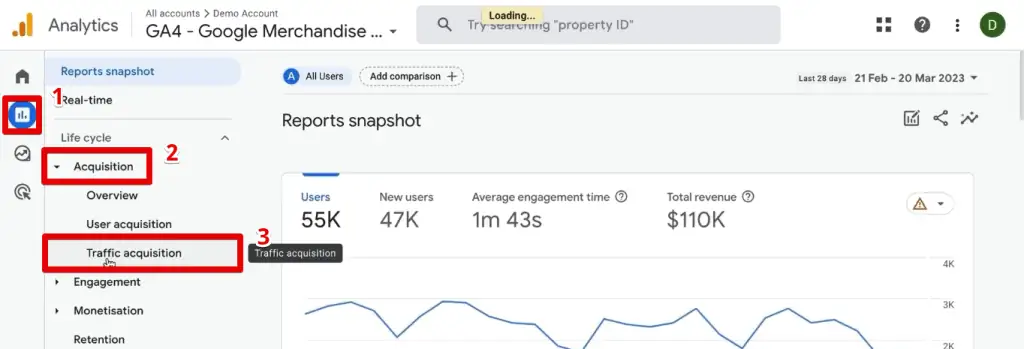
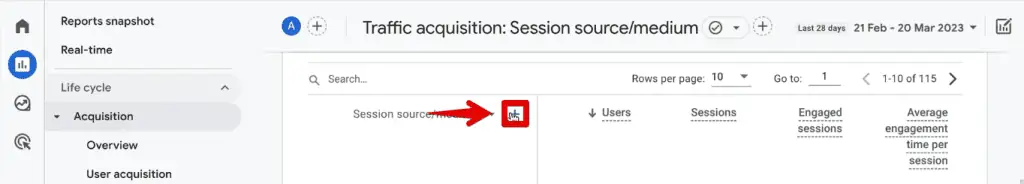
Here, you can view your UTMs already in the table below. Initially, the primary dimension of the table is the default channel grouping.
To change this, click on the Session default channel group.
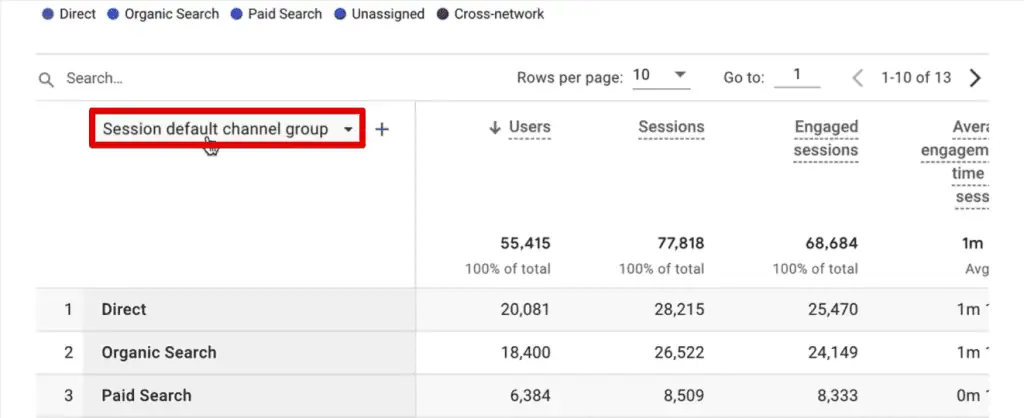
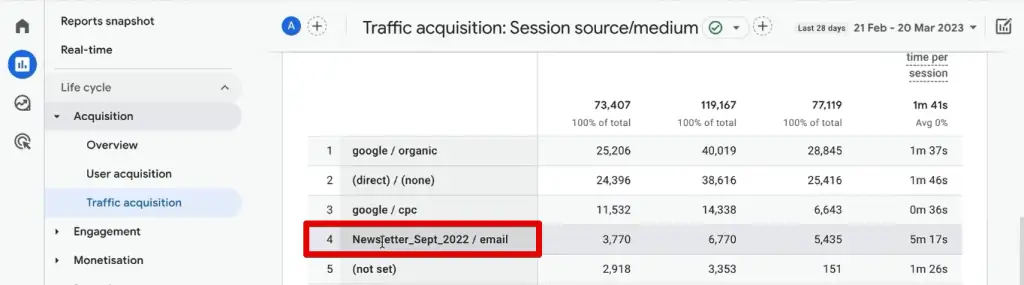
Select Session source/medium. This dimension combines the source and medium used to navigate the website.

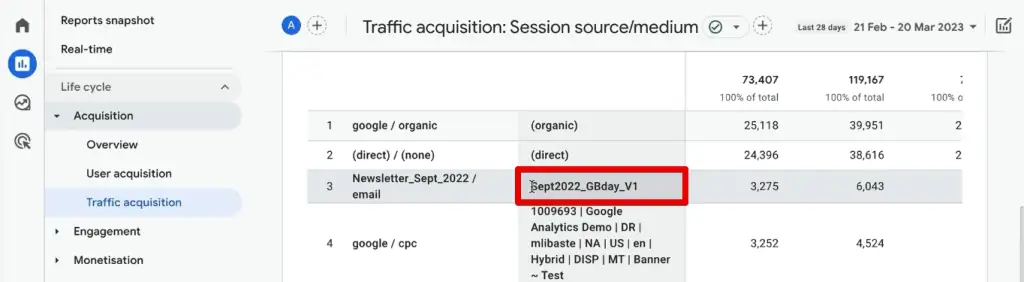
We want to find the source for our newsletter in September 2022. Referencing our list, this is the Newsletter_Sept_2022 source.
To see this in our report, we’ll change the date range. Click the date range at the top-right corner.
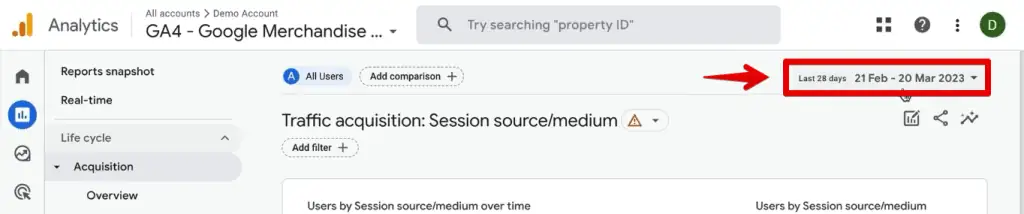
Here, set the date range for the start and end of September 2022.
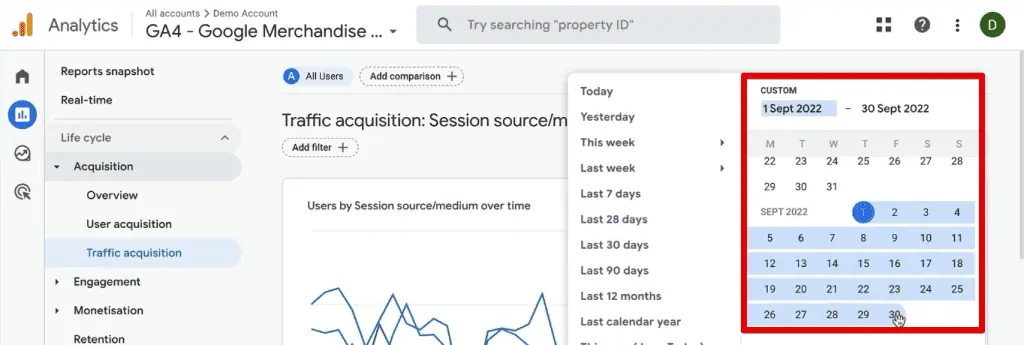
Great! We can now see our newsletter source with the email medium.
How about the other UTM parameters in Google Analytics 4? You can add a secondary dimension to the table by clicking on +.
For this demonstration, add the campaign name. Search campaign, then select Session campaign.
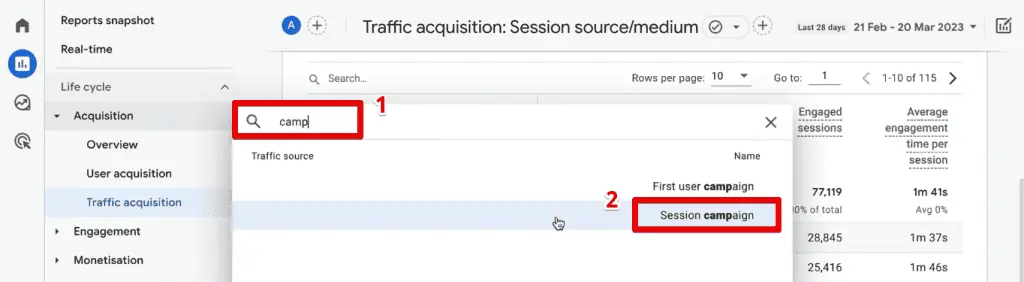
After a few seconds, the table will update and show the campaign name we entered in our sheet when we built the URLs.
Note that this table in the traffic acquisition report can only display up to two dimensions. If you want to dig deeper, it gets complicated in this report. We add some filters to make this work and find the correct number.
How to Track UTM Parameters
Tracking UTM parameters is straightforward using web analytics tools. In Google Analytics 4 (GA4), you can find them in your session source/medium reports.
For more detailed guidance, refer to our guide on How to Track UTM Codes in Google Analytics 4.
Analyzing UTM Parameters in Exploration Reports
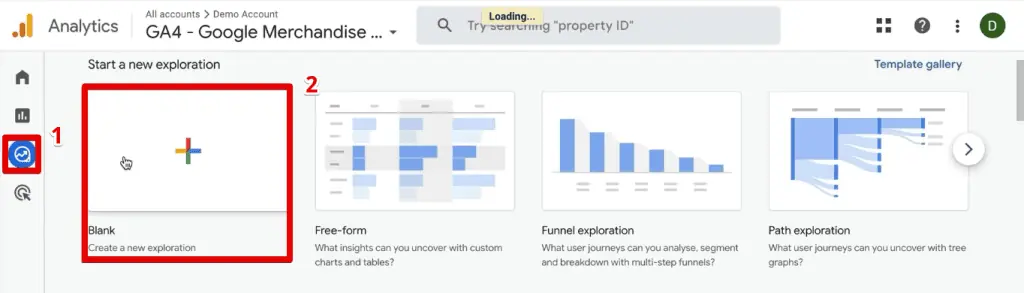
We always recommend going straight to exploration reports.
There are multiple templates that we can choose from. We want something fully custom to our needs, so let’s start with a blank report.
Go to Explore → Blank.
First, let’s provide a name for our exploration report. Next, we need to specify the data we want to put together. We’ll add them by going to the Dimensions and Metrics section.
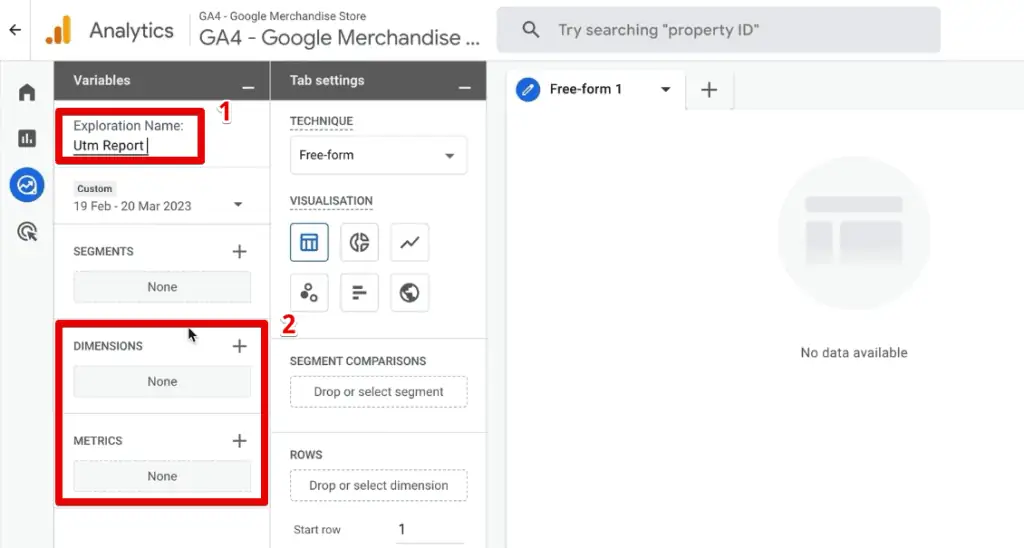
Starting with the metrics, we’re interested in seeing how many sessions our UTM parameters in Google Analytics 4 generate.
Type sessions in the search bar, then select Sessions. Finally, click Import.

For the dimensions, we will add all our UTM parameters. Naming is not simple inside GA4, so we must know the corresponding values.
Some matching dimensions are straightforward – remove the utm and add a session before the parameter name. However, some are not so direct.
Here is a table matching the UTM parameter to the correct dimension.
| UTM Parameter | GA4 Dimension |
| utm_id | Session campaign ID |
| utm_source | Session source |
| utm_medium | Session medium |
| utm_campaign | Session campaign |
| utm_source_platform | Session source platform |
| utm_term | Session manual term |
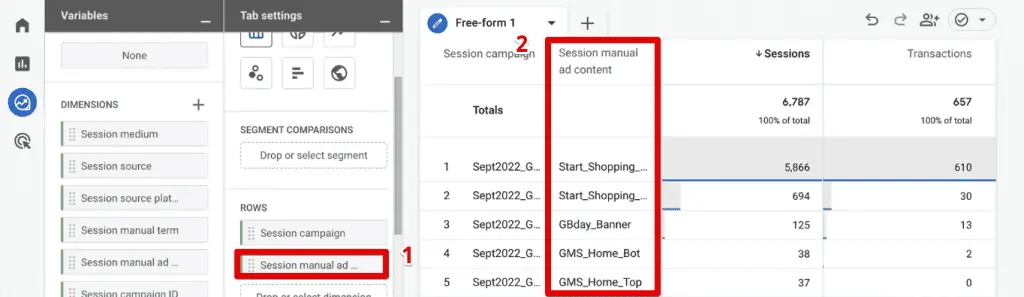
| utm_content | Session manual ad content |
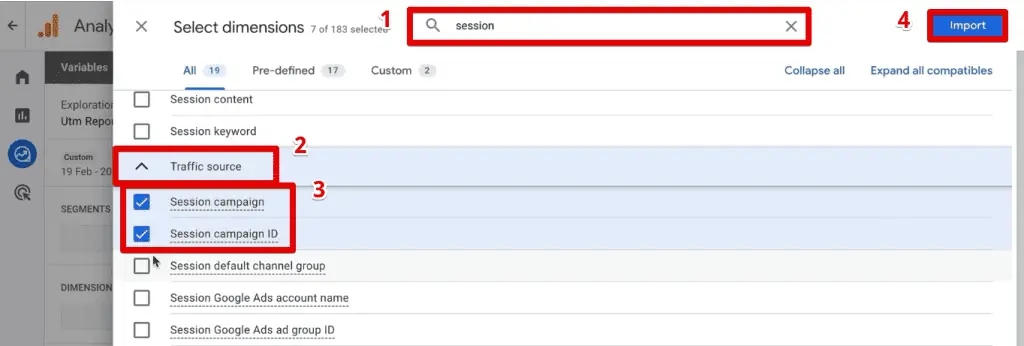
If you don’t want to memorize this list, you are always safe to put the session first. Next, all UTM parameters in Google Analytics 4 are under the Traffic Source section. Select the matching dimensions, then click Import.
We can now start building our report.
First, let’s add the sessions metric to the report so that we can see data coming in. Click and drag Sessions to the Values section.
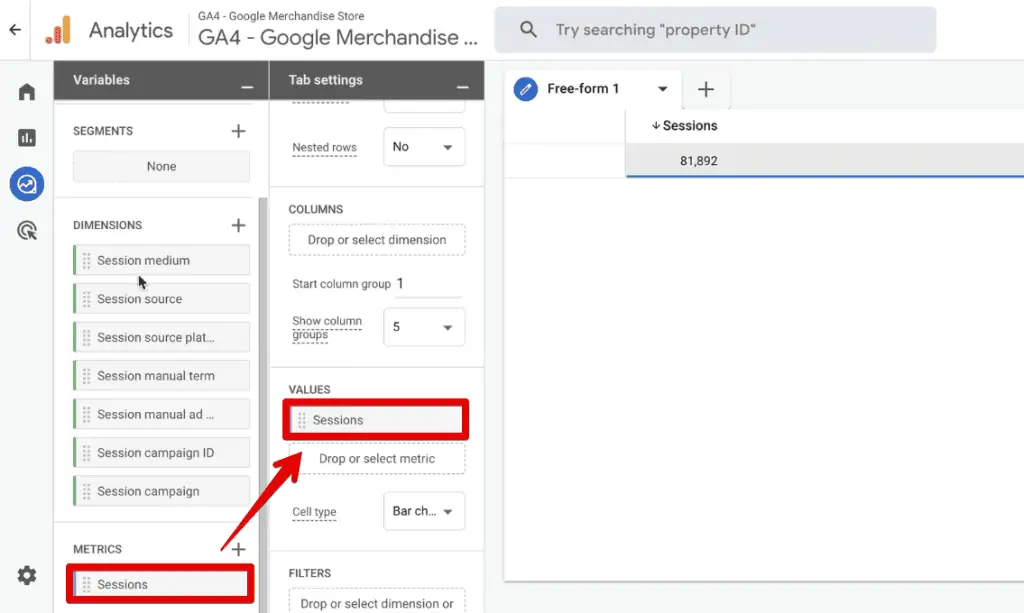
Next, we’ll add the largest bucket of our UTM parameters, the session medium.
Add the Session medium dimension to the Rows section. We’ll get the data for our used mediums in a table to the right.
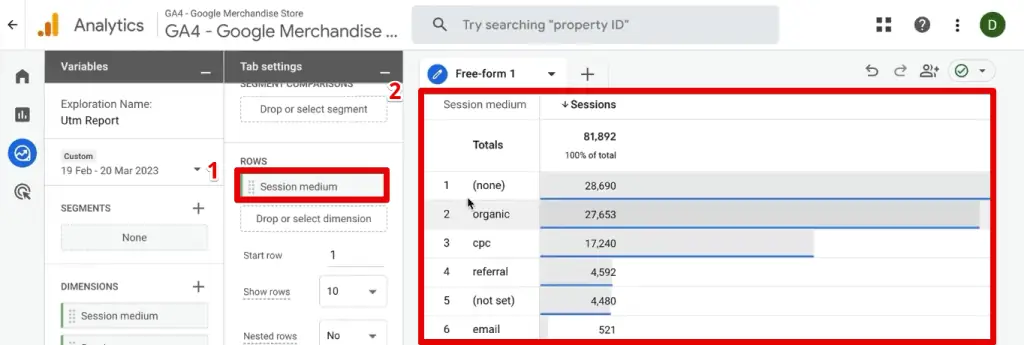
Next, let’s change the reporting time frame for the whole month of September 2022. Notice the changes to our data in the table.
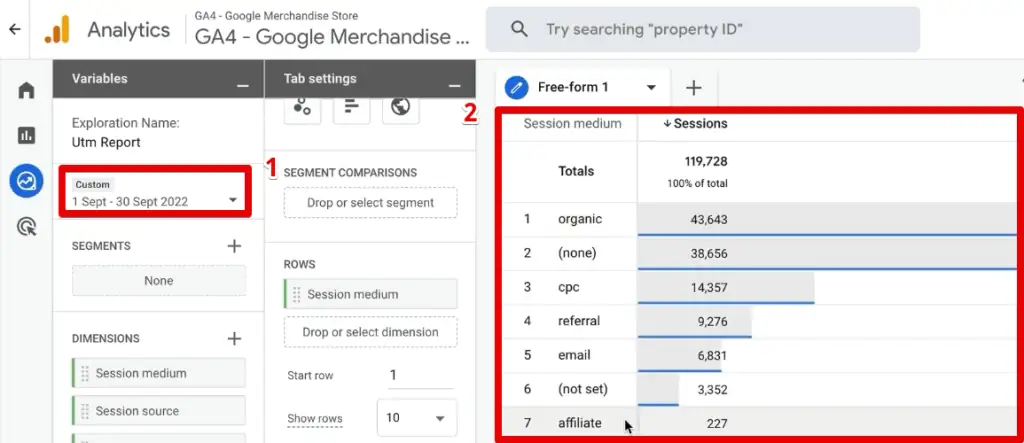
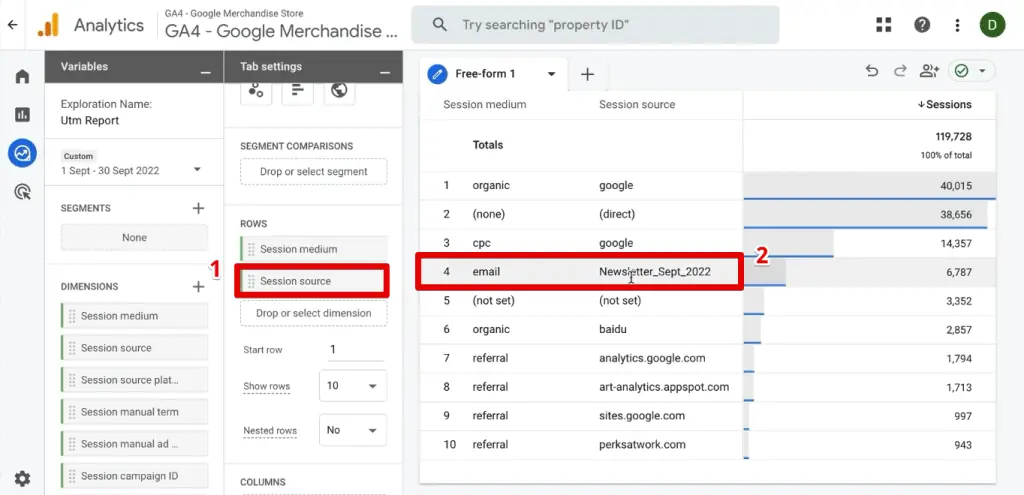
Next, let’s add the session source, as well. Now, we can see our Newsletter_Sept_2022 source.
For this analysis, we only want to focus on data for our newsletter. We can continue adding the other parameters to our report and locate our newsletter source. However, this will generate numerous rows of data, making our analysis harder.
The best way forward is to add a filter to our report. There is a Filters section that you could use to configure your filters below.
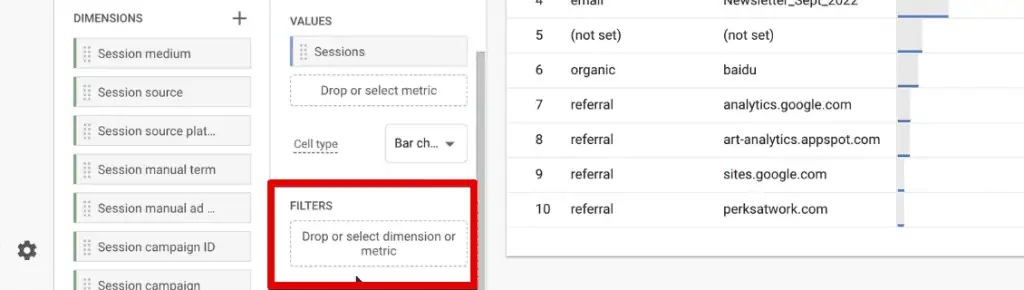
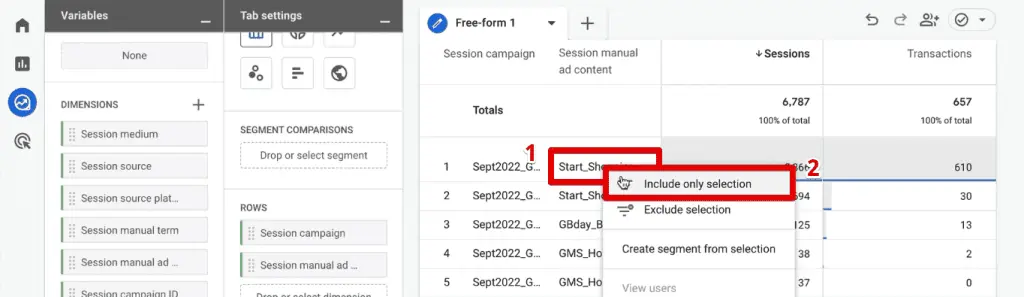
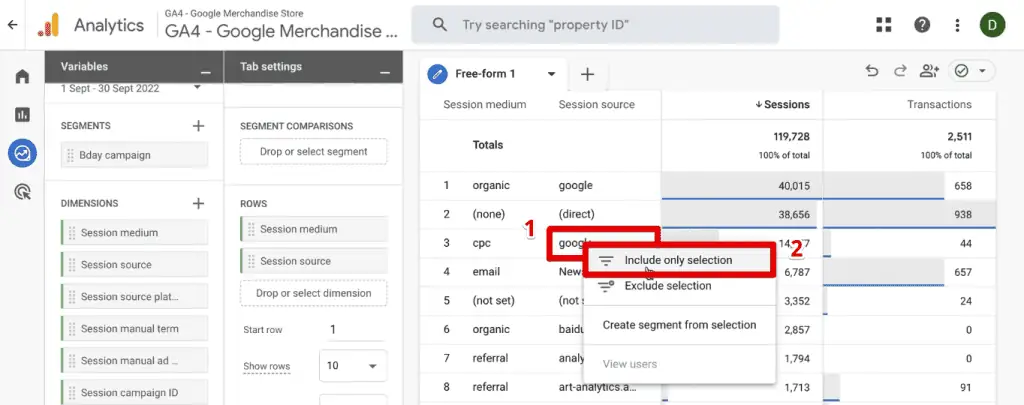
We’ll show you a far easier trick. Click on the dimension/metric we want to filter in the table, then click Include Only Selection.
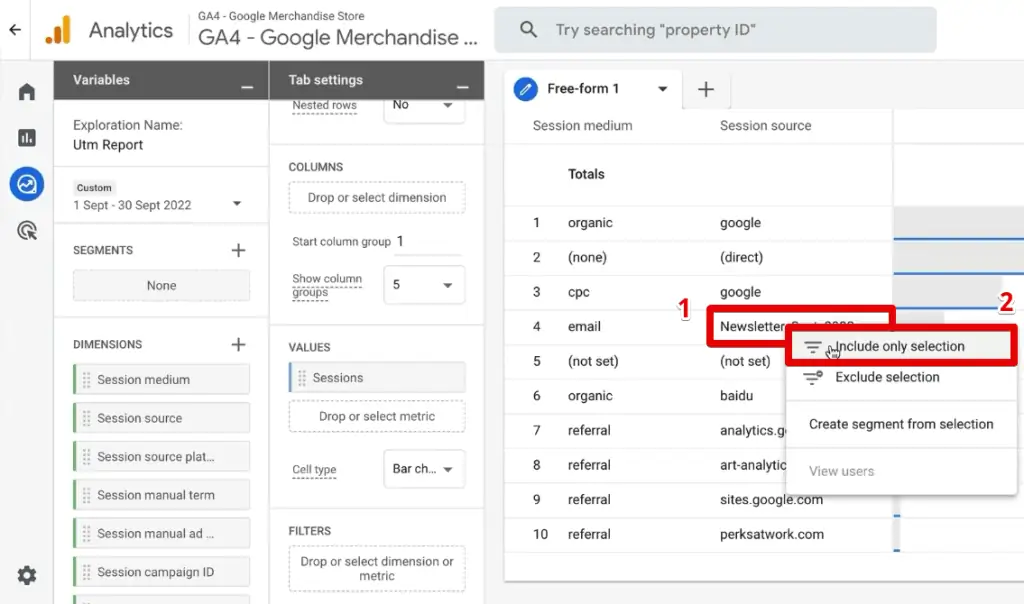
It automatically applies a filter for the Session medium that matches the email.
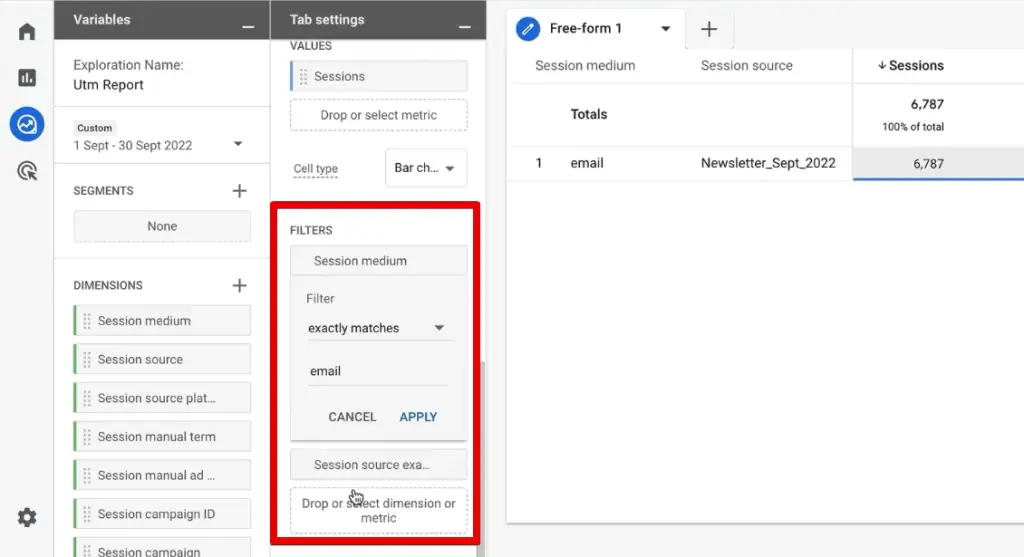
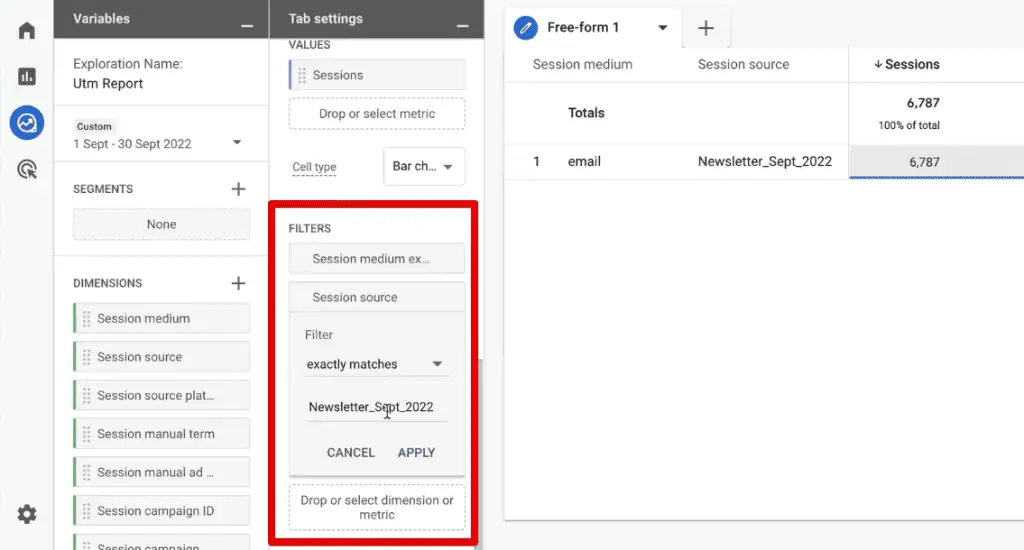
The filter for the Session source that matches our Newsletter_Sept_2022 source will also be applied.
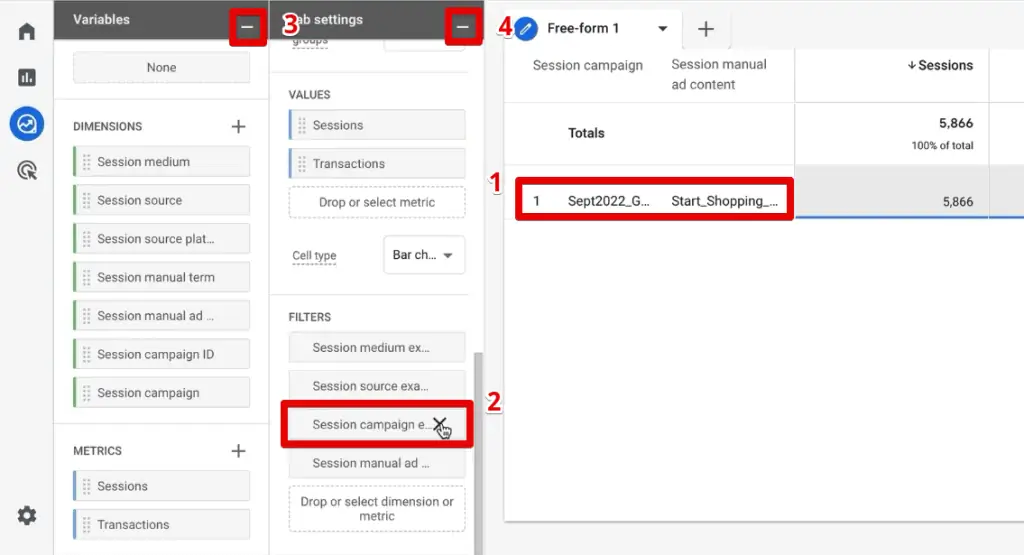
If we want to add another dimension like the Session campaign, our report will get crowded. Since we have filtered the report, remove the Session medium and source by clicking ✖.
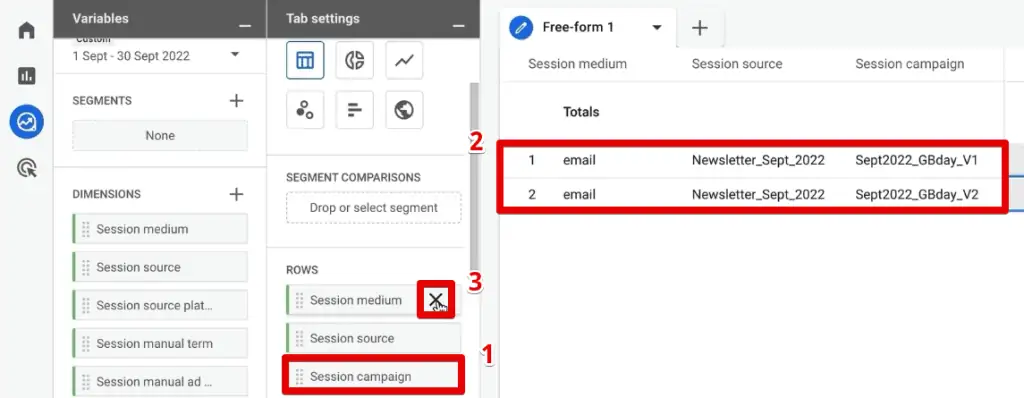
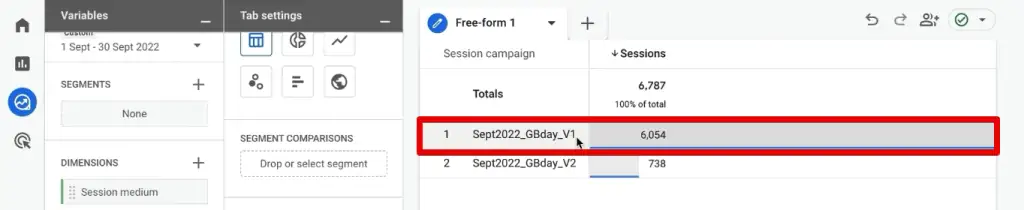
We’re now looking at only the session campaign but filtered down to our email medium and newsletter source. Here, we already can get some great insights.
We had a birthday campaign sent out and two versions of the newsletter. As we can see, more sessions and traffic are coming from version 1.
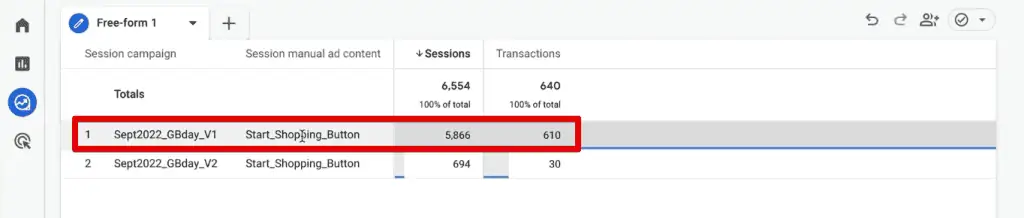
We can still add more metrics at this stage of building the report. Since this is an eCommerce store, the Transactions metric would make sense.
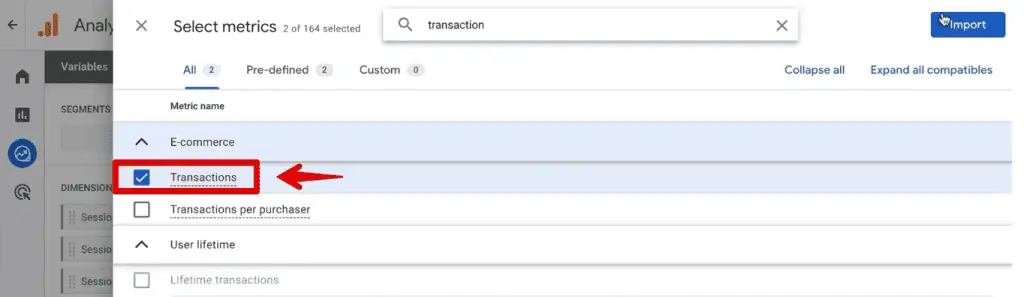
Add the Transactions dimension to the Values section.
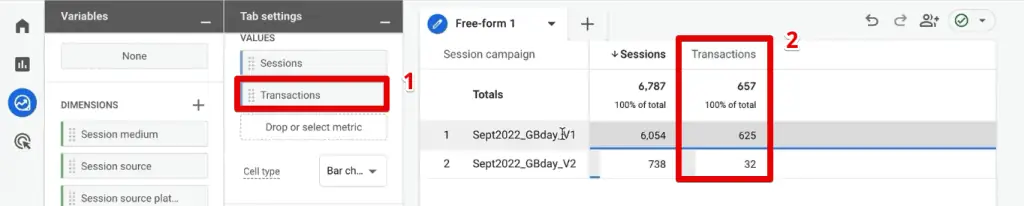
We can look at these two and compare them. We also got more transactions on the first version. There are still more UTM parameters that we could look at, so let’s go back to our UTM builder list.
Adding UTM Content to Exploration Report
If we look at the utm_content parameters, we see a start shopping button and a birthday banner.
Let’s add the utm_content, as well. To refresh your memory, this is the Session manual ad content dimension. Add this to the Rows section.
Our report is getting crowded again, so we might want to filter it again.
Let’s look at the Start_Shopping_Button and click Include Only Selection.
Let’s now look at our Filters.
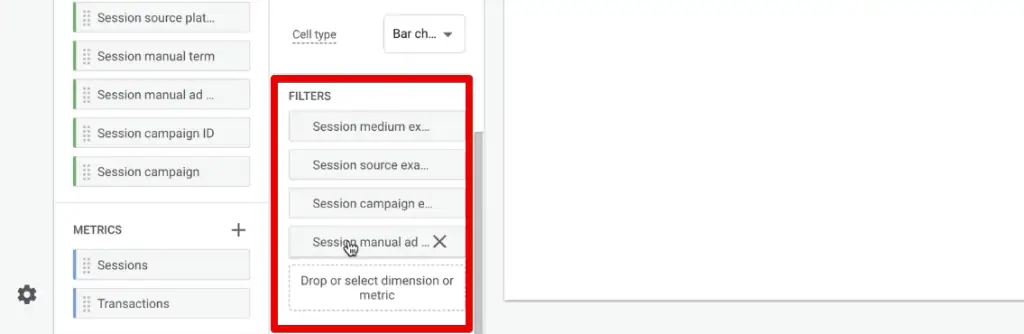
We have two additional filters for the campaign name and content.
What should we do if we wanted to compare the two campaign versions of the start shopping button content?
Comparing Different Versions of UTM Content Through Segments
When we created our filters earlier, keep in mind that our selection will create filters down to the smallest bucket of our data.
For our example, we filtered down to the start shopping button, and filters for content and campaign parameters were created. Similarly, we applied the source and medium filters when we selected the newsletter source.
Since we want to compare the two campaign versions of our start shopping button content, we need to remove the filter for the campaign name. Next, minimize the Variables and Tab Settings panes to see the data better.
We can now clearly see that the first version outperforms the second version by a large margin.
These are great insights you can get when working with your UTM parameters in Google Analytics 4. If you have them correctly documented, you can dig into the data inside GA4’s exploration section to see these data.
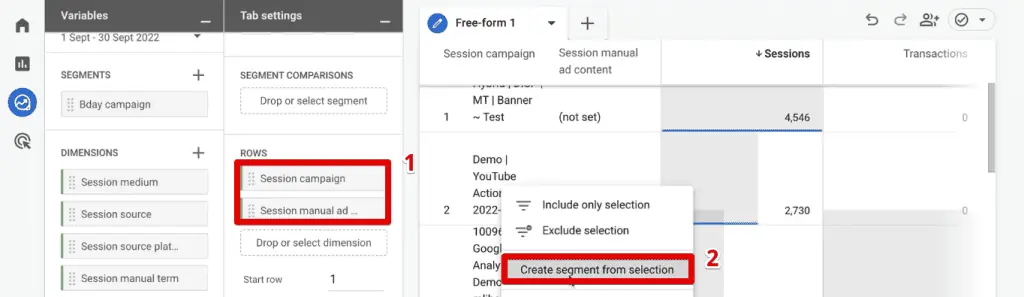
What if you wanted to use this data later on and compare it against other shopping campaigns or another set of UTMs? What we can do is create a segment of our data. There is a shortcut to doing this quickly in our GA4 exploration report.
Right-click the start shopping button content, then click Create Segment from Selection.

It will copy all the different filters and apply them to a new segment. Give a name to this segment, and then click Save.
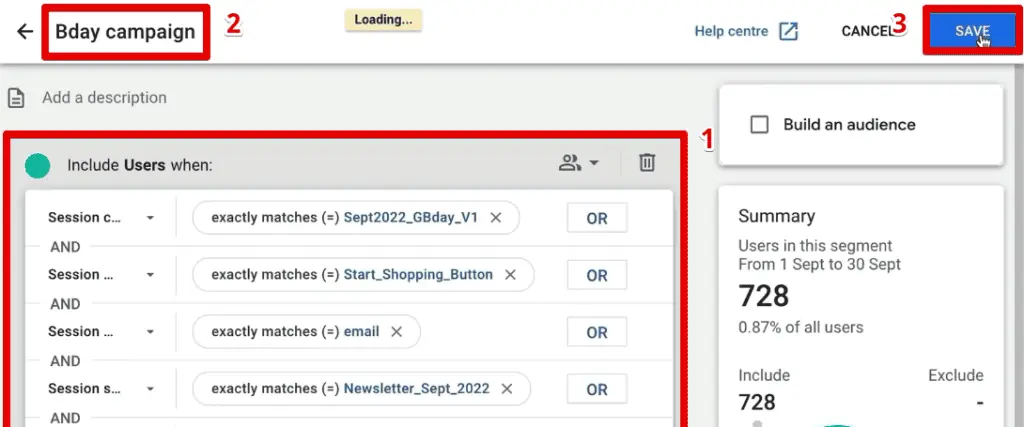
We can even create an audience out of this one. If you wanted to, you could also send this to Google Ads and retarget this one.
Next, remove all the filters and look into a different segment. Let’s start by looking at the session source and medium segment again.
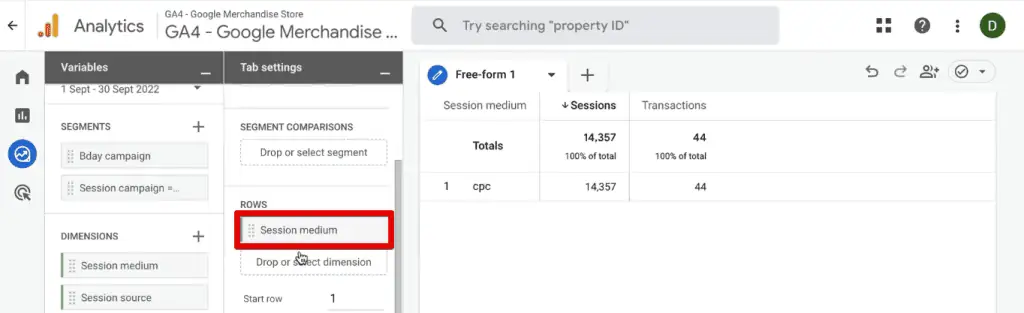
This time, let’s look at the Google CPC campaign and create the filters for this selection.
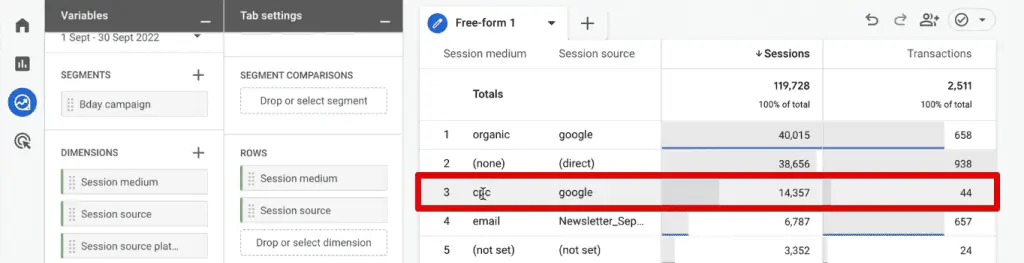
Go ahead and make the filters for this selection. Click on Google and select Include Only Selection.
Next, replace the dimensions in the Row section for the ad content and the campaign name. Select a random data point in the table and create a segment for that selection.
Now, we can compare our two segments. Remove all the filters applied to our report and the dimensions in the row section.
Let’s add a dimension for the data we want to compare in the two segments. For this one, let’s put the Session medium.
Now, let’s add our two segments in the Segment Comparisons section.
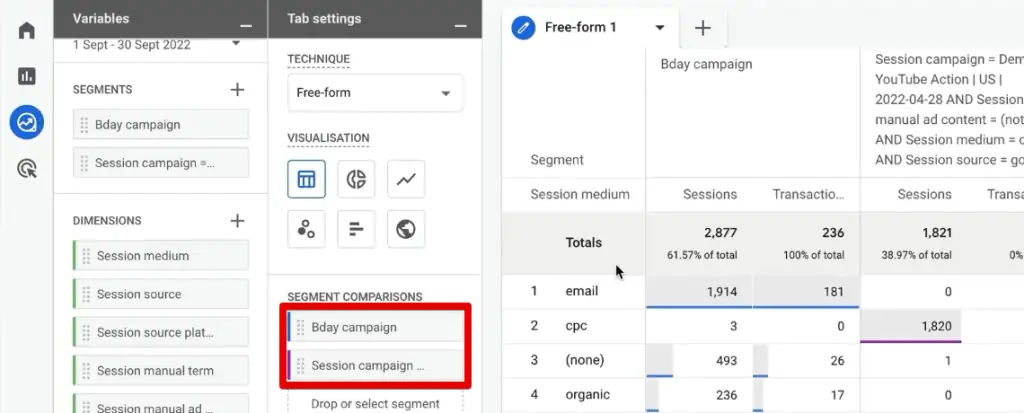
Now, we have the two segments side by side and a Totals section at the end.
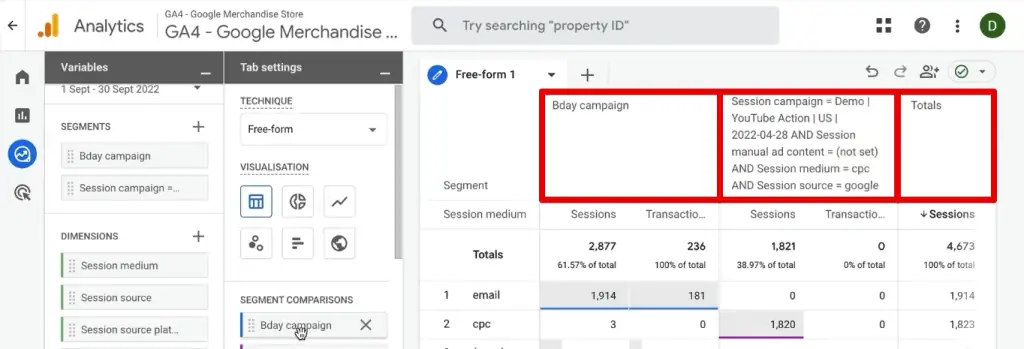
We can now compare the transactions of the birthday campaign to the Google CPC campaign and the total value of both. This comparison allows us to determine which performed better in certain areas.
Our example doesn’t make much sense comparing by session medium, since there is no intersection, but this shows you how you could dig deeper and compare data between two segments side-by-side.
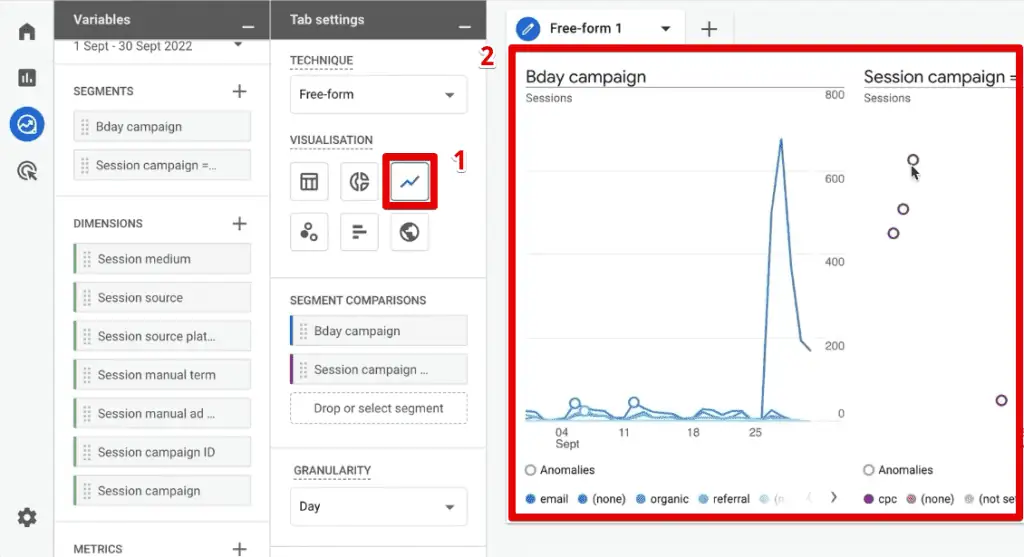
The explorations report is flexible if you know how to work with the data. There are many other visualizations available, as well.
If you want to see your data over time, click on it in the Visualization section, then GA4 will generate this for you.
Advanced Strategies
As always, there are different levels to tracking, and UTMs are no exception. Here, we’ll discuss advanced strategies that help you customize, preserve, and maximize the effectiveness of your UTM data. It is especially useful if you’re using a CRM.
Custom UTM Parameters
If the default UTM parameters in GA4 don’t meet your needs, you can track custom UTM parameters by setting them as custom dimensions. Use Google Tag Manager to capture the value of a custom query parameter and send it to GA4.
This ensures that GA4 recognizes the parameter whenever it appears in your URLs. Have a look at this resource on How to Create Custom UTM Parameters via Google Tag Manager If you’d like to learn how to do this step-by-step.
Passing UTM Parameters to CRM Tools
If you need to track UTM parameters in your CRM, you’ll need to preserve the parameters even as users navigate between pages.
This can be achieved by using cookies to store UTM data.
For example, if you want to capture the source or campaign of a user who fills out a form, you can store the UTM parameters in cookies when they arrive on your website. Then, pass these values into hidden fields within your form.
This approach ensures that even if users navigate away from the landing page, the UTM data is retained and passed to your CRM.
For more details, check our post on How to Capture UTM Parameters in (Hidden) Form Fields or How to Track Lead Sources in ConvertKit with UTM Codes.
Troubleshooting Tips for Misattributed Traffic
Misattributed traffic often results from poor or nonexistent usage of UTM parameters. Here are some common signs and their fixes.
Too Much Direct Traffic
If direct traffic accounts for roughly 25-30% of your overall traffic, this could indicate that your organization isn’t using UTM parameters effectively.
Google Analytics attempts to track traffic sources automatically, but without UTMs, the accuracy suffers. High direct traffic can also be misinterpreted as user familiarity with your brand when, in fact, it’s due to a lack of proper UTM tagging.
Wrong Source Bucket Attribution
Traffic appearing in the wrong source bucket is another common issue. This can occur if you use parameter values that don’t align with Google Analytics’ default channel groupings.
For instance, if you define a source as “psoc” (meaning paid social) instead of the standard “paid,” Google Analytics may misclassify the traffic as Organic Social rather than Paid Social.
Ensure you use parameters matching Google Analytics’ regular expressions for accurate attribution.
Fragmented Traffic
Inconsistent parameter naming conventions can lead to fragmented traffic. For example, using both “utm_source=Facebook” and “utm_source=facebook” will cause traffic to be reported separately in Google Analytics.
Summary
We hope this guide helped you discover how to dig into and decode UTM parameters in Google Analytics 4.
It’s a matter of putting everything together, knowing where the data is, and then slicing and dicing so you can get to the insights.
To recap, we can quickly see our parameters in the traffic acquisition report or personalize our analysis in an exploration report.
These are by no means the only analysis technique on UTM parameters. You can take the data and analyze it in a third-party tool or a Looker Studio dashboard. If you’re new to GA4 UTM tracking, check out our guide on How to Track UTM in GA4.
Which UTM parameter do you use most often? Which method would you use to view your UTMs? Let us know in the comments below!
FAQ
Can I analyze UTM parameters in Google Analytics 4 Exploration Reports?
Yes, you can analyze UTM parameters in Google Analytics 4 Exploration Reports. By creating a blank exploration report, you can add UTM parameters as dimensions and metrics to build a custom report. This allows you to analyze the performance of UTMs and compare different parameters, such as source, medium, campaign, and more.
How can I compare different versions of UTM content in Google Analytics 4?
To compare different versions of UTM content in Google Analytics 4, you can use segments in Exploration Reports. By applying filters and creating segments based on specific UTM parameters, you can compare the performance of different versions side-by-side. This helps you understand which version of the content is more effective in driving traffic and achieving your goals.
Can I create segments and audiences based on UTM parameters in Google Analytics 4?
Yes, you can create segments based on UTM parameters in Google Analytics 4. By selecting specific UTM parameters and applying filters, you can create segments that isolate and analyze data related to those parameters. These segments can be used to compare performance, create audiences for remarketing purposes, and gain deeper insights into the impact of your UTM parameters on website traffic.


")
Hi Julian, this is the best resource I have found on GA4 , thanks! I have created a custom campaign url using the Google campaign url builder, but it is not appearing in GA4. I have followed your instructions on how to find it in the reports and explorations, but there is no sign of it in the data. Is there a setting I need to change to enable campaign tracking? Or do you have any other advice on how to get it to appear in reports please? Thanks.
Hi Emma,
It’s probably because either you are not looking at the right reports which are user/traffic acquisition or your parameter naming convention for utm_medium has caused GA4 to capture it incorrectly.
Try searching for that data under first user campaign dimension