
Last Modified on January 7, 2025
Changes in GA4 also include changes in how core metrics like sessions are redefined. It’s important to understand how sessions work in GA4 so that we don’t give it too much or too less weight.
This is even more essential because UA sessions have been one of the most important metrics to measure site traffic along with the combination of bounce rate.
How are engaged sessions different from normal sessions? How are sessions counted in GA4? Where can we find session timeout settings? These are among the few of several questions that pop up in our mind when we talk about Google Analytics 4 sessions.
In this blog, we will try to find the answers to these important questions including:
- What is a session and how is it calculated in GA4?
- Differences between UA and GA4 Sessions
- UA bounce rate vs engagement rate in GA4
- Where can I find session metrics in GA4?
- Issues with GA4 sessions
So let’s get started!
What is a Session and How is it Calculated in GA4?
When a user views a page on your website and there’s no activity for 30 minutes, then it’s counted as one session, provided their previous session has ended.
Even if the page is open in the background, it will be the same session. If you open the page again to close it, then that’s when the session ends or after 30 minutes (whichever happens first).
By default, GA4 sessions timeout after 30 minutes, but you can change this in the settings by following these steps:
- Admin
- Data Streams
- Configure tag settings

Screenshot showing where to find session time-out settings in GA4
- Settings (click to show all)
- Adjust session timeout
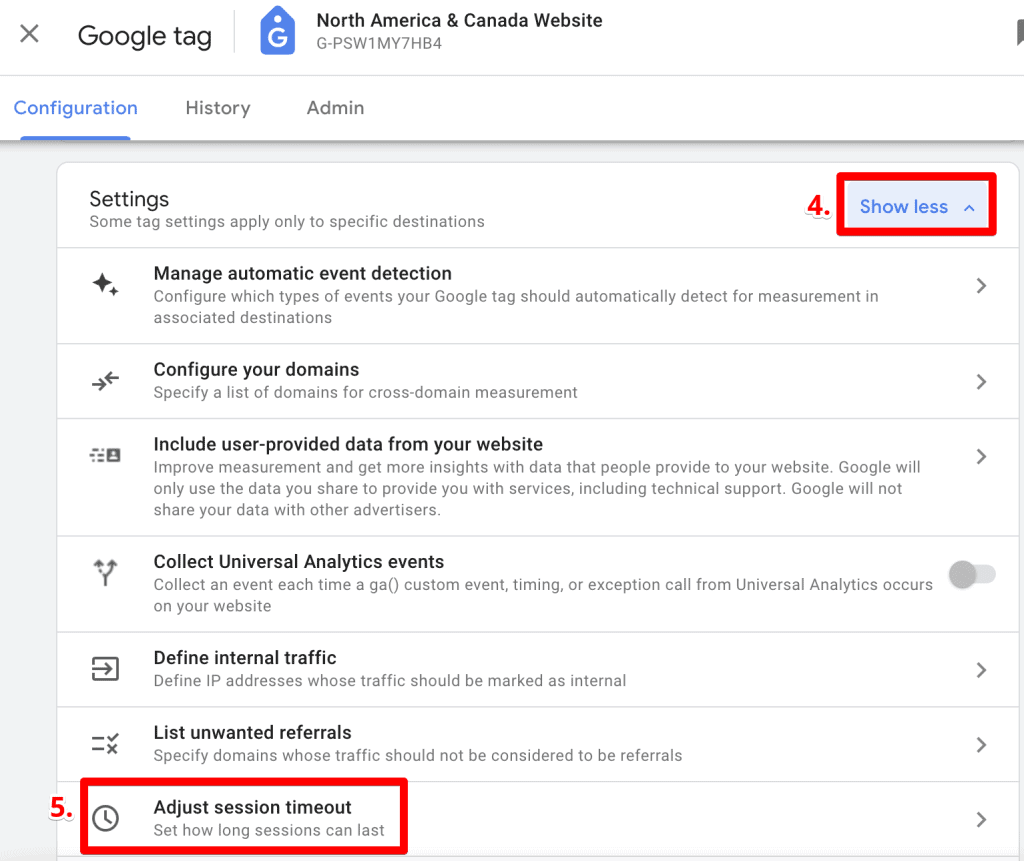
Finally, you get to the screen where you can adjust the session duration.

You can select a maximum of 7 hours and 55 minutes, though that is not an ideal setting to choose for session duration.
Google automatically assigns the event session_start a unique id, i.e., ga_session_id when a session begins along with the session number, i.e., ga_session_number. The sessions are then calculated based on these unique ids.
- ga_session_id – Every time a user visits your website they are given a new session id parameter with the session_start event. This means a single user can have multiple session ids for every session.
- ga_session _number – This is simply a count of sessions for that user. E.g., they visit 3 times and have 3 different session ids and a total count of 3 for sessions.
Differences between UA and GA4 Sessions
If you’re comparing UA sessions with GA4 like-for-like, you won’t get accurate numbers because of several differences between them. Let’s have a look at them in the table below:
| Universal Analytics (UA) | Google Analytics 4 (GA4) |
| Session is a metric on its own | Session is based on session_start event |
| Bounce rate is an important metric to measure the performance | Engaged session is an important event to measure the performance |
| Sessions break when campaign parameters change. E.g., an email to social media for the same user will result in 2 sessions | Sessions don’t break when campaign parameters change e.g. user clicks on an organic or social link it’s still one session |
| Custom dimensions can be session-scoped | No session-scoped custom dimensions |
| New session begins for the same user if it’s midnight (12 am) | Same sessions can go to the next day without starting a new one |
| Easy session breaks mean over-reporting of numbers | No breaking of sessions means the numbers are much closer to the reality |
| Session per user metric includes bounces | Engaged session per user does not take into account bounces within the first 10 seconds |
| Sessions start with pageview, i.e., when a user lands on your website | Sessions can also start without a pageview |
The only thing that is common between the two is the default duration of the session, i.e., 30 minutes which can be adjusted in the settings for both the GA versions.
The most interesting part of the new model of sessions is that the numbers are much closer to reality now versus how they used to be in UA, because they could easily be broken.
A common occurrence is that the same user could click on two different URLs with different campaign UTMs where UA counts each URL with a different campaign as a separate session, but GA4 would only count one session, thus being much closer to reality.
Another issue is the number of people who would be browsing your site at night and when the clock hits 12 am, UA starts a new session. This number could be quite big if you have high traffic and cater to people from different regions. Thankfully, GA4 has addressed this problem.
There could be other reasons, as well, why there’s a difference in session counts in UA and GA4:
- Using UTMs on internal links/pages is not a good practice, as it results in multiple sessions in UA.
- Data filters on UA views can result in the exclusion of some data. In GA4, this can only happen for 360 customers, as they can have filters on the sub-property. However, GA4 still assigns a session id even when session_start is filtered out.
- GA4 uses statistical estimates to estimate the number of sessions, whereas UA has no such estimates. However, as per Google, these estimated sessions have high accuracy with a low error rate.
If you would want to get even more accurate numbers, then export the data to BigQuery as those numbers won’t be estimated.
Let’s talk about GA4 sessions without a pageview. For instance, when a user lands on the Measureschool blog but goes to another tab and comes to read the blog hours later, UA would count it as one session with a pageview.
On the other hand, GA4 will record two sessions. The first one will have a pageview parameter, but the second one will have user engagement but no pageview, as that already happened hours ago.
Moreover, engaged sessions are a bit fairer than the bounce rate metric.
UA Bounce Rate vs GA4 Engagement Rate
It’s important to understand the difference between the two key metrics for sessions in both platforms, so we can judge which one is better, not that we will be using UA for much longer.
In UA, a bounce is when a visitor bounces after a single pageview and exits the website without triggering any other event. The rate is then calculated by dividing single-page sessions by all the sessions.
Engaged sessions in GA4 are those when a visitor stays on the page for at least 10 seconds, triggers any events, or has 2 or more page screen views.
If the session is not engaged, then GA4 counts it as a bounce and you can see how that’s different from the bounce rate in UA. The GA4 bounce rate is the inverse of the engagement rate.
In simple terms, it means that if the engagement rate in GA4 is 25%, then the bounce rate is 75%, and knowing one would mean you can find out the other.
The engagement rate is then calculated by dividing engaged sessions by the total sessions. But why is engagement rate a better metric than a bounce rate in UA for a session?
The engagement rate is a better metric because if people are engaging with your website/content then they are more interested in what you’re offering. The bounce rate is somewhat of a negative metric and focuses on people who are either not interested in your site or aren’t relevant at all.
It can also mean that people who are engaging are much easier to convert, due to their high intent versus focusing on people who are bouncing.
However, it is even better to use both of them in tandem, as they can be quite helpful in providing valuable insights.
For instance, if a page has a high bounce rate, then you can put efforts to optimize it for a good user experience or have more relevant content for the target audience.
On the other hand, you can find out what type of content or traffic sources are more engaging than others, so you can divert your ad spending toward them.
Where can I Find Session Metrics in GA4?
There are four types of session metrics in GA4:
- Engagement rate
- Engaged sessions
- Engaged sessions per user
- Average engagement time
You can find them in most built-in reports and where you cannot, you can edit and add these metrics. We’ll show you how to add them in the later part of this section.
Acquisition Reports
Under the acquisition reports, the two reports where you can find these metrics are the User acquisition and Traffic acquisition reports.
Go to Reports → Acquisition → User Acquisition and you can find these metrics as shown below:

A similar process follows for the Traffic acquisition reports as well.
Engagement & Monetization Reports
The first report, i.e., Engagement overview is good to get an overall idea about your website’s engagement and as such doesn’t provide much context.

For the Events, Conversions, and most importantly, Pages and Screens reports, you might not see any or just one or two engagement metrics, if someone added them previously.
You’ll see a similar thing in the Monetization reports, as well. But for any report where you don’t see them, you can add them yourself. More on this in a bit.
Demographic & Tech Reports
You will find pretty much all the engagement metrics in the Demographic details and Tech details reports, as seen below:

If you don’t see them right away, chances are you forgot to scroll horizontally to the right, as it’s easy to miss! Follow the same process for the Tech details report.
How to Add Engagement Metrics to Reports?
You can add engagement metrics to any default report if you have edit access to the GA4 account.
Let’s add them to the Pages and Screens report. Click on the pencil icon in the top right corner to Customize the report.
Next, on the right pane, you will see a whole menu of different settings, so click on Metrics:

You will now see all the Metrics that are currently added to the report. Click on the ‘Add metric’ dropdown at the end to select from all metrics or search for ‘engagement’ to see all the engagement metrics.


Once you’re done, click on the blue Apply button in the bottom corner and choose whether you want to Save changes to current report or Save as a new report.

That’s it!
You should now see these metrics on the reports you’ve added them to.
As for the Explore section, it’s pretty much an open season and you can see almost any available metrics bar a few that are user-scoped, e.g., funnel exploration.
Issues with GA4 Sessions
GA4 sessions don’t come without any issues, but as long as you are aware of them, you will be making informed decisions.
- Sessions are estimated based on unique session ids because Google wanted to reduce the processing efforts, especially for larger data sets, which can be an issue. However, we know that most analytics numbers are not 100% accurate.
- Sampling – This was an issue we faced in UA and it continues in GA4 as well. It’s still better than UA because hit limits and session limits aren’t applicable anymore.
For high-traffic websites, this is generally good news. But for low-traffic websites, it can become a problem where Google protects the user’s privacy and samples the data. - Session data is anonymized and aggregated, which can cause attribution issues because GA4 cannot assign personally identifiable information (PII) for obvious privacy reasons. It is a bit of an issue if you want to attribute revenue to certain marketing campaigns.
For the most part, you can get around these issues by exporting the data to BigQuery or Looker Studio, but that demands a blog on its own.
Being aware helps you to make better-informed decisions and these issues shouldn’t really be a deal breaker.
FAQ
What are Google Analytics 4 Sessions?
Google Analytics 4 (GA4) Sessions refer to the measurement of user interactions on a website or app within a specific time frame. In GA4, a session starts when a user views a page on the website, and it continues until there is no activity for 30 minutes or until the user closes the page. Even if the page is open in the background, it is considered part of the same session. The session duration can be adjusted in the GA4 settings, with a default timeout of 30 minutes. Sessions are calculated based on unique session IDs assigned by Google Analytics. Each time a user visits the website, a new session ID is generated, allowing for tracking and analysis of user behavior.
How are sessions counted in GA4?
Sessions in GA4 are counted based on the session_start event. Each time a user visits the website, a new session ID (ga_session_id) is assigned, and the session count (ga_session_number) for that user increases. Sessions are calculated based on these unique IDs. The session_start event marks the beginning of a session, and sessions continue until there is no activity for 30 minutes or until the user closes the page. Sessions can also start without a pageview, such as when a user lands on the website and triggers an event without viewing a specific page.
Where can we find session timeout settings in GA4?
The session timeout settings in GA4 can be found in the following steps:
1. Go to the “Admin” section in your Google Analytics 4 account.
2. Under the “Data Streams” tab, select the relevant data stream for which you want to adjust the session timeout.
3. Click on “Configure tag settings” for the chosen data stream.
4. Scroll down to find the “Adjust session timeout” option.
You can adjust the session duration by selecting a value within the available range, up to a maximum of 7 hours and 55 minutes.
Conclusion
So, we have learned a lot about sessions, how they are measured and what’s so different about them in GA4 compared to UA sessions.
You also learned where to find session metrics in GA4 and how you can add them to the standard reports if you don’t see them.
Analytics always comes with some caveats and the issues GA4 sessions should not discourage you to abandon ship completely.
Keeping in mind all these things, the new model of session measurement as well as the inclusion of session engagement metrics gives you more flexibility to measure user behavior.
Combined with the powerful events model and more parameters, you do have much power with GA4 to generate some great insights, as sessions alone hardly give you much context.
Yes, it will take time to move away from our old habits but eventually, you will get there. Here’s some great advice on best practices for GA4 setup.
🚨 Note: Check out the new feature in GA4 called Scopes of Traffic in our informative guide.
That will be all today, folks! Let us know in the comments below how you find sessions in GA4 useful, especially the engaged sessions and engagement rate metrics. We are all ears!


")