
Last Modified on July 8, 2024
GA4 got rid of a lot of built-in reports that used to be part of Universal Analytics and irked many users, as new changes often do.
But now that the dust is settling and more and more people are using GA4 or in the process of migrating to GA4, they realize that there’s a lot more it has to offer.
The funnel exploration report in GA4 is one of those offers. If you are related to marketing in any capacity, then you must have heard about funnels.
You won’t be able to reap the full benefits of the GA4 funnel exploration report if you do not know how to use it.
So, in this blog post you will learn about using the funnel exploration report in GA4, covering the following areas:
- What is a funnel exploration report?
- How to Create a funnel exploration report in GA4?
- How do the two types of funnels work in GA4?
- Creating Segments from the funnel exploration report
Since we are looking at funnel reports, you might also be interested in looking at another useful post on our blog: 10 GA4 Metrics You Can Use to Better Understand Your User Behavior.
Let’s get on with it.
What is a Funnel Exploration Report in GA4?
A funnel is a path your website visitors take to get to a certain point by visiting different pages and/or completing different actions to complete the goals you have set, e.g. submitted form, lead generation, eCommerce purchases, and so on.
The funnel exploration report in GA4 helps you to visualize that path which makes it easier for you to analyze and see where the visitors are dropping off.
Why analyze? You want to reduce the number of visitors who are abandoning the funnel at each step and want to get them to complete the final step, i.e. your set goal.
Marketers can also create different remarketing campaigns based on where the visitors are dropping off, as it shows their intent. E.g., someone who reached the last step is far more interested in your product than the person who dropped off at the second step.
Therefore, the campaigns would be completely different for each type of audience.
How to Create a Funnel Visualization Report in GA4?
Once you’re logged into your GA4 account, go to the left panel and click on the Explore section. Here you will see all the reports previously created (if any) by everyone who has access to your account. Click on the Funnel exploration report in the templates gallery.
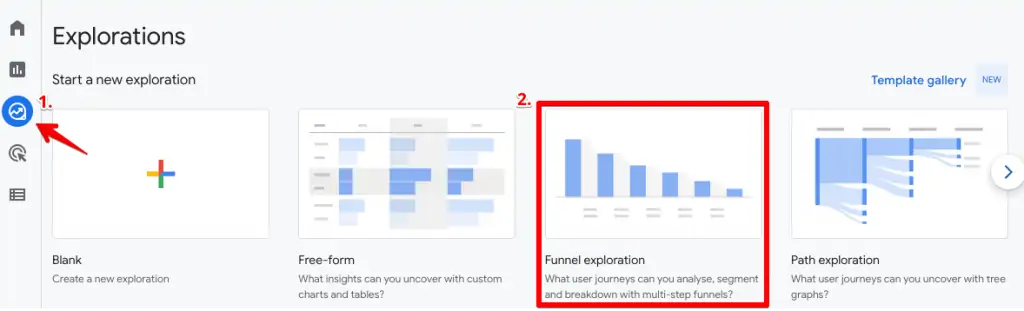
You will now be shown a sample report with default settings that you can configure as you wish.
The setup interface of the funnel visualization report in GA4 contains three major sections:
- Variables
- Tab settings
- Report (based on your selected settings in the above two sections)

We will explore (pun intended) each section and the settings from which you can choose to create a final report to draw insights.
Variables
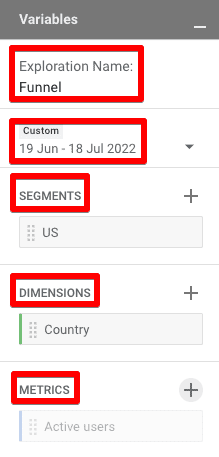
If you’ve had some encounters with GTM, then you might be a little confused, but these variables are not related to GTM in any way. You can configure five things (or variables):
- Exploration name
- Date
- Segments
- Dimensions
- Metrics
All of these variables are customizable as per your preference or depending upon what you’re looking for. They serve as input for the information you want to see in the report.
Name and Date
The first two variables (name and date) are self-explanatory. It’s a good practice to choose a name that makes sense to others in your organization.
Segments
If you want to look at a certain group of your visitors or compare different groups, then you should apply segments; otherwise, leave it as it is.
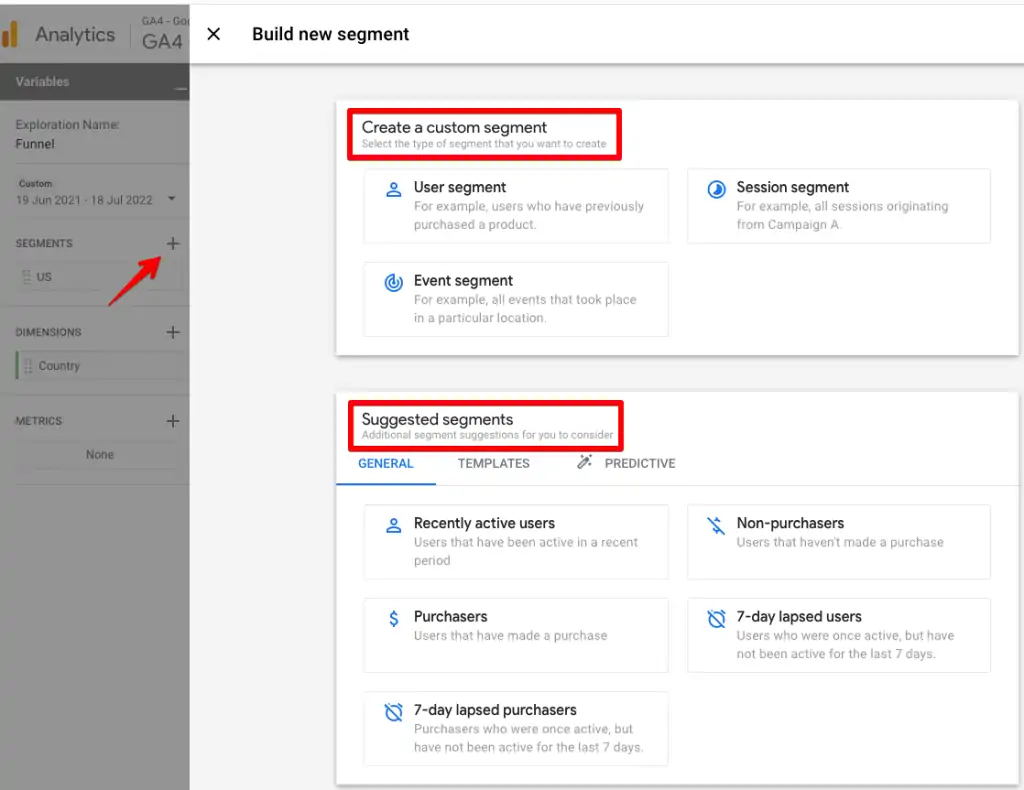
To create a segment, simply click on the ‘+’ symbol and choose the type of segment you want to create, i.e., custom or the suggested ones.
In custom, you can create three types of segments based on User, Session, or Event. You can create as many segments as you would like to.
Dimensions
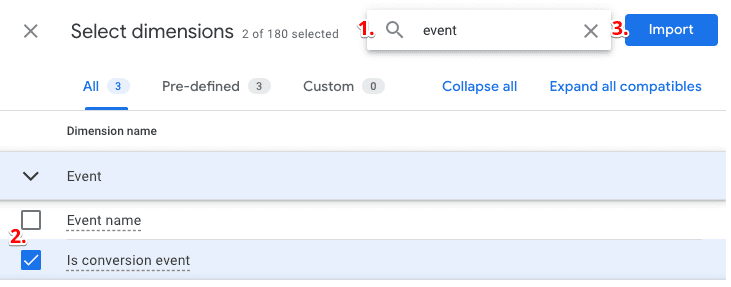
This is an important variable of the funnel visualization report where you can select different attributes of any event, user, e-commerce, and so on, from a long list of available dimensions (including any custom ones you have created). For instance:
- Event → Is conversion
- User → New/Established
- Ecommerce → Product name
Adding dimensions is straightforward as long as you know which ones you want to add. Simply click on the ‘+’ icon → select the dimension by checking (you can search for it to save time) → click on Import.
Metrics
You cannot add metrics in this report as it is based on the users by default. So, you won’t be using this variable and there is nothing to do at this time.
🚨 Note: This part will only create the variables (segment, dimensions), it does not apply it to the report which happens under the Tab settings.
If you have missed any items, you can always add them later. Of course, dates can be changed anytime, which will affect the data you see.
Tab Settings
In this section, you can set how the final report appears and how it’s broken down. There are nine categories of settings that can be configured in this tab.
- Technique
- Visualization
- Open/Close Funnel
- Segment Comparisons
- Steps
- Breakdown
- Show Elapsed Time
- Next Action
- Filters
Let’s look at how these settings can affect your report. Some of these are important, while others are optional and dependent upon your reporting needs.

Technique
This can also be referred to as the type of report you are creating and there are six options:
- Free-form
- Cohort exploration
- Funnel exploration
- Segment overlap
- Path exploration
- User lifetime
For this report, we will be focusing on the funnel exploration report.
Visualization
There are two types of funnel visualizations we can select from:
- Standard Funnel
- Trended Funnel
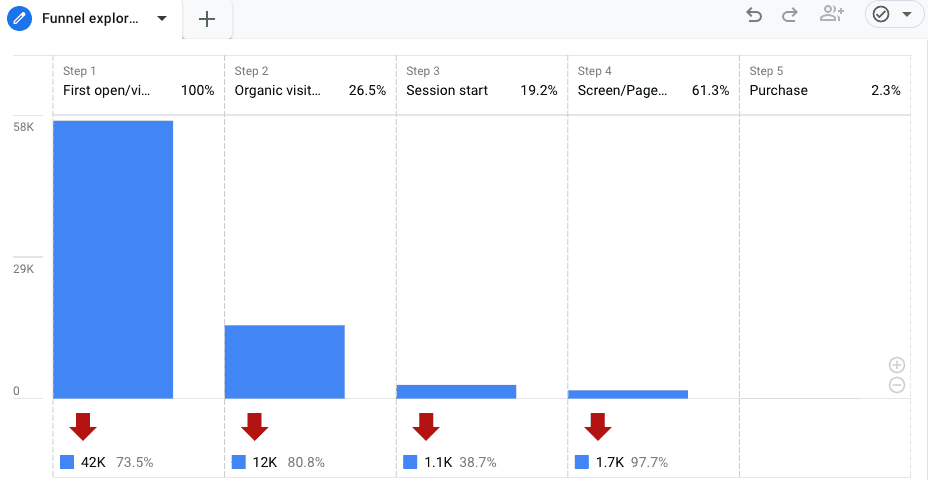
The standard funnel is the most common visualization, with a bar chart and drop-offs at each step.
The trended funnel helps us to analyze how a funnel is performing over time, which can be very useful.
Each step is shown as a trend line over time and if we hover over or click on of the lines, it will be highlighted. Funnel steps are also shown as tabs. The ‘All’ tab will show all the trend lines together in one graph (which can quickly get confusing if there are many steps).
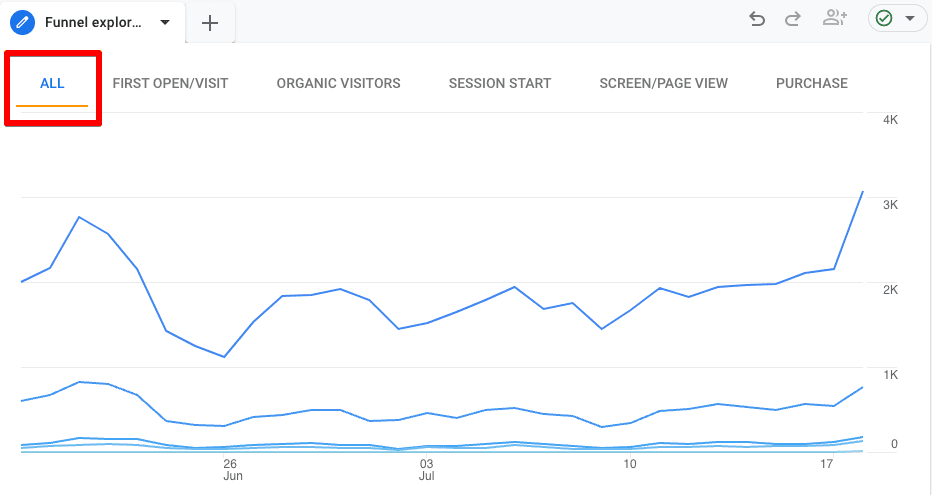
If you want to view the trend line for an individual funnel step, you can simply click on the tab.

For this blog post, I will go with the standard visualization.
Open/Close Funnel
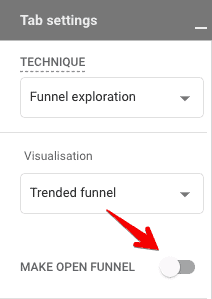
The make open funnel toggle switch converts the funnel (closed by default) into an open one, but what does that exactly mean?
A closed funnel means that if your website visitor enters step 2 or any other step except the first one, then they won’t be counted.
But, if you want all the users to be counted regardless of what step they are entering the website then you can go with the Open funnel.
Both settings would eventually affect the number of users being counted.
Segment Comparisons
If you created any segments in the variables section of the report, now is the time to apply them, either by a simple drag & drop method or by double-clicking on the segments in variables.
You can apply up to four segments for comparison similar to Universal Analytics. Each segment will have its bar chart and nested values in the table below. If you hover over a segment, it will highlight the values for that particular segment.
For instance, here we are comparing Mobile traffic vs Tablet traffic. You can see how each segment gets its own color for easy differentiation.
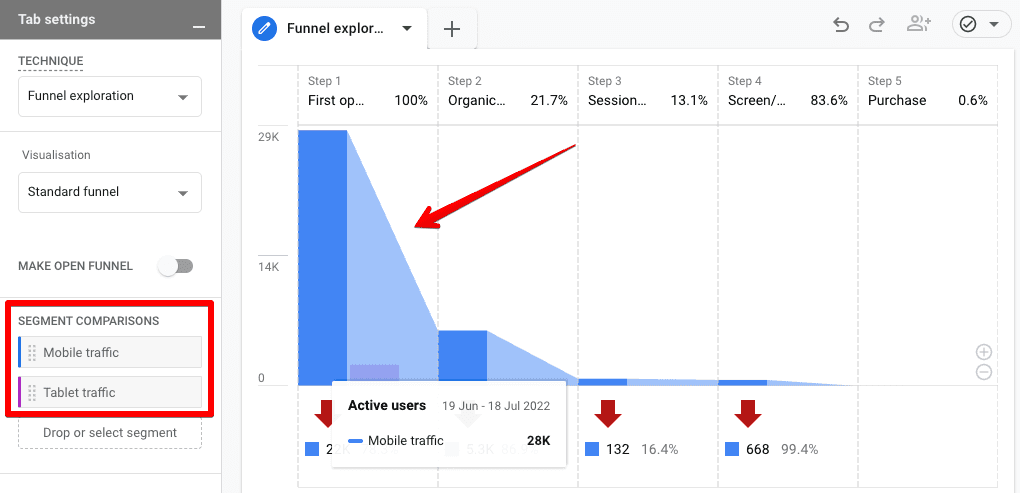
If you want to use Trended funnel visualization with segment comparisons, it might get quite noisy if you’re looking at the all steps tab (and more segments), which would make the analysis part difficult.
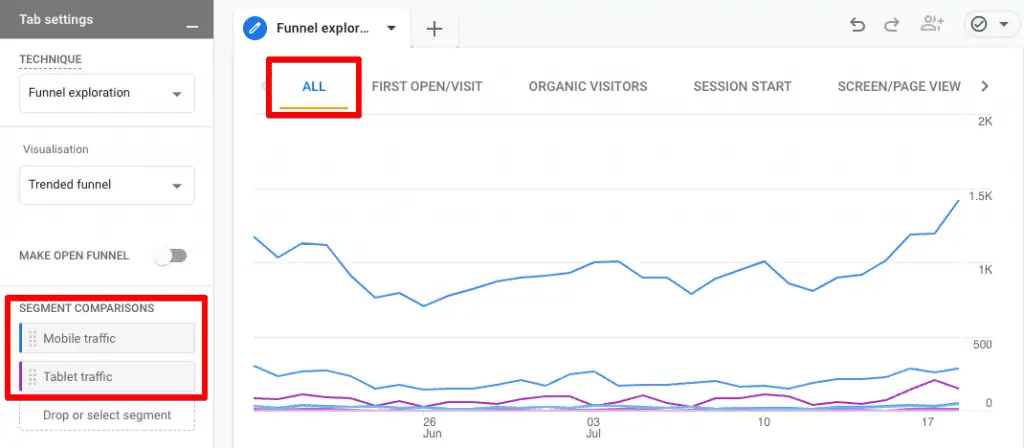
You can select only one of the steps (as shown above) to cut out some noise and analyze the funnel over time.
Steps
You’ve now reached the crux of the funnel exploration report in GA4. This is where you configure the different steps of your funnel report.
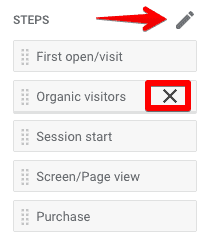
You can remove any unwanted steps in your funnel reports added by default. To add or edit your steps, click on the pencil icon.
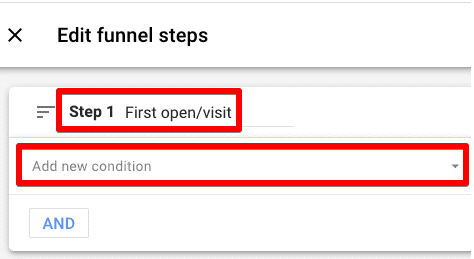
In the Edit funnel steps interface, you can give your step a name (which does not affect any data) and configure the conditions.
To configure the conditions, click on Add new condition.
Next, you will see several pre-existing events and any custom dimensions to choose from. If you know the event you want to add, searching might be a quicker way.

You can also add more conditions by using the OR / AND buttons in the interface. You can also add parameters to your events to be more specific.

The next step settings allow you to choose from
- is indirectly/directly followed by
- Within (specific time duration) seconds, minutes, hours, and days

Each funnel step setting also allows you to Copy step, Remove step, Add step above, or Add step below. Simply click on the 3 dots in the right corner.

Breakdown
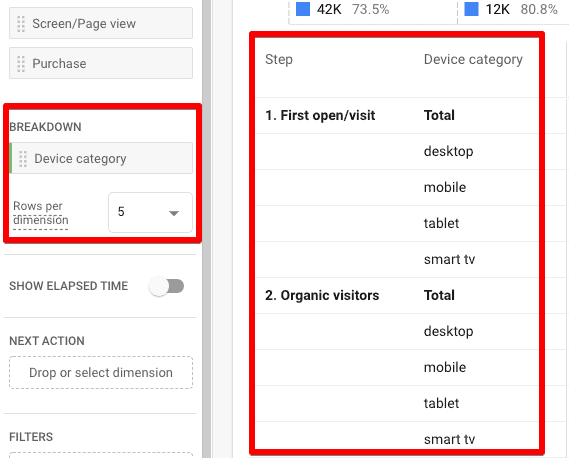
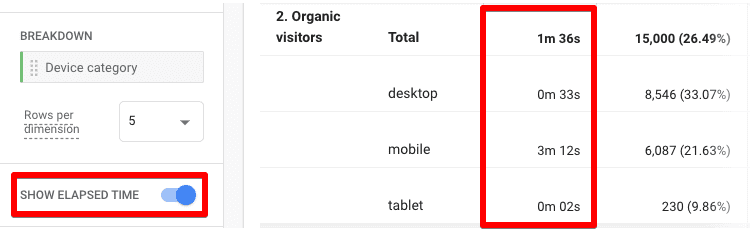
You can also break down the data shown below the funnel visualization chart if you have to look at the data for different dimensions. For instance, if you want to see how the funnel performs on different devices, you can select to add the Device category in the breakdown.
If your selected dimension has several rows, then you can select Rows per dimension you want to see (especially if you have more than one dimension). For our example, we know there are only four devices.
Show Elapsed Time
Do you want to find out how long it takes for your website visitors to process from one step to another? If yes, then you can enable the Show elapsed time to see that in the next column of your step.
Next Action
If you are interested to see what are the next actions your users are taking after each step, then you can add the Event name dimension and hover over the funnel graph to view the Top 5 Next Actions.

If you want to filter out any event among the Top 5 Next Actions, then you can apply a segment to exclude it since the filter option in the tab settings does not work on it.
Filters
Filters can be very helpful if you are seeing a lot of generic data and want to narrow it down. You can drag and drop any dimension that you have already created in Dimensions and create a filter based on the match type.

Report
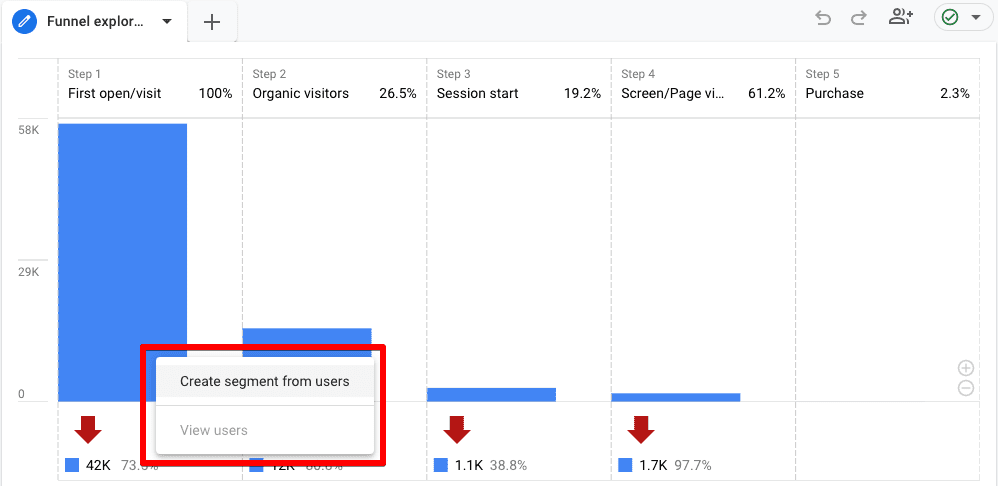
Once the report is ready, you can interact with it in a couple of ways and get more out of it.
Remember how we talked about remarketing in the beginning? You can also create audiences from the funnel exploration report in GA4 by right-clicking on any step and clicking on Create segment from users.
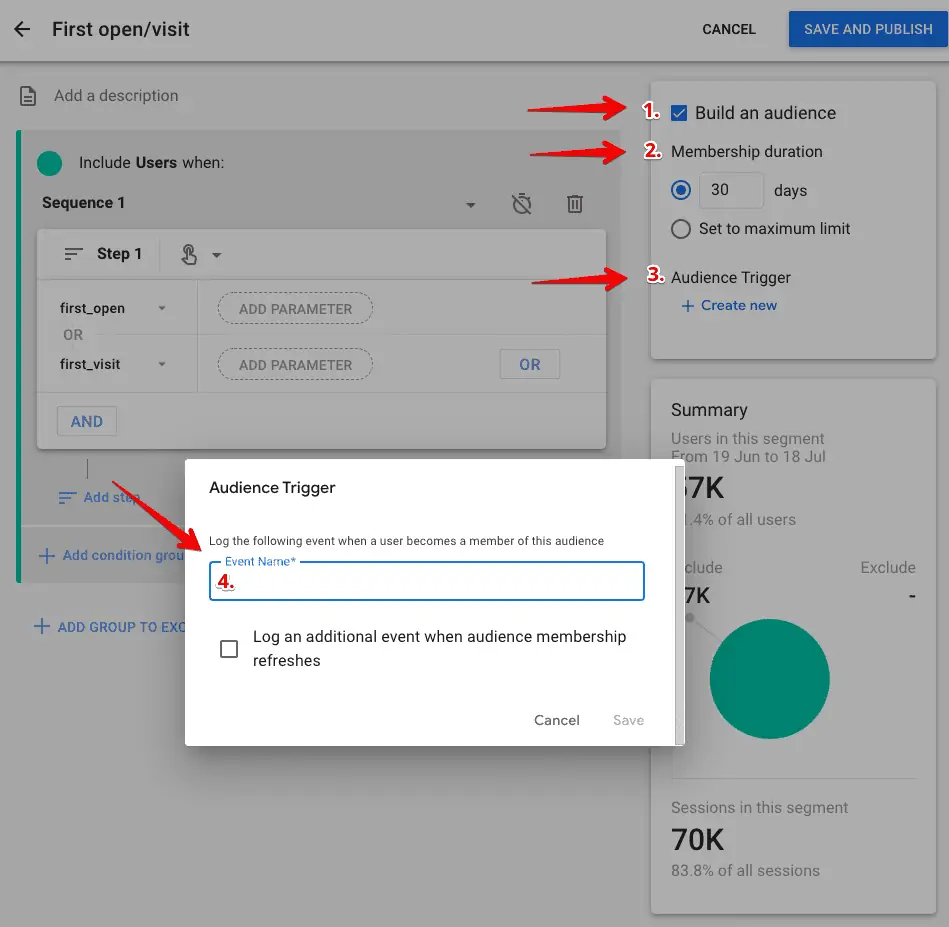
Once the segment configuration opens up; follow these four simple steps:
- Check the Build an audience box
- Select the Membership duration
- Create an Audience Trigger
- Enter the Event Name to show up in GA4 and save
🚨 Note: If you’re using an Open funnel or funnels with steps that immediately follow each other, then you cannot create segments from the funnel visualization report
If you find that the difference between some steps is relatively high and the bar graphs are hardly visible, you can zoom in to the charts by clicking on the ‘+’ symbol or swipe up while keeping the cursor on the graph.

FAQ
How can I create a funnel exploration report in GA4?
To create a funnel exploration report,
1. Log into your GA4 account.
2. Go to the Exploration section.
3. Select the Funnel Exploration report in the Templates Gallery.
4. Customize the variables and tab settings according to your requirements
5. The report will be generated.
Can I compare different segments in the funnel exploration report?
Yes, you can compare up to four segments in the funnel exploration report. This allows you to analyze and compare the performance of different groups of visitors within your funnel.
What are the different types of visualizations available in the funnel exploration report?
The funnel exploration report offers two types of visualizations: standard funnel and trended funnel. The standard funnel displays drop-offs at each step in a bar chart, while the trended funnel shows trend lines for each step over time.
How can I create segments from the funnel exploration report for remarketing purposes?
To create segments from the funnel exploration report, right-click on any step and select “Create segment from users.” Configure the segment settings, such as membership duration and event trigger, and save it. This allows you to create audiences for targeted remarketing campaigns.
Can I zoom in on the funnel visualization charts in the report?
Yes, you can zoom in on the funnel visualization charts by clicking on the “+” symbol or swiping up while keeping the cursor on the graph. This helps you view the data more closely, especially when the difference between steps is relatively high.
Are there other reports in GA4 that I can use alongside the funnel exploration report?
Yes, GA4 offers a range of other reports that can provide valuable insights into user behavior. Some examples include cohort exploration, segment overlap, path exploration, and user lifetime reports. Each of these reports focuses on different aspects of user engagement and can be used to gain a comprehensive understanding of your audience.
Summary
So, we’ve covered how the funnel exploration reports in GA4 work, what are standard and trended visualizations, how open and close funnels show data, and how to create segments of users for remarketing.
But this isn’t the only report in GA4 and there are other reports in GA4 that we can use to draw important insights, but we’ll leave them for another time.
Speaking of other areas, if you’re trying to set up GA4 custom dimensions, our guide will help you get started.
If you’ve enjoyed this article, be sure to check out our top 10 GA4 Exploration reports with their use cases.
Did you get a chance to create a funnel exploration report in GA4? Let us know how open/close funnels worked for you in the comments!


")
hi, what means “is indirectly/directly followed by” can you explaim better?