
Last Modified on January 7, 2025
Ever wondered why there are sudden spikes or dips in your data?
When working with data, you know that it’s always changing and unlikely to follow a consistent pattern throughout your observation period. However, looking at the overall picture, you’ll see either an overall trend or an average value.
Considering this pattern, there may be instances where the data for a specific date falls way off of the range of expected value. There may be an unexpected spike of users on your website, or your traffic suddenly dropped dramatically on a specific day of the week.
As business owners, we want to determine why these anomalies happen. Fortunately, Google Analytics 4 allows you to detect these abnormal patterns in your data, dive deeper into their analysis, and thus fix the underlying issues.
With this in mind, we’ve created this tutorial to show you how to identify outliers in your data with the help of GA4, to aid in making better business decisions.
Here is an outline of our guide on how to set up Anomaly Detection in Google Analytics 4:
- What is an Anomaly?
- Anomaly Examples
- How to Check Anomalies with Google Analytics 4
- How to Create Custom Insights
- Anomaly Detection in Google Analytics 4 Explore Section
- How to Use Breakdowns to Better Understand Your Data
Let’s go!
What is an Anomaly?
First, let’s be clear about what we mean when we talk about anomalies.
An anomaly is something that deviates from what is standard, normal, or expected. In other words, these are the outliers in your data. For example, you could have an unexpected spike in users or transactions on your website.
This could also be the opposite – a sudden decrease in your traffic on a specific day of the week. You could also possibly identify some web pages with unusually low conversion rates compared to other pages. These are potential issues that you need to fix.
Sudden dips in traffic or transactions are something you want to avoid, but an unexplained increase may be a symptom of a larger issue wherein you’re reporting larger values than what happened.
Spotting abnormal patterns in your data, especially those that have an underlying value to your business, allows you to mitigate any possible damage or grasp growth opportunities.
If we could identify the cause of the spikes in our data and find out that it is something we could replicate, then we could potentially boost our business to greater heights.
Let’s look at examples of some business decisions that will surface if you’re implementing anomaly detection in Google Analytics 4.
Anomaly Examples
Let’s say you implemented tracking on your website and spotted an anomaly. If you could understand the issue, you can better conclude if there is a technical issue you need to fix.
Next, you could be running your eCommerce store, and want to follow the trends. Using anomaly detection in Google Analytics 4 will help you understand what products are in demand right now.
How to Check Anomalies with Google Analytics 4
For this guide, let’s look at how we could be using Anomaly Detection in Google Analytics 4 to identify unusual traffic patterns.
We’ll be working mainly on the demo account, but we also have our business account since the demo account has some limitations in its use.
Here’s how to check anomalies with Google Analytics 4:
- Go to reports
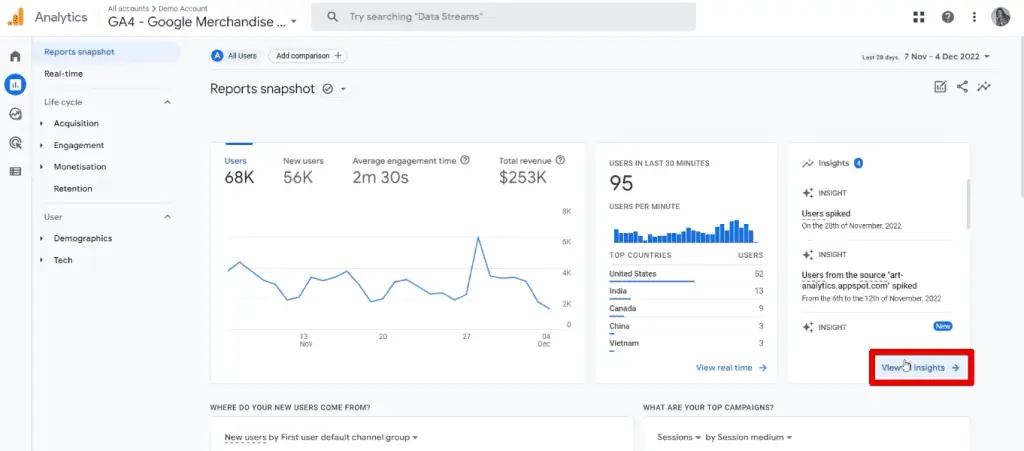
- Click on View all insights
- Select an insight you want to observe
If we go to our reports, we could see our Insights pane.
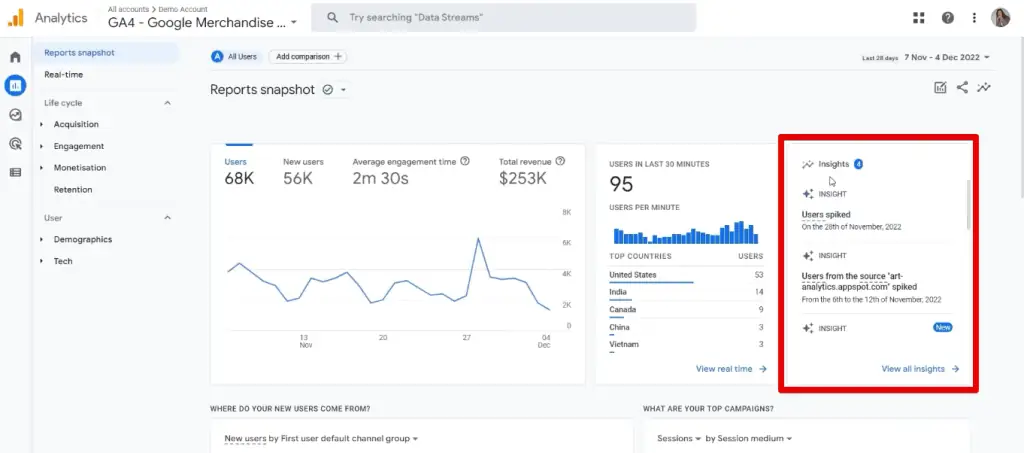
The first way to identify anomalies in GA4 is to use insights. Google has been heavily investing in machine learning and this is the result. Insights give you the ability to quickly identify outliers without having to press or do anything – a great time saver.
You’ve been given some hints about some spikes or decreases. This way, you can identify issues or opportunities for your website or application, and find the problem quickly.
If you click on View Insights, we can see the list of all the insights Google has detected on the data in your account.
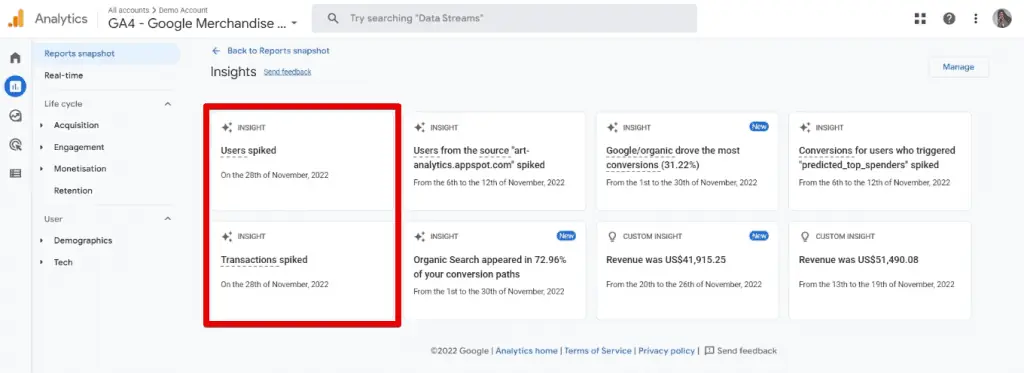
There are two main types of insights in this section: automated and custom insights.
With automated insights, unusual changes and emerging trends in your data are automatically reported. With custom insights, you can create conditions that detect changes in the data that are important to you. We’ll discuss this in more detail later.
In our example, we have a total of 8 available insights and the ones we are most concerned about are the number of users and transactions that spiked on the same day.
While it’s important to implement anomaly detection in Google Analytics 4, your analysis should not stop there. You should also figure out why those anomalies showed up.
In our example, what could be the reason why the number of users and transactions both spiked on the same day? Maybe you launched a campaign and it turned out to be super successful. You could then grasp this opportunity to engage even more people.
While we’re focusing on only some insights, you should also look at the other insights and try to determine why those peaks, changes, or trends in your data occurred.
For example, organic search appeared in 72.96% of your conversion paths for November 2022. Is this higher or lower than the previous month? Did you take any measures to improve this value? Could this change be attributed to those measures? Were they effective?
If you seek the answers to these types of questions and find the reasons behind those anomalies, you can gain valuable insights for your business. You can then improve your business strategy and generate even more revenue as a result.
In a nutshell, looking at our insights is the first step for anomaly detection in Google Analytics 4. Google will automatically detect and report unusual changes in your data. However, what if you want to monitor changes to some data regardless if Google deems it as significant?
This is where custom insights come in.
How to Create Custom Insights
First, note that creating custom insights is not possible in the demo account. No matter where you look, you won’t find this option if you’re following along with the demo account. Therefore, let’s go to our business account’s report snapshot page.
Here, click on Create under Insights.
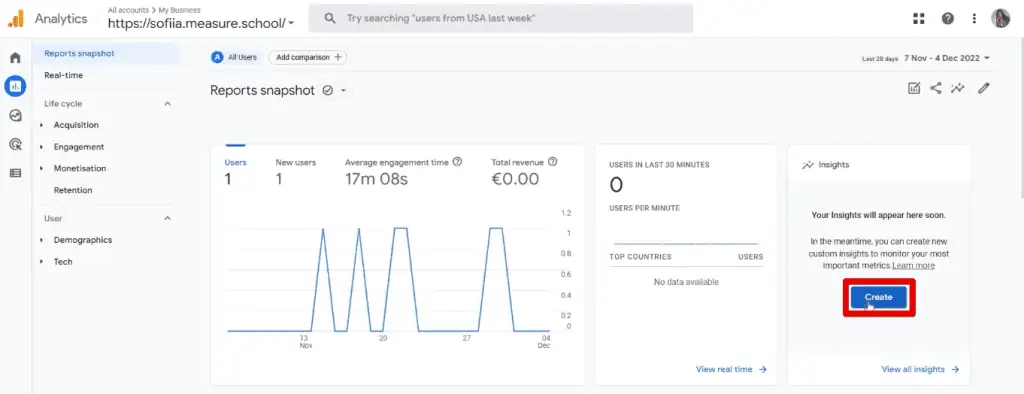
Clicking on this allows you to create your insights. You’ll quickly realize how much flexibility GA4 gives you.
You’ll first see a list of suggested custom insights. Notice that this can be another way of implementing anomaly detection in Google Analytics 4, as all of the suggestions are for anomalies in various daily metrics.
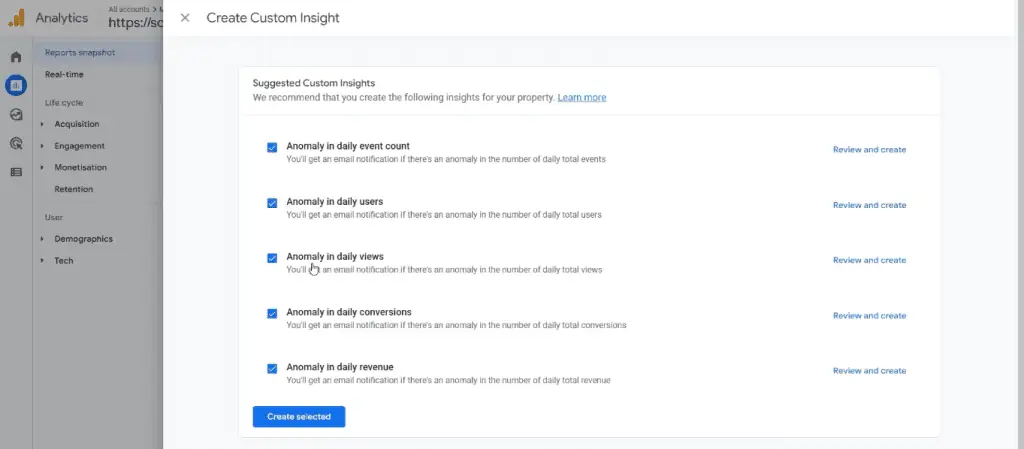
You can choose to add all of these suggestions at once or only select those you want to implement. What if you want to detect the same anomalies but at a different frequency?
Click on Review and create beside any of the suggestions.

Here, you can change the evaluation frequency, specify which segments to gather data from, or alter the metric and condition of this custom insight.

These suggestions are great to use right off the bat or as templates. But for this tutorial, we’ll be starting from scratch. So, exit from the custom insight editing window.
1. Scroll to the bottom and click on Create new under the Start From Scratch section.

Notice that you’ll be directed to a similar-looking window, except the metric and condition are not filled in. What are the conditions we could set for custom insights?
Starting with the evaluation frequency, we could choose between monthly, weekly, and daily for both web and app events. We could also set up an hourly frequency for web events only. Why is it not available for app events?
If we look at the Analytics Insights documentation, we are given a detailed explanation of why hourly custom insights are not available for app events.

In summary, Analytics experiences some delays in receiving app events. To prevent inaccuracies in your report, Google made hourly custom insights unavailable.
Until further developments occur to solve these delays, hourly insights for app events will remain unavailable. However, if you are interested in accepting possible inaccuracies, complete the form linked on the Analytics help page.
For this tutorial, let’s retain the daily frequency. Next, we could use the data from all users or look at a specific subset by defining a custom segment.
2. Let’s proceed to Change the segment.

Here, you can choose what dimension to use for your segment. This could be based on user demographics, geography, device, or platform used.
3. Let’s select Country for the dimension, then Poland for the dimension value. Next, click OK.

4. If you want to be more specific, you can drill it down further by clicking on Add new condition.

5. Let’s say we want to select users who are using Windows as their Operating system. Finally, click Apply to save the custom segment.

Great! That’s how you create segments for the specific users you would like to look at.
For now, let’s keep the All Users segment and move on to the metric we will use for this custom insight. You can choose any metric from the list.
6. Select User engagement. Next, we’ll specify the condition. For this guide, select the Has anomaly option.

Notice you could go a step further and customize the condition even more by choosing any of the other options available.
You could provide a threshold value and Analytics will notify you if the current value is less than or greater than that value. There is also the option to be notified when a certain percent increase, decrease, or a general change to the previous value has been reached.
7. The next step would be to provide a name for your custom insight.

It’s a good idea to provide a descriptive name that can be readily understood, especially if many people are working on this project. This should also be the case if you’re working with multiple custom insights so that you’ll easily understand what aspect each insight is about.
🚨 Note: You can create up to 50 custom insights per property.
8. Next, we also have the option to send notifications to certain users when this insight is triggered.

Just type in the email addresses of the users you want to be notified when the insight gets triggered, and separate each with a comma.
🚨 Note: You can only send email notifications to users who have access to this property.
Great! This is how you can create custom insights for anomaly detection in Google Analytics 4. You will now be able to see anomalies in your standard reports.
Now, let’s go a step further and go to the exploration section to identify the reason(s) behind those anomalies.
Anomaly Detection in Google Analytics 4 Explore Section
Let’s quickly go back to the demo account since there are data there, and create an exploration report.
1. Click on Explore.

2. From here, we’ll select the Free-form exploration report.

If the report is already populated with data, clear these values by clicking on the ✖ button for the data under the rows, columns, and values section.

3. Select Line chart for the visualization type.

Here, you’ll see a line chart of the number of active users per day, and an expected value line with a highlighted range of acceptable values.

Notice that we have a spike in our data and the peak value has a circle. This is how you can implement anomaly detection in Google Analytics 4 exploration reports.
If we hover over or click on the point where there is a dramatic spike in users, we could see the numbers for the expected, actual, and percent change in value.

Now, we can manage our anomaly detection in a dedicated section at the left. There are two main settings we can tweak in this section: the training period and sensitivity.
4. Let’s start with the Training period.

The training period refers to the number of days before the selected date range used to calculate the expected value of the metric display. Changes to this setting will affect how the white expected value line is formed.
5. Next, let’s see how changes to the Sensitivity affects our chart.

This one sets the probability threshold below which anomalous data will be reported. The higher the sensitivity, the more outliers you will have.
To illustrate, let’s set the sensitivity to high. You’ll notice multiple additional points. Aside from spikes, dips in data also get detected.

While it’s important to capture as many anomalies as you can, let’s go back and set the sensitivity to be somewhere in the middle. We need to find the golden mean.
“Virtue is the golden mean between two vices, the one of excess and the other of deficiency.” Do you know who said this famous quote?
Anyways, getting back to our topic, this is how you can work with anomalies in the exploration report. However, this is not all that you can do with explorations.
How to Use Breakdowns to Better Understand Your Data
So, we can see that there is a considerable spike in our active users, but what can we do about that? How can we work with it? How can we understand what caused this problem?
To gain some insights, we could look at where these users came from and how they arrived at our website or application. Since this dimension is not immediately available, let’s add it to our exploration report.
1. Click on + beside the dimensions.

2. Search for Session source/medium, select it, then click Import.

3. Add this dimension to the breakdowns section.

💡 Top Tip: There are two ways to add a dimension or metric to your report. You can either drag and drop or double-click them.
If you want to dive deeper and drill down into your data, then this is where breakdowns come into play.
If we look at our data, we can see that most of the lines either trend similarly or are near constant in value. The cause of our anomaly seems to be because of a specific source.
Let’s hover over or click on the data point again to see the details of how the session source/medium dimension affected our data.

We can see here that our anomaly was caused by our newsletter source. It appears that our newsletter was extremely efficient in reaching many users and bringing people to our website/app.
Luckily, this is not an issue at all. It’s a very good anomaly to have.
This is exactly when you could grasp the opportunity to boost your traffic and subsequent sales. You could analyze what made this newsletter so effective so that you could replicate its success.
You could also take it a step further and turn this situation into a business decision. Ask yourself – how can you improve this newsletter and make it even better? Should you do more of it because it seems to engage more users?
So, you could see that breakdowns are a helpful tool for you to dive deeper into your data and find specific answers to your questions.
FAQ
How can I check anomalies with Google Analytics 4?
You can check anomalies using the Insights feature. Insights automatically detects unusual changes and emerging trends in your data. By accessing the Insights pane, you can view the detected anomalies and investigate further to understand the reasons behind them.
Can I create custom insights for anomaly detection in Google Analytics 4?
Yes, you can create custom insights in Google Analytics 4. Custom insights allow you to define specific conditions to detect changes in your data that are important to your business. You can set up custom insights based on metrics, segments, evaluation frequency, and more.
How can breakdowns help in understanding anomalies in Google Analytics 4?
Breakdowns in Google Analytics 4 allow you to analyze data by different dimensions, providing deeper insights into the causes of anomalies. By adding breakdowns, such as session source/medium, to your exploration reports, you can identify specific sources or factors that contribute to anomalies and gain a better understanding of their impact on your data.
Summary
To recap, implementing anomaly detection in Google Analytics 4 can be done in two main ways. You could use insights in your standard reports, or go further and look at the data in the explorations section.
Here, you could tweak how the range of expected values is computed by changing the training period and sensitivity settings. You could also use breakdowns to drill down onto your data.
For this tutorial, we focused on detecting unusual traffic patterns, but you can also utilize anomaly detection in Google Analytics 4 to identify unexpected spikes or dips in website performance and more.
Hopefully, you won’t have any issues, just opportunities to grasp. If you do encounter some issues on your website/application, then our guide on how to track, find, and fix 404 errors in GA4 might help you out.
Which method of detecting anomalies do you prefer? What kinds of custom insights will you make? Let us know in the comments below!


")