
Last Modified on January 7, 2025
Are you interested in creating a custom funnel in Google Analytics 4?
Last May, Google Analytics 4 introduced the new user purchase report, as part of the standard reports. It shows how many users drop off between each step in your purchase funnel.
As all standard reports go, it provides insights into your data upon installing GA4 on your website. While it is great to have, especially for those who own eCommerce stores, you can’t change the steps in the funnel.
Since funnel reports can help identify steps in the funnel that need improvement, the same update now allows users to create custom funnel reports. With the flexibility to create custom funnels catered to your business needs, you can gain insights into reducing inefficient journeys.
Learn how to create your custom funnel in Google Analytics 4 and adjust funnel settings to get valuable insights into your customers’ shopping behavior. We’ll also show you how to add your custom funnel to the Standard Reports for easy access and analysis.
Here is an overview of what we’ll cover:
- What is a Funnel?
- User Purchase Journey Report
- Creating a Custom Funnel in Google Analytics 4
- Funnel Exploration Settings
- Adding Custom Funnels to Standard Reports
Let’s dive in!
What is a Funnel?
First, let’s define what is a funnel.
Funnels let you visualize the steps your website visitors take to complete a task, e.g., on the way to purchase. Why is it so important? It helps you to identify the weak points and where you can focus attention for website improvement.
For example, many users drop off at the add-to-cart step. A mitigating solution could be adding testimonials, social proof, and product images.

We should remove all the bugs and glitches and make our websites mobile responsive. Funnels come to the rescue because they can help support mitigating these weaknesses.
For this tutorial, we’ll mostly work with the demo account. We encourage you to use it as a training ground for testing and exploring new features.

Before we start, we’ll show you the newly introduced report in GA4.
Go to Reports.

Next, under Monetization, select the User purchase journey.

User Purchase Journey Report
The user purchase journey report shows how many users drop between each step in your purchase funnel.

The report includes the following steps and triggered events:
- Session start – session_start
- View product – view_item
- Add to cart – add_to_cart
- Begin checkout – begin_checkout
- Purchase – purchase or in_app_purchase
These steps are based on the eCommerce events implemented on your website.
💡 Top Tip: Check out our guide on How to Set Up Google Analytics 4 eCommerce Tracking if you need help implementing eCommerce events on your website.
If we scroll down, we can also see this table present in all standard reports. It shows the breakdown of each step by device category.

You can also change the breakdown dimension shown in the table. Below the search button, click the Device category.

This opens a list of all dimensions you can use in the table. Let’s say we want to break down the steps by Country. Select this from the list.

Here is the updated table below.

Unfortunately, at the time of writing, we can’t modify the funnel steps.
If we want to make changes, we should create a custom funnel in Google Analytics 4.
🚨 Note: Check out our guide to the GA4 Checkout Journey Report.
Creating a Custom Funnel in Google Analytics 4
Creating a custom funnel in Google Analytics 4 is possible with the help of explorations.
1. Go to the explorations section by clicking Explore.

The explorations section is where you can build your custom report.
2. Let’s start from scratch by selecting the Blank option.

3. First, let’s go to the technique section.

By default, we have the free-form exploration selected.
4. Since we want to create a funnel, select Funnel Exploration.

So, the backbone of any funnel is defining the steps. Below is the live eCommerce store connected to our demo account.

We want to define the sales funnel because this is an eCommerce store.
For example, we want to buy a specific product. Click on it to open the product page.

Input a quantity and click Add to Cart.

Next, let’s view our cart by clicking Go to Shopping Cart.

As we view the contents of our cart, you can see that the URL changes. We have this basket.html added to the link.

Since we already know the steps in the funnel (having made online purchases), we don’t need to make a test purchase.
Go back to GA4 and define the steps in our funnel exploration report. Click the edit icon beside the steps section.

The beauty of GA4 is that you can define any step you want. Remember that everything is an event in GA4, giving us so much flexibility and a significant advantage over Universal Analytics.
Funnel Exploration Settings for eCommerce
We’ll use the add-to-cart event as the first step of our custom funnel in Google Analytics 4.
Remember that we observed a URL change when we viewed the cart earlier. Therefore, we will base our matching condition on the user’s page location.
🚨 Note: You can base the conditions on events your users trigger or the event parameters describing the event.
1. Search and select page_location.

💡 Top Tip: If you’ve created custom events in GA4, don’t forget to set up custom dimensions to see your custom event parameters.
2. Next, we’ll add the filter. Click Add Filter.

3. Specify the condition: contains basket.html (based on previous test) and click Apply.

4. Finally, name the funnel step. To create the next step, click Add step.

5. We can see the number of users and events detected at the current funnel step on the right.

6. The second step is where users add their information. Name it Info and specify the condition: page_location contains yourinfo.html.

7. Notice the number of users and events drop.

8. Finally, add the last three steps of the funnel: Payment, Order Review, and Order Completed.

9. We have observed 71 users who completed all the steps in the funnel.

Additional Step Configuration Settings
Before we visualize the steps as a chart, let’s look at additional settings you can configure for the funnel steps.
10. First, we can select if the next step directly or indirectly follows the previous step.

Let’s say that the users click elsewhere on the way to the next step. If we select the directly followed by option, they will not be counted in the latter portion of the funnel even if they completed all the steps afterward.
We’ll select the indirectly followed by option so that users don’t have to follow the steps strictly. Let’s give our users some freedom and flexibility.
11. Next, we have the time constraint settings.

You can specify the condition here. The time can be within seconds, minutes, hours, or days.
12. We won’t apply a time constraint, so click Apply to finalize the step configuration.

Voila! Here is our beautiful custom funnel in Google Analytics 4.

Now we can start collecting insights, but we’d like to show you a few more things.
Visualization Method & Open Funnels
We can also select the visualization method.

We have the standard funnel, but what will happen if we change it to trended funnel?
Instead of having a column chart, we have a line chart of the number of users against the date, with each funnel step as a different color.

We can analyze the steps simultaneously in the All section or look at a specific one.
For example, let’s look at Cart.

Let’s change back to the standard funnel.
Next, we can also make the funnel open. Toggle the Make Open Funnel option.

What does it mean to have an open funnel? Users can enter at any point and start with any step.
For example, if we hover over the number of users in the second step, we can see the number of continuing and new funnel entries.
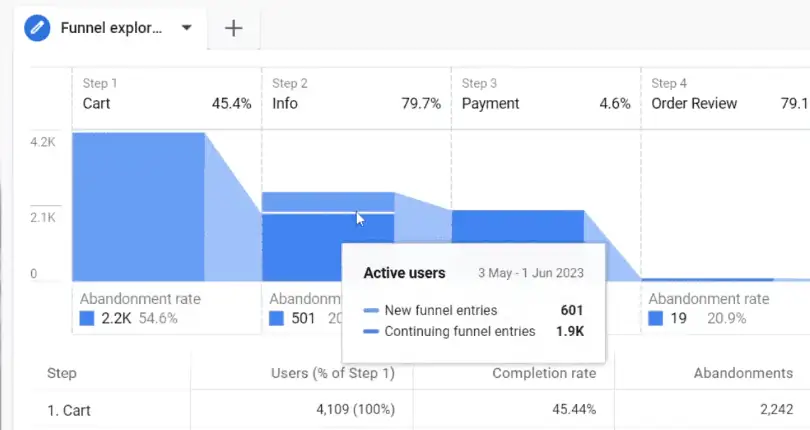
Let’s not make the funnel open.
Segment Comparisons & Breakdown
Next, we can also work with segments to look at subsets of data. Once you have created one, drag it to the Segment Comparisons section.

Below are the steps we have defined. Next, we can also add a breakdown. To do this, we first have to import dimensions to our report. Click + beside the dimension header.

Let’s say we want to use the browser dimension as a breakdown. Search and select Browser.

Next, click Import.

Finally, drag and drop the Browser dimension to the breakdown section.

Here is the updated table with the breakdown of each step by browser.

Now you can see the browsers, and you can perform your analysis. Let’s remove this breakdown for now.
Elapsed Time & Next Actions
We also have something called Show Elapsed Time.

When activated, it shows how long website visitors process from one step to another.

According to the documentation, this toggle will show the average time elapsed between funnel steps. However, we’re not quite sure if this number is reliable because it seems to be a sum of time. Despite this, it would still be great to have this data available.
Then, we also have the Next Action.

You can add the user actions that follow each funnel step here. We can only add the event name or page screen as a dimension.
First, let’s add the Event name dimension to the report.

After adding the event name to the next action section, we will see the Top 5 Next Actions when we hover the mouse over each step.

This additional insight may be valuable for your analysis, so add it in if this is relevant to you.
Adding Filters
Finally, we have Filters.

Let’s say we want to only look at the data for users coming from Canada. How can we do it?
First, add the Country dimension to the report.

Now, go to the filters section and click the box. Next, select Country.

Next, specify the condition: Country exactly matches Canada. Click Apply.

Now we’re looking at the funnel showing only the data from users from Canada.

Those are the steps to filter your data for the custom funnel in Google Analytics 4.
Saving as a Report
When using the demo account, we don’t have permission to modify the report. We’ll move to another account with less data to show how to use the next feature. Try to imagine that we have configured the same funnel we have just created.
At the top of the funnel, there is an icon. It allows us to save our custom funnel as a report in the library, which is pretty cool!

Let’s provide a name and description for the report. Next, click Save.

So, we have successfully saved the exploration to the library.

Go to the reports and look under monetization. However, our custom report is not there.
Adding Custom Funnels to Standard Reports
To add a custom funnel in Google Analytics 4 reports, go to the Library. It is insufficient to create a report.

Here, we need to add the report to a collection.
We can see the custom funnel in the reports section below. It’s on the list, but we should add it to the library. Go to the life cycle collection and click Edit collection.

Look for our custom report. Then, click and drag it under the Monetization section.

Finally, click Save → Save changes to the current collection.

Now, let’s have a look together.
💡 Top Tip: For a more detailed overview of editing your report library, check out our guide on How to Customize Your Google Analytics 4 Reports.
Go to the reports again, and under monetization, we should see our custom funnel.

Here is the custom funnel in Google Analytics 4 reports.

Summary
Great! To recap, we discussed what funnels are, looked at the new user purchase journey report, created a custom funnel in Google Analytics 4, and explored the various settings we can tweak in the explorations section.
We also added the custom funnel to our collection of standard reports, which is interesting. Note that this feature is only available for funnels as of the time of writing.
Do you want to track specific user actions on your website that standard events cannot capture? Check out our guide on How to Set Up GA4 Custom Events Using GTM.
Have you used the user purchase report? What steps will you use for your funnel? Let us know in the comments below!


")