
Last Modified on November 6, 2024
There are only two reasons why you are reading this post on the Google Analytics 4 demo account:
- You are an experienced marketer, but you need access to data or data to analyze the accounts of your property or your client’s property. You also want to fill the missing knowledge gaps about the data offered by Google Analytics 4.
- You are new to Google Analytics 4, and you don’t know what it is or what it will give to your business.
In both cases, this article is for you. Here’s what we’ll cover:

Master the basics with our FREE GA4 Course for Beginners
- What is the Google Analytics 4 Demo Account For?
- What Account Types and Data Sources are Available for Testing?
- How to Get Access to a Google Analytics 4 Demo Account?
- What Reports in Google Analytics 4 Demo Account Should You Pay Attention To?
- Limitations of the GA4 Demo Account
- Putting the Demo Account into Practice
What is the Google Analytics 4 Demo Account For?
The Demo Account is for everyone to consolidate their knowledge in practice for showing functions and reports to your clients by example.
The main benefit of a Google Analytics 4 demo account is that it offers access to a diverse range of data sets you might not currently possess.
To illustrate this advantage, consider the scenario where you currently lack app data but envision developing an app soon. Even though you may not have app data, it would be invaluable to gain insights into how that data will appear in GA4.
This foresight allows you to be well-prepared when you eventually acquire app data.
What Account Types and Data Sources are Available for Testing?
To illustrate, we have access to two different demo accounts:
The first demo account includes the data of a working online store, the Google official merchandise store, with actual data from the store. It provides insights about where website traffic is coming from, user behavior on the site, and transaction data.

The second source is a cross-platform demo account with 3 data streams. It extracts data from the Flood-It! app, a captivating strategy puzzle game available for Android and iOS.
To optimize your gaming experience, a dedicated Google Analytics 4 property for Flood-It! collects valuable data from both the app and website.

This GA4 property provides crucial insights through calculated metrics like Average revenue per active user and Average engagement time. It tracks events such as level completion and level resets and captures eCommerce data for in-app purchases.
By utilizing the Flood-It! Google Analytics 4 demo account, you can access a wide range of information, make data-driven decisions, and enhance your game’s performance.
You’ll get an example of the correct settings in GA4 and the opportunity to practice on this account. You can get only reading and analysis permissions. It means you can view all settings without making changes and manage statistics.
All users of the Google Analytics 4 demo account have view access. You can view report data, add segments, use filters, and create custom reports.
How to Get Access to a Google Analytics 4 Demo Account?
You can install the Google Analytics 4 demo account on your existing account or create a new one.
If you are already a Universal demo account user, you don’t need to do anything – you already have GA4 properties here.

If you already have an account, choose a demo account in the GA4 demo account documentation.

What Reports in Google Analytics 4 Demo Account Should You Pay Attention To?
We recommend paying attention to four things within Google’s demo account and seeing what values we can get from them.
Conversions Set Up in Google Analytics 4 Demo Account
By analyzing a merchandise store account, we can conclude what conversion is essential for online stores. How is a conversion event considered crucial, and what does Google track?
For example, in addition to standard eCommerce events, we can see custom conversion predicted_top_spenders.

This custom event is based on audience analysis and created audience trigger.

Events, Custom Events, and Modifications
Among the list of standard events important for eCommerce funnel tracking, such as view_item, add_to_cart, etc., we can also see many custom events based on user behavior or user demographic data.
For example, we can highlight such events as android_lovers or san_francisco_users, campus_collection_user, etc. Some of the ideas can be adopted and applied to your data.

It is also possible to find ideas for creating new events directly from Google Analytics accounts based on existing events.
Using parameter values like the example below, you can create an event from purchasers who spend more than $X.

Audiences and Audience Triggers
We can see the audiences under Admin > Audiences. As of the writing of this post (July 2023), we see over 30 Audiences have Google Merchant Center property and 18 – in Flood-It!
If we have an online store and use the example of created audiences, we can make a structure and a list of the audiences based on our business and goals that might interest us.
For instance, it can be an audience based on the user’s behavior on the site.
Audience 1. Users who saw a product but have yet to make a purchase.

We can create a list of audiences based on the source of traffic or/and demographic data to segment people who came exclusively from some source, for example, advertising or search.
Audience 2. Organic Search Audience

Audience Triggers
Audience triggers allow you to fire an event when a user matching the definition joins the audience.
You can trigger an event if the user has reached a particular milestone, such as initiating the required number of sessions, viewing the necessary articles, or passing the conversion threshold.
In the case below, the trigger activates when the user joins the audience with a more than 95% predicted revenue.
Predicted revenue is expected from all purchase conversions within the next 28 days from an active user in the last 28 days.

🚨 Note: Check out this definitive guide to learn more about Audiences in GA4.
Custom Definitions and Metrics
In Google Analytics 4, you can create custom metrics that will help expand the standard set of counter parameters and indicators. They are called custom definitions.
Custom parameters and metrics in GA4 allow you to learn more about the tracked object and better describe it. They are transmitted with the event you are monitoring at a specific moment.
The Google Analytics 4 demo account presents some popular variants of additional parameters that can be monitored.

💡 Top Tip: If you pass a set of additional event parameters with any event, then to see statistics on them in GA4 reports, you must create custom definitions or metrics for them. Otherwise, you will not see the monitored parameters’ data in the event report.
For example, you need to create a custom definition with the serch_term parameter to track search terms within the site.

Limitations of the GA4 Demo Account
The main limitation of the Google Analytics 4 demo account is the inability to configure new conversions, add new custom dimensions, and access the user explorer report, restricting some advanced customization and analysis capabilities.
However, we have access to Exploration reports, which can help us build comprehensive reports and practice on actual data.

Another limitation is that you cannot use the demo account with the Analytics Reporting API for either property type.
Putting the Demo Account into Practice
The best way to get value from the demo account is to analyze data and find answers to questions.
So, let’s go deeper into reports by working with some samples. Open a Google Merch Shop account and choose a date range of 1 June 2021 – 30 June 2023.
Next, try to accomplish the following tasks:
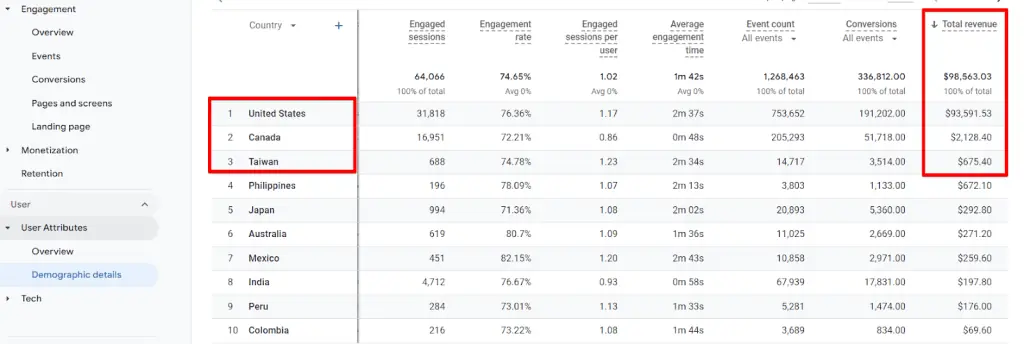
- Find the top 3 countries whose users bring the most revenue for the given period
- What is a customer’s average LTV (lifetime value) on Day 27?
- This task is for Flood-It! demo account. What is the ARPPU (average revenue per paying user) over the same date range?
Did you manage it? Check yourself.
Answer 1: United States, Canada, and Taiwan.
The easiest way is to open demographic details and filter the column with total revenue.
Answer 2: $1.33
To find this information click on Retention report > Overview > Lifetime value.

Answer 3: $4.09
One possible method of finding this information is by clicking on the Games reporting > Monetization.

Summary
This short intro to the Google Analytics 4 demo account helped you fill your knowledge gaps or meet with comprehensive data on conversions, events, audiences, and custom metrics.
Embrace data and hints used by Google to elevate your strategies and gain valuable insights for your business.
Are you still looking to understand and trust your tracking, analytics, and data? Join our analytics school now.
What other ways are there to see the data and answer these questions? Let us know in the comments.
Master the basics with our FREE GA4 Course for Beginners


")