
Last Modified on February 14, 2025
With so many different marketing channels and activities in today’s digital world, it’s very important to know which channel can bring you conversions.
This is where attribution helps by giving credit to the appropriate channels so you don’t burn your money and time on sources that aren’t performing well.
There are three different Google Analytics 4 attribution models. Which channel or ads are bringing in visitors who convert to your website depends on the model you select.
In this post, we’ll take a deep dive into these attribution models by learning about the following areas:
- Attribution in GA4
- What are Touchpoints and Conversion Paths?
- Google Analytics 4 Attribution Models
- Universal Analytics vs Google Analytics 4 Attribution Models
- Model Comparison and Conversion Differences
- Changing Attribution Settings in GA4
- Attribution Models for GA4 Imported Conversions
- Attribution Model for App Conversions
- Attribution Models Used in GA4 Standard Reports
- Attribution for Traffic from Google Ads and Organic Search
- Challenges in Attribution and Fixes
Let’s dive into the sea of Google Analytics 4 attribution models!
Attribution in GA4
Attribution in GA4 means attribution of traffic acquisition and conversions to the correct marketing channels so you can measure their performance.
It helps to understand which touchpoints in the conversion path play an important role, so you’re not playing a guessing game and can give credit to the right sources.
Let’s take an example of what a conversion path for someone who converts on the measureschool.com website looks like.
- A user searches on Google about ‘how to set up e-commerce tracking in GA4’ and clicks on our blog post about it.
- Comes back to the same blog the next day and goes to our YouTube channel from that blog.
- After a few more days, the user visits our website directly and joins the MeasureMasters program because they realize they can learn better that way.
This is a conversion path with 3 sources, Google’s organic search, the YouTube video, and the direct visit.
So which one should get the credit for conversion? Organic search because that’s where it all started? Or maybe the YouTube video convinced the user that they should sign up with us?
Perhaps, the direct source because that’s when they took the final decision? Why not all three because they all played some role?
Well, that’s precisely where the attribution models kick in. We’ll discuss different Google Analytics 4 attribution models after we have looked at touch points and conversion paths.
What are Touchpoints and Conversion Paths?
Touchpoints in any attribution model are interactions a user has with a business during their journey, generally ending with a conversion action aka key event, e.g., purchase, lead submission, etc.
This means a user can have multiple interactions across different channels before reaching their final destination which can include both online and offline. Following are some examples:
- Social media interactions, e.g., likes, shares, viewing an ad, etc.
- Website visits, e.g., landing page, home page, product page, blogs, etc.
- Emails, e.g., opens, clicks, etc.
- Paid ads, e.g., search, display, social, etc.
- Referrals, e.g., other websites, blogs, etc.
- Search engine interactions, e.g., a user coming through organic search listings (SEO)
- Customer service interactions, e.g., chats, emails, calls, etc.
- Physical store visits (offline)
In the context of GA4, we would only look at online touchpoints, and as you might have guessed, this isn’t a complete list as there could be many other touchpoints depending on where a user can interact with the brand.
They are important because each of these interactions can impact how a user perceives the brand. But how do they fit into conversion paths?
A conversion path is a sequence of touchpoints a user goes through before they complete a key event action.
This path is significant because it shows which touchpoints may have played a higher role in helping to convert the user.
So based on their role in converting users, these touchpoints in a conversion path are given a quantitative credit. But the credit is given based on the selected attribution model, so it will vary.
Understanding what role different touchpoints in conversion paths can play in converting users can help digital marketers direct their resources to channels that work well and optimize the overall customer journey.
Google Analytics 4 Attribution Models
Attribution models are based on a single rule, a set of defined rules, or an algorithm that decides which touchpoints should get the credit for conversions.
This means each model will have different results for the same conversion path. There can be not only multiple touchpoints but also the order of converting through those sources can be quite different for every user.
Having a set attribution model makes it easier to understand what sources will be getting the credit for conversions and this could be based on your business model and/or other factors.
You can view these conversion paths in your Google Analytics 4 account under the Advertising → Attribution → Conversion Paths report.
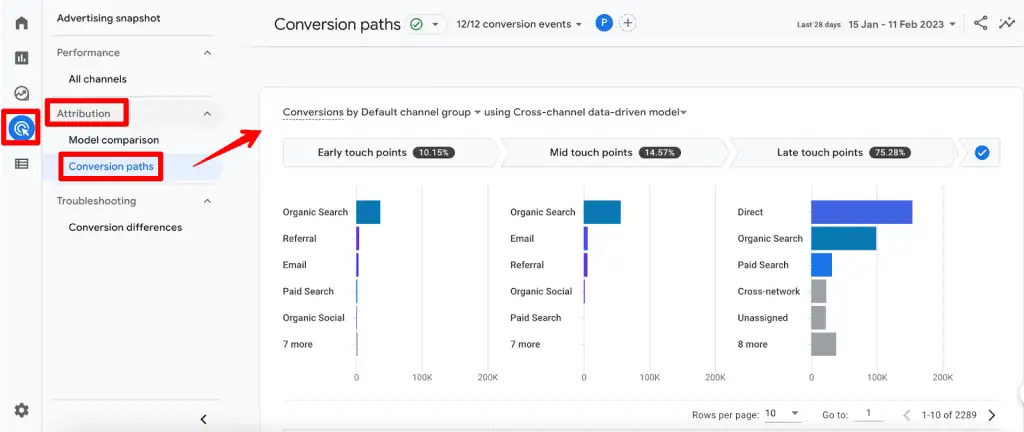
The screenshot above shows the conversion path based on a data-driven attribution model – you can select the type of model and the results will be quite different.
So how many Google Analytics 4 attribution models are there and what are their effects?
Well, GA4 has three types of attributions based on either an algorithm or rules.
| Models | Basis | Rules |
| Data-driven | Algorithm | – |
| Cross-channel rule-based | Rules | Linear Position-based Time decay First click Last click |
| Ads Preferred | Rules | Last click |
🚨Note: Direct visits are not credited with conversions in all attribution models unless the conversion path consists only of direct visits.
So if you choose the Last click model in the above Conversion path report, the results would look like this:
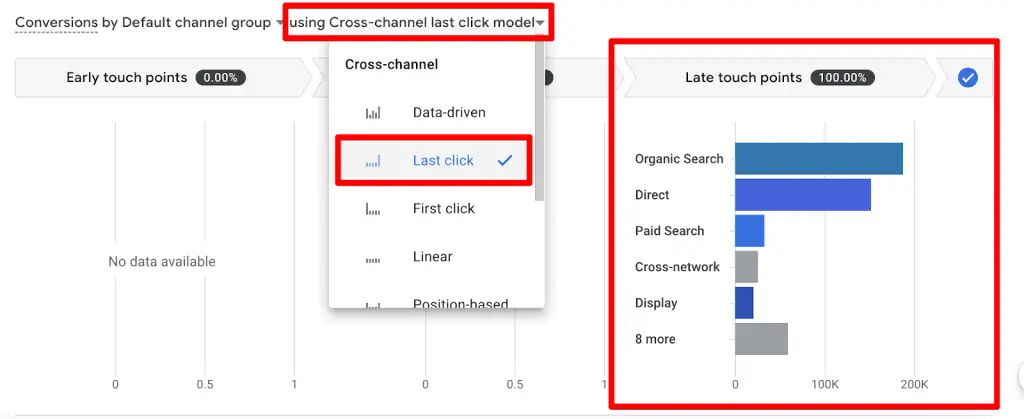
Let’s discuss these attribution models and see how they can affect your conversion numbers.
Data-driven Attribution (DDA)
This attribution model is selected by default in GA4 and compared to the other models, it makes use of an algorithm to give credit to different touch points.
The algorithm takes into account historic data from your account in terms of different touch points and combines it with AI modeling to give credit to each channel.
There are some other important points to understand about this model, which are:
- The model considers factors like device types, how many ad interactions users had, ad exposure order, the type of creative assets, and even the time from conversion.
- It uses a counterfactual approach in terms of what could have happened vs what happened, to determine which touchpoints are most likely to drive conversions and then gives credit based on this probability to convert.
- Compared to the DDA model in UA which looked at the last 4 touchpoints, this model can look up to a lot more data, i.e., more than 50 touchpoints, to give as much credit to deserving channels as possible.
- All of this makes it quite difficult to understand what goes under the hood of its algorithm compared to other models.
🚨Note: Every data-driven attribution model will have its data specific to the account whose data is being used.
This is what a conversion path would be like under this model:
Small changes in dates and/or conversions can change the percentages shown in front of the touchpoints but as mentioned above, the model tries to give credit to deserving sources.
🚨Note: The data-driven Google Analytics 4 attribution model was introduced on November 1, 2021, so if you select any previous dates as the start date, then you won’t see the complete data.
Cross-channel Rule-based Models
To be clear, the DDA model is also a cross-channel one but based on an algorithm, while this model is based on five different rules.
Understandably, depending on the rule you choose, the model will give you different results. Let’s have a look at what these rules are and how they attribute conversions to your channels.
- Linear
- Position-based
- Time decay
- First click
- Last click
🚨Note: The following attribution models have been depreciated: first click, linear, time decay, and position-based. They are no longer available in GA4 properties.
Linear
This rule gives credit to all the touchpoints in the conversion path equally excluding the direct visits, unless they are the only conversion source.
So, taking the example of the above conversion path, the linear rule will give credit like this:
Google search (50%) → YouTube video (50%) → Direct visit (0%)
Even if we reverse the order, the direct visit won’t get any credit while the other two will get 50% each unless it’s all direct visits.
This is how it would like in the conversion paths report in GA4:

On paper, it does seem fair to give credit to all of the touchpoints equally, but the problem is what if one of the channels influenced the decision more vs the other like the YouTube video was more convincing than the original blog post? That’s the only caveat with this rule.
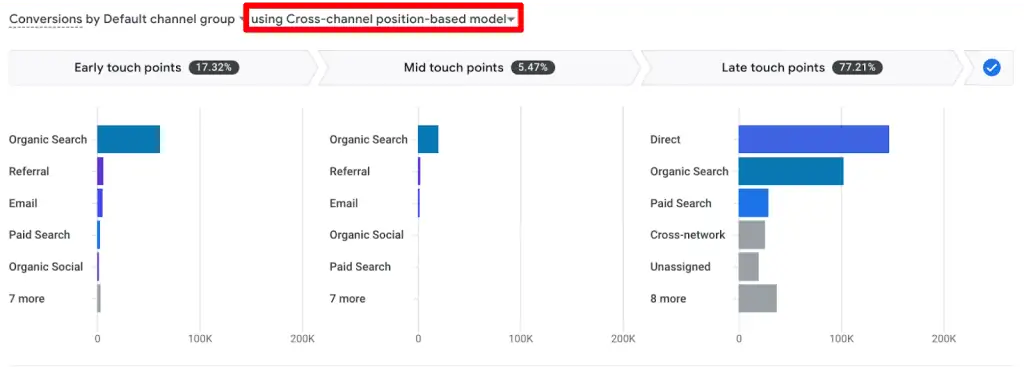
Position-based
This rule tries to spread the credit based on the logic that the first and last touchpoints do the most work compared to the middle touchpoints.
So, the first and last touchpoints get 40% of the credit each, whereas the middle ones get 20% evenly distributed between them – again, excluding any direct visits.
Let’s take the same example and add Social as another channel for understanding how it would credit different channels:
Google search (40%) → Social (20%) → YouTube video (40%) → Direct visit (0%)
This is how this rule-based model looks like in GA4:
Whether this is fair or not also depends on the general conversion path your converters take, and/or if you spend a lot more resources to acquire the visitors (first touchpoint), and then try to convert them (last touchpoint).
Time Decay
This cross-channel rule gives credit to the source that is nearest to the conversion, so older ones don’t get as much attribution.
It does get a little complicated because credit is given based on a 7-day half-life. This means any click 8 days before a conversion only gets half credit compared to the click 1 day before the conversion.
This can be seen in the conversion paths report for this model in GA4 as well:
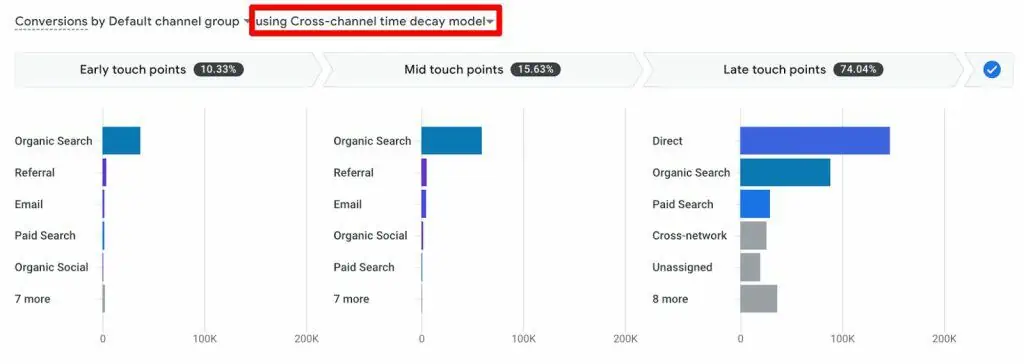
This model can make sense if you have a long conversion cycle where the first touchpoint loses its effectiveness quickly. Just a quick reminder, the direct source still doesn’t get the credit unless it’s the only touchpoint all along.
First Click
As the name suggests, this rule makes things quite simple and runs with the logic that the first click or YouTube (engaged view) contributes the most to the conversion because it is the touchpoint that brings the users to your website.
So, attribution for our example would look like this:
Google search (100%) → YouTube video (0%) → Direct visit (0%)
Understandably, the conversion path reports in GA4 show all conversions attributed to the first touchpoints:
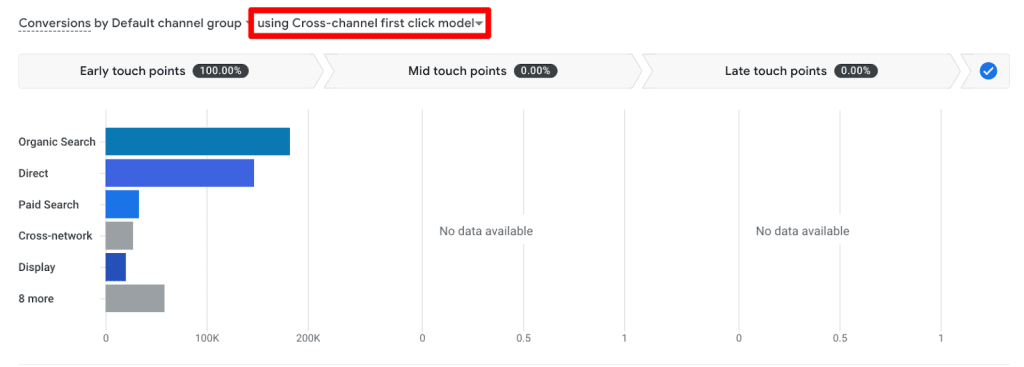
The first-click model might be better for reach or brand awareness campaigns that you might run. Still, in general, it might not be a good idea to discredit all the later touchpoints completely.
Last Click
This is the inverse of the first click model and is based on the logic that the last touchpoint (excluding directs) does the most work to move the needle.
Google search (0%) → YouTube video (100%) → Direct visit (0%)
This is also reflected in the conversion paths:
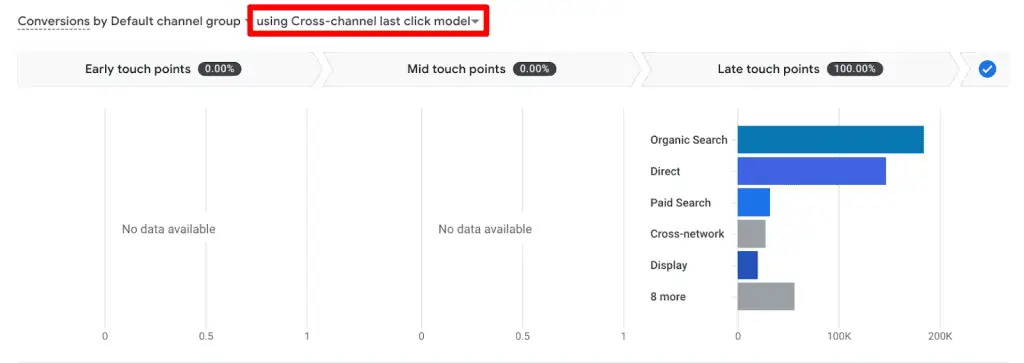
This could make more sense if you spend a lot more resources and effort on the last touchpoint. But, as with the first click, completely discrediting other touchpoints might not be a good idea.
Ads Preferred Last Click Model
This model is quite similar to the above-discussed last click but with one major difference.
It gives 100% credit to the last Google ads channel users clicked through before converting, regardless of whether it was an actual last touchpoint.
Attribution for our example with Paid search would look like this:
Google search (0%) → Paid Search (0%) → YouTube video (0%) → Paid Search (100%) → Direct visit (0%)
But, if there are no Google ads clicks in the conversion path, then it switches back to the cross-channel last click model above.
Google search (0%) → Paid Search (0%) → YouTube video (100%) → Direct visit (0%)
However, it would be difficult to see much difference in the conversion paths report if you use Default channel grouping. Therefore, for Google Ads, using Campaign as a dimension will give more context:
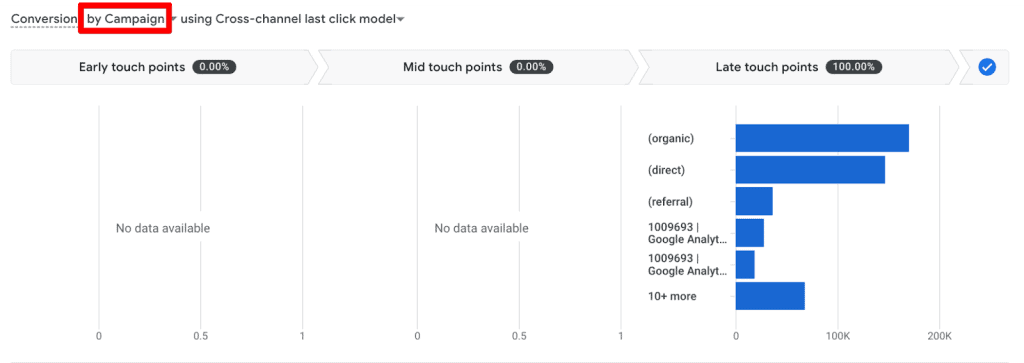
The only caveat here is that if you use this attribution setting, you get to see conversions for Google Ads.
So if you are advertising on other channels, then it won’t show data for that, making you think your other platforms are less effective.
🚨Note: Cross-channel rules-based Google Analytics 4 attribution models were introduced on June 14, 2021, so if you select any previous dates as the start date, then you won’t see complete data.
Universal Analytics vs Google Analytics 4 Attribution Models
In Universal Analytics (UA), the main attribution model is based on the last-non-direct click and data-driven attribution (DDA) was only available to GA 360 users.
Moreover, the DDA model in UA only considers 4 touchpoints compared to the 50+ touchpoints it can have in Google Analytics 4 Attribution models.
So the attribution credit would be much fairer even though you wouldn’t know what data points worked together to give attribute conversions.
GA4 allows you to select what type of attribution model you want to use, something that has been missing in UA, and attribution has mostly been a beta feature in UA.
Multi-Channel Funnels in UA are different from attribution. You can still compare different models and the effect they would have in UA.
The above-mentioned rule-based attribution models are also available in UA, but in GA4, they are more robust as they work on a cross-channel basis.
All in all, attribution got better with Google Analytics 4 attribution models and you can do a lot more compared to UA.
Model Comparison and Conversion Differences
Model comparison is a great way to see how these models will attribute conversions to different touchpoints before you go and change the attribution settings in GA4.
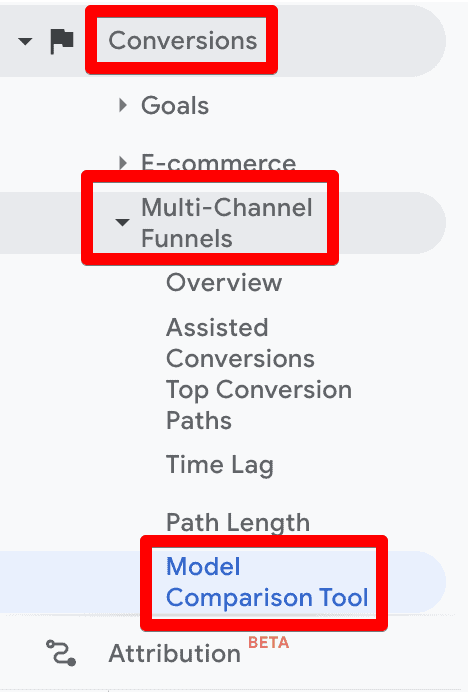
Model comparison isn’t an exclusive GA4 feature, but it’s a bit more tucked away in UA under the Conversions → Multi-Channel Funnels → Model Comparison Tool.
In GA4, you can find it under the Advertising → Attribution → Model Comparison.
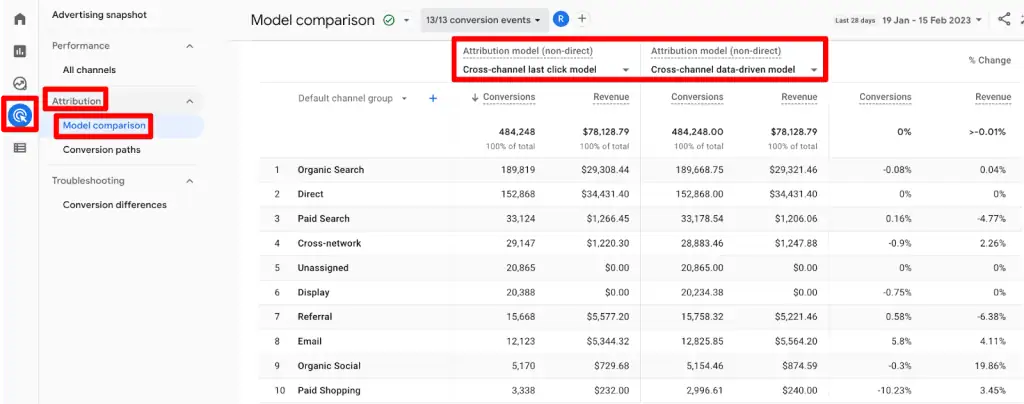
Notice how this report has already selected the Cross-channel last-click model to compare with the data-driven model. However, you can change them.
If you zoom in at the top of this report, you will see that it says 13/13 conversion events.
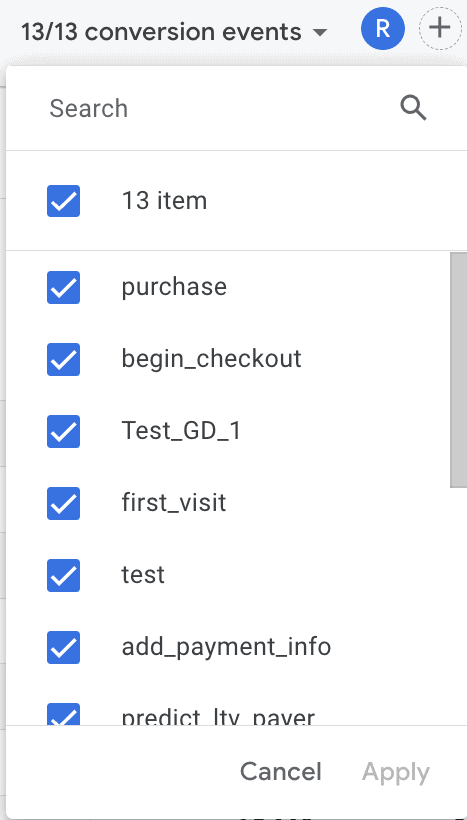
So by default, it selects all the conversion events which doesn’t make much sense. So, be sure to filter out the unnecessary ones, e.g., page_view. It’s fine if you only have one or two main conversion events.
If you move a little to the right next to the select conversion events, you will see a filter applied Reporting time = Conversion time, which includes all the events that result in a conversion within your selected date range.

Feel free to change the filter and/or apply any other one by clicking on the ‘+’ icon that would make more sense for your business model to get the most out of the comparison tool.
Let’s talk about the Conversion differences report that is exclusive to GA4. It’s currently not rolled out to every account, but can be seen in Google Merchandise Store’s GA4 account.
This report is also found in the same place as the model comparison but under the Troubleshooting section.

It compares the conversion differences between GA4 and Google Ads so you can align the conversion settings across both tools.
Aligning these settings will not 100% eliminate the differences, but can help to reduce these differences.
You can select which Google Ads account you want to measure against from the linked ones. The Exported conversion section shows which GA4 conversion events are being exported to Google Ads.
The report compares the data and shows the differences in the last two columns between the numbers as % Difference and the Conversion settings for both platforms.

If you click through the Different settings option in the last column under Conversion settings, then you get to see those differences in the next View conversion settings window.
Conversion settings show the Conversion name and compare the chosen Attribution model, Look-back / Click-through conversion window, and Counting method.

In the above screenshot, the difference is not in the selected attribution model, but in the Look-back / Click-through conversion window settings, i.e., 90 days in GA4 vs 30 days in Google Ads, which explains why there are more conversions in Google Ads.
Since this is a very new feature, Google will likely tweak it before it’s rolled out to everyone.
It does look like a nice addition, but might not be very useful if your business doesn’t rely on Google Ads much. Time will tell how it pans out.
Changing Attribution Settings in GA4
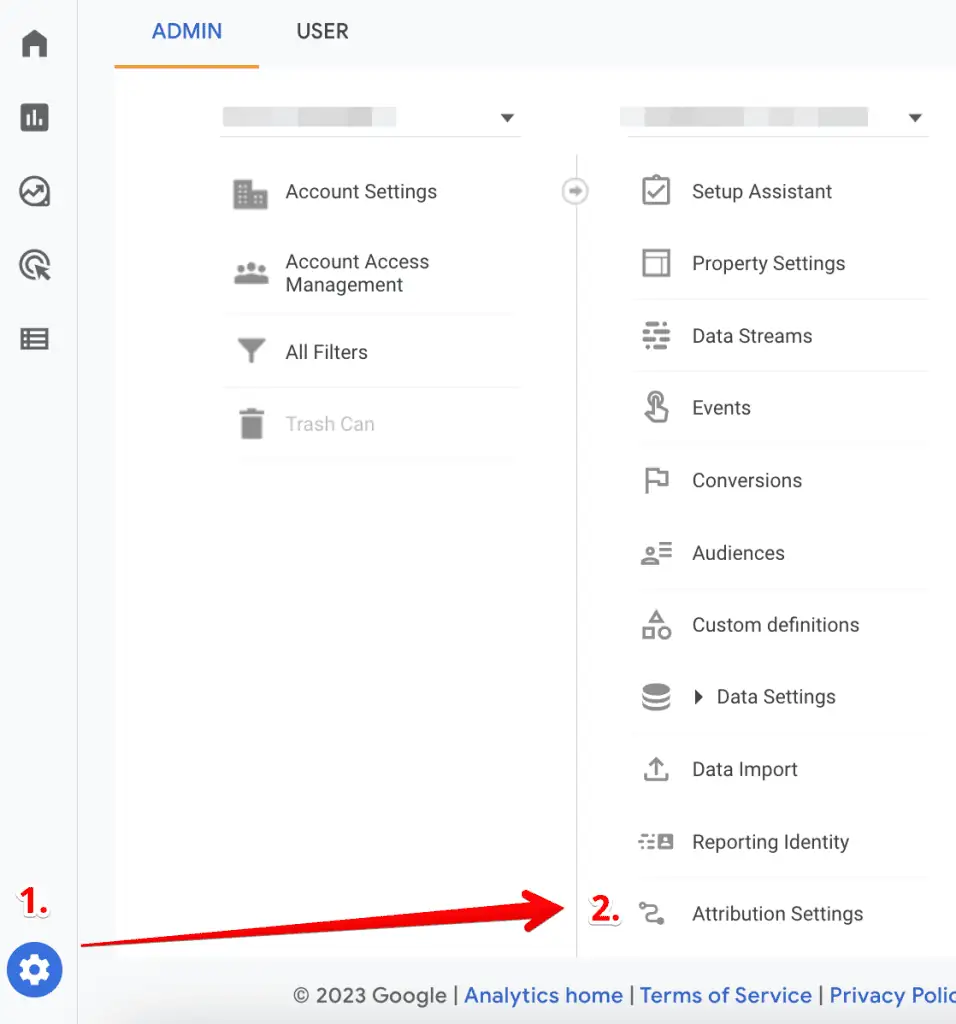
Firstly, to change settings in GA4, you need edit access. Then go to Admin → Click on Attribution settings under the property column.
Reporting Attribution Model
Once you’re in Attribution settings, you can choose the Reporting attribution model from the drop-down menu as we discussed above.

🚨Note: Changing the Google Analytics 4 attribution models will affect your historical and future data and will be reflected in all reports with conversions and revenue.
Channels that can Receive Credit
This part of the settings affects the web conversion data that is shared with Google Ads and looks at which channels should be given credit.
If you haven’t linked your Google Ads account with GA4, then the section will prompt you to link the account first. It’s also important that auto-tagging is enabled in your account.

Once linked, you will see the two options: give credit only to Google paid channels or to paid and organic channels. By default, the credit is given to Google paid channels.

Notice how it clearly mentions web conversions and not app conversions? It’s because all app conversions are imported by giving credit to only the Google paid channels.
It’s recommended to use the Paid and organic channels so the conversions are not overly attributed to only Google’s paid ads.

Also, important to keep in mind that while paid and organic channels receive credit, the reports in Google Ads will only show conversions that are assigned to it.
When you change the settings, you will also see the Email ad and Social ad graphic on the right to give you an idea of what this choice means.
🚨Note: Changing these settings will only affect the data going forward and it can take a few days for the changes to reflect in Google Ads reports.
Key Event Look-back Window
The other aspect of these settings is the look-back window for Acquisition, All other, and Engaged-view key events.
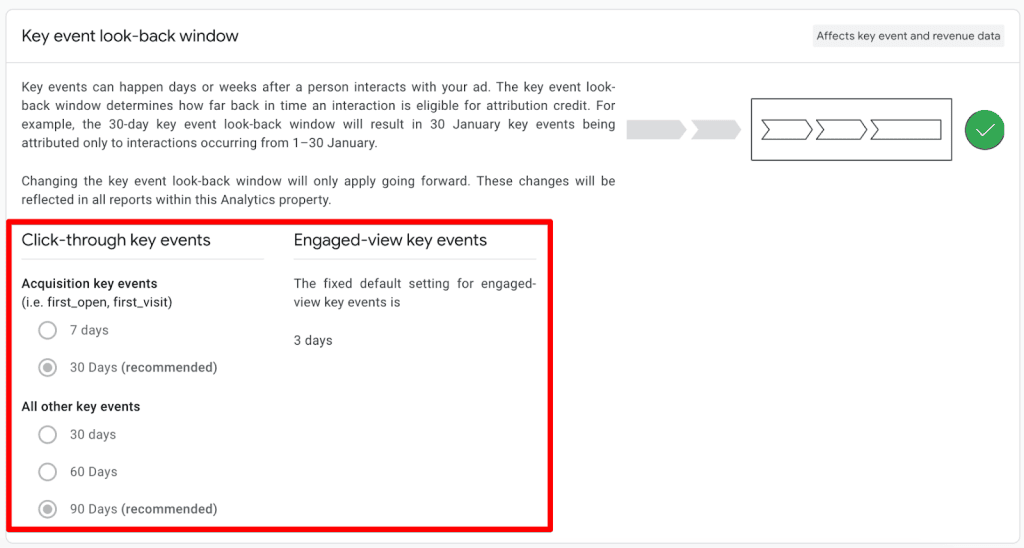
Unlike attribution settings, the lookback window settings apply only to future data but will affect the data in all the reports.
Once you’ve made the changes, simply click on the Save button and you’re done.
Attribution Models for GA4 Imported Conversions
The data-driven model is the attribution model applied to the conversions imported into Google Ads from GA4.
This attribution model is the default one, but if the data is insufficient for the data-driven model to work properly, then Google Ads switches to Paid and organic last click.
Attribution Model for App Conversions
Any conversions for the app will give credit to Google Ads if it’s in the conversion path. But if there is no Google Ads channel, then other channels like organic, email, etc. are eligible to receive the credit.
This means, that if you’re running Google Ads to drive traffic to your app and consequently getting conversions, you will see more conversions attributed to Google paid channels vs other channels in the path even if they are playing a role as well.
However, if you’re looking at the standard reports in GA4 then things are different.
Attribution Models Used in GA4 Standard Reports
Now, it is awesome that we can finally change our attribution settings in GA4, but it doesn’t come without problems like most GA4 things at present.
The problem is that different standard reports use different attribution models. Let’s quickly go over them.
- Acquisition → User Acquisition report uses the first-click attribution model.
- Acquisition → Traffic Acquisition report uses the last-non-direct-click attribution model same as the one used in UA.
- Engagement → Conversions report → Click on the conversion event and the report you see uses the attribution model you select in the property settings above.
- Explorations use the same attribution models based on what dimensions you select.
This can get confusing very quickly! But at least now you know what’s happening under the hood and can make informed decisions. We can only hope that these issues will get fixed soon.
Attribution for Traffic from Google Ads and Organic Search
When traffic channels like Google Ads or Organic search (or any other) lack referrer data for any reason, then Google classifies it as a ‘direct’ visit.
As a result, these channels won’t receive any credit even if they played a role in bringing traffic to your website and converting them.
This doesn’t apply to genuine direct visits, i.e., people who type your website in the address bar or have bookmarked your website. Essentially, if the traffic does not come from any other source, it is direct.
Now, if you have set up redirects before the user lands on the final page, it could cause important parameters including referral data to drop off.
If you see that traffic from sources like Google Paid, Organic, etc. drops while at the same time direct traffic increases, then there’s something wrong.
If you’re keen on understanding more about direct traffic and how to fix it, check out the post on How to Fix GA4 Direct Traffic.
It’s important to note that it doesn’t work retroactively, so if you fix issues leading to high direct traffic, only future data will be fixed.
Challenges in Attribution and Fixes
Below we discuss some major challenges and possible fixes:
- Loss of referral data – As discussed above, this can lead to a high number of direct traffic. To fix it, ensure all links are UTM tagged and where possible use auto-tagging and dynamic tagging. Also, it is a good idea to regularly audit your referral sources and fix any issues as soon as they arise.
- Cross-device and Cross-browser tracking – When users browse on different devices and/or browsers, it can cause issues with tracking touchpoints. Tracking User IDs can help unify user journeys. You can also encourage users to log in to their accounts across different devices to link their actions.
- Gaps due to privacy – You can’t talk about analytics data without privacy concerns and how different laws can cause gaps in attribution. To circumvent these gaps, try transitioning to collecting first-party data and getting users’ explicit consent.
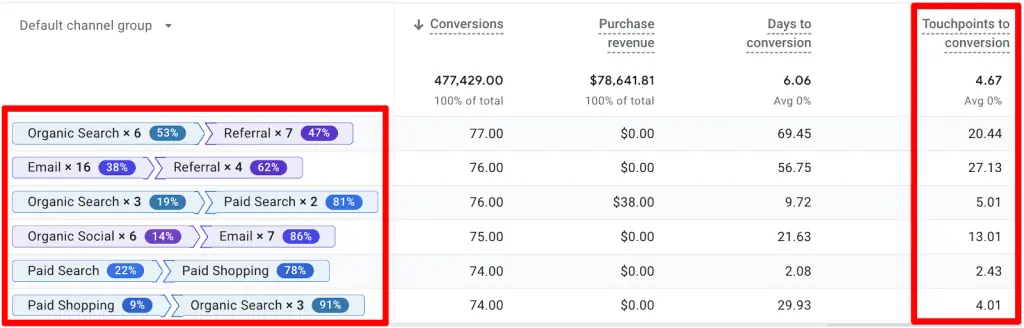
- Long conversion paths – For businesses that have long sales cycles, there could be many touchpoints before a user converts and if it’s a bit more complex, then attribution can become tricky. Use the Conversion Paths report in GA4 to analyze the user journey and see how you can optimize or shorten it.
So these are not all the challenges you’ll face Attribution is complex and messy, so as long as you stay on top of the major or common ones, you’ll be prepared for the unusual ones as well.
Summary
Great job! It’s very important to understand how attribution works in GA4 so you can make decisions that are right for your business.
Note that it will affect all the important data in your account. Before you go and casually change your attribution settings, talk to your marketing team and other colleagues and get everyone on board.
The ‘which attribution model is best’ debate is a never-ending one because there’s no one size fits all and it largely depends on your business model, and the conversion paths your converters take, among other things.
However, the data-driven attribution seems quite promising, and depending on how rich your account’s data is, it will try to give credit where due.
The only problem is it comes with Google’s secret sauce so we won’t know exactly how it came to a certain conclusion.
Attribution models are quite powerful. Still, we should not rely on them alone to make important decisions because broken links, session time-outs, and other technical glitches and settings can affect the data.
It’s important to make use of qualitative research as well, to make important decisions, and not to discard other marketing channels due to your chosen attribution model.
On that note, here’s our guide on How to Track Facebook Ads in GA4.
Have you used the model comparison tool in GA4? What attribution model do you prefer to use and why? Let us know in the comments below!
FAQ
How does the Data-driven Attribution (DDA) model work in GA4?
The Data-driven Attribution (DDA) model in GA4 uses an algorithm that considers various factors to give credit to different touchpoints. It analyzes historical data, ad interactions, device types, ad exposure order, creative assets, and the time from conversion to determine the likelihood of touchpoints driving conversions. It employs a counterfactual approach to compare what could have happened with what actually happened and assigns credit based on the probability of conversion.
What are the cross-channel rule-based attribution models in GA4?
The cross-channel rule-based attribution models in GA4 include:
1. Linear: Gives equal credit to all touchpoints in the conversion path (excluding direct visits), regardless of their position.
2. Position-based: Assigns 40% credit each to the first and last touchpoints, while the remaining 20% is evenly distributed among middle touchpoints (excluding direct visits).
3. Time Decay: Attributes credit based on a 7-day half-life, giving more weight to touchpoints closer to the conversion. Touchpoints further in time receive progressively less credit.
4. First Click: Attributes 100% credit to the first touchpoint or source that initiated the user’s journey to the website.
5. Last Click: Attributes 100% credit to the last touchpoint or source that led to the conversion (excluding direct visits).
How can I compare attribution models and their impact on conversions in GA4?
You can use the Google Analytics 4 Attribution Models Comparison report to compare different attribution models and understand how they attribute conversions to touchpoints. The report can be found under Advertising → Attribution → Model Comparison. You can select the models you want to compare and filter the conversion events to focus on relevant data. Additionally, GA4 provides the Conversion Differences report (currently not available for all accounts) that compares conversions between GA4 and Google Ads, helping you align conversion settings and reduce discrepancies.


")
Hi
Really interesting article. Thank you for that.
Do you know why, for the same timeframe, the transaction distribution I see in the attribution reports (Last Click (paid and organic) model) doesn’t match the transaction distribution I see in the default traffic acquisition report?
It should be the same, right?
Thank you!
Hi Nuno, There could be various reasons for the discrepancy but there will be some mismatch anyway. But in this case, mostly because of different scopes i.e. traffic acquisition is session-scoped and attribution models are event-scoped. You can learn more about scopes in this post: Understanding GA4 Scopes of Traffic-Dimensions.
Great article! I’m trying to resolve a large variance between results reported by Meta and what we see in GA4. Is it possible the two are looking at the results through different attribution lenses? Meta has both click and ‘view’ attributions, but there’s no view attribution with Google Search and Ad results. So, when GA4 reports on Paid Social, do the numbers reflect the view attributions that are part of what Meta is reporting? Further, if a path is, FB view, then a Google search leading to a Google ad click and a conversion, is the FB view given any attribution?
Hi Scott, Happy to see you find it useful. Yes, the results between both platforms will vary. You may try to view the conversion paths report in GA4 and see how it lays out things for you. Google Ads and Meta (like most ad platforms) are somewhat biased to give credit to their own platforms. So, you’ll see data doesn’t match between GAds and GA4 either. You can read more about the mismatch between GA4 and Meta here. Hope this helps!