
Last Modified on March 19, 2025
Are you struggling to find habitual and valuable landing page reports in Google Analytics 4? Don’t worry – just a few steps and you’ll get them back.
We have used the landing page reports within Universal Analytics to provide critical data such as visitor behavior, engagement metrics, conversion rates, and goal completions specific to each landing page.
However, the GA4 is missing this data, and we must manually configure it.
Anyway, it’s mandatory to do because analyzing this data allows us to identify high-performing pages, optimize underperforming ones, and make data-driven decisions to enhance user experience, increase conversions, and maximize marketing ROI.
GA4 Landing page reports empower marketers with the information needed to refine their campaigns, improve targeting, and drive more successful marketing outcomes.
Here are the four methods of getting landing page reports in GA4:
- Using the Native GA4 Landing Page Report
- Configuring Left-Side Navigation Menu by Modifying Existing Reports
- Building an Advanced Landing Page Report with the Exploration Section
- Configuring Landing page report by connecting to Looker Studio
Let’s dive in!
Using the Native GA4 Landing Page Report
You may be wondering why we should create custom reports instead of using a native Landing Page report available in Standard Reports. The reason is that using the native Landing Page report may not give you all the information you need for effective analysis and improvement.
This report is based on default settings and assumptions that may not match your specific business goals and tracking requirements.
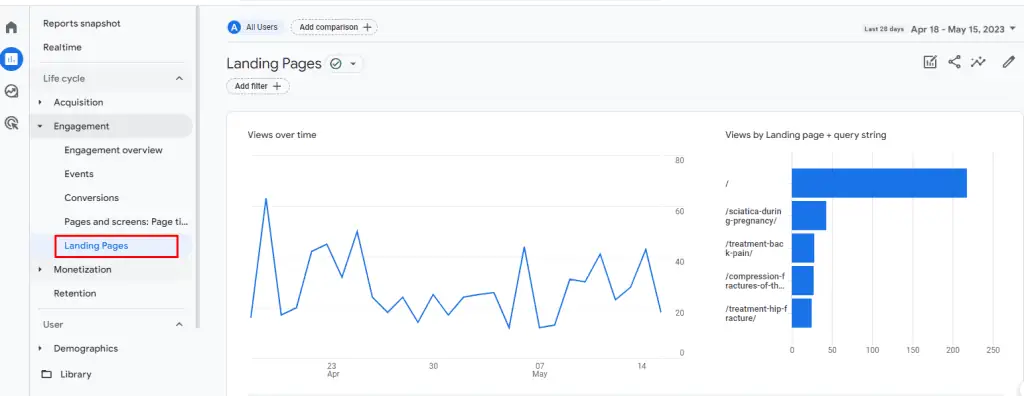
To find the native Landing page report in your Google Analytics account, go to Reports → Engagements → Landing Page.

Another reason is that the native Landing Page report uses the Landing page dimension that usually suffers from (not set) data.

Also, we have noticed that the Landing Pade dimension might collect an odd number of Views. It happens because the dimension includes further steps of page views within 1 user session.
It means that if a person visited multiple landing pages after the first page, the default Landing Page dimension will include the next page’s views in the 1 initial page View value, which makes the data different from what we expect to see.
That’s why we recommend using custom reports for Landing page data analysis. One such custom method is to modify an existing report in the left-side navigation menu.
🚨 Note: You can now get your reports sent to you via email on a scheduled time basis. Learn more about the GA4 scheduled reports feature!
How to Add a Landing Page Report to the Left-Side Navigation Menu in GA4
Configuring landing page reports in Google Analytics 4 can be done in a few simple steps.
Let’s explore the first method: adding a landing page report directly to your left-side menu by modifying the existing standard reports.
Opening relevant report
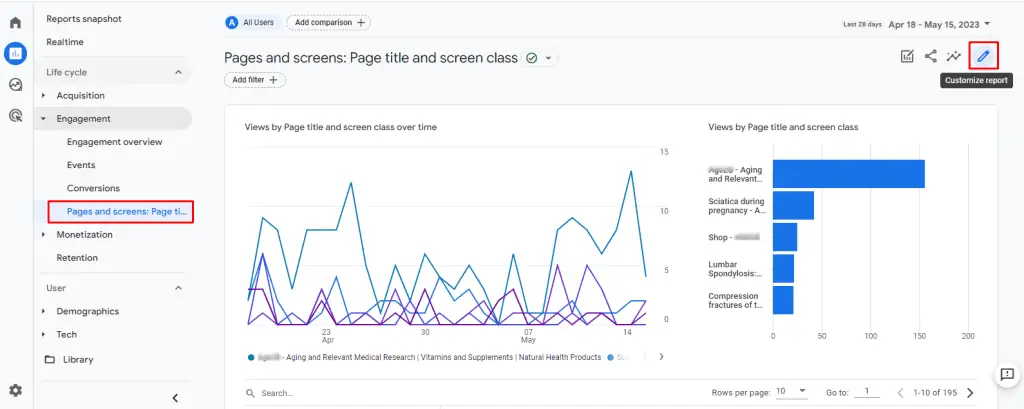
Begin by navigating to the Reports section and selecting Engagement, followed by Pages and Screens.

Customize Page and Screen Report
Look for the customize report icon at the page’s top right corner. Give it a click to proceed.
Open the right-sidebar with Dimensions
Once you’ve accessed the customization options, click on the Dimensions data section.

Select the appropriate option to add a new dimension to your report
Look for the Landing Page + Query String and choose it.

Setting the Landing Page dimension as the default
Next, click the three dots associated with the dimension you just added. Set it as the default option and apply the changes.

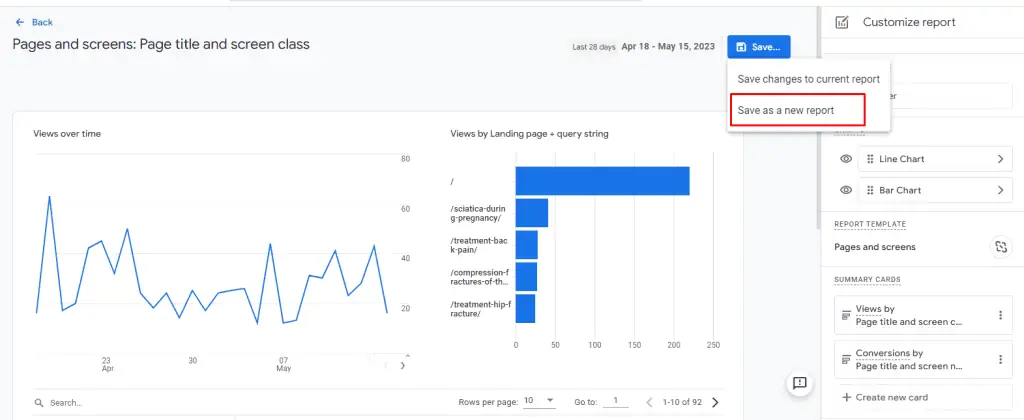
Saving a newly configured report
You must save this customized report as a new one. Click the save button and select Save as a new report.
Naming your report
Give your report a catchy name that will be displayed in the Left-Side menu, making it easy to identify and access.

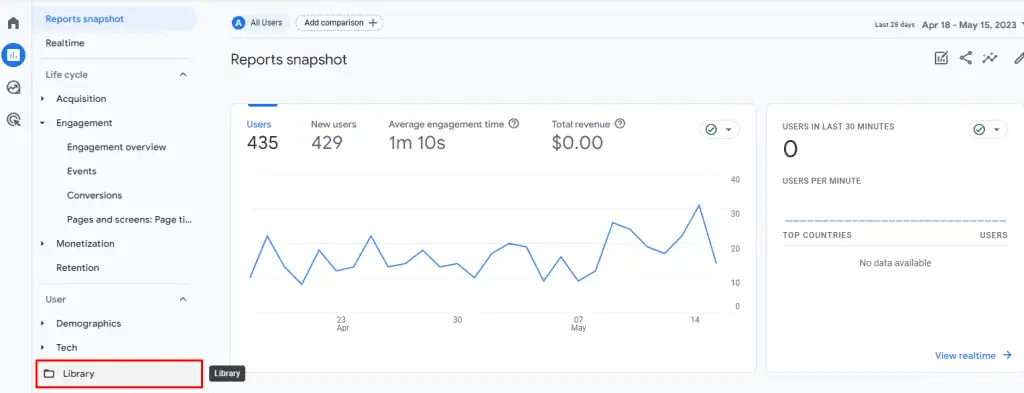
Adding this report to the left-side navigation
To make your report visible in the left sidebar, go to the Library.
Locate and edit the collection where you want to include the Landing page report.
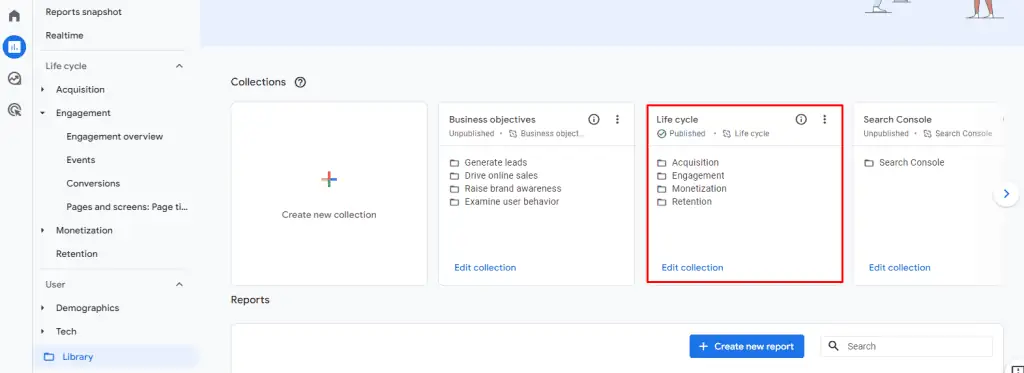
Drag and drop the Landing page report into the collection, and then save your changes.

You can now see your newly added report, conveniently accessible in the left-side menu.
This enhancement will allow you to swiftly navigate your analytics and uncover valuable insights about your landing page performance.
Here you can read more about how to customize your GA4 Report Layout.
How to Build an Advanced Landing Page Report within the Exploration Section
If you’re looking for a more advanced and efficient way to build your landing page reports, this option may require more expertise but it’s well worth it.
Not only does it save you time, but it also offers unparalleled flexibility and customization.
Go to the Exploration section of GA4
Within this section, choose the Blank report type to embark on a new exploration.

Give your report a name and add a Landing Page + query string as a dimension
Select the dimensions and metrics that will form the foundation of your report. To build the landing page report, opt for the Landing page + query string as a dimension.
Click on the + sign and choose the dimensions
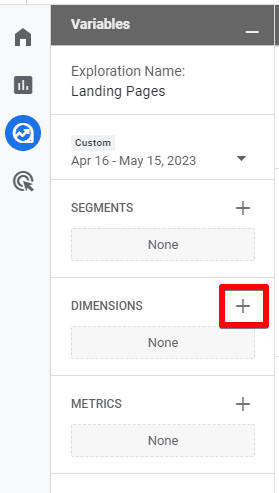
Choose the Landing page + query string dimension and click on the Import button.

Configuring table chart
This step is where the magic happens!
Choose the metrics associated with the landing pages you wish to display on the report.
🚨 Note: Here are the top 10 landing page metrics to track.
Double-clicking on each dimension and metric swiftly generates a visually appealing table neatly arranged with columns and rows.
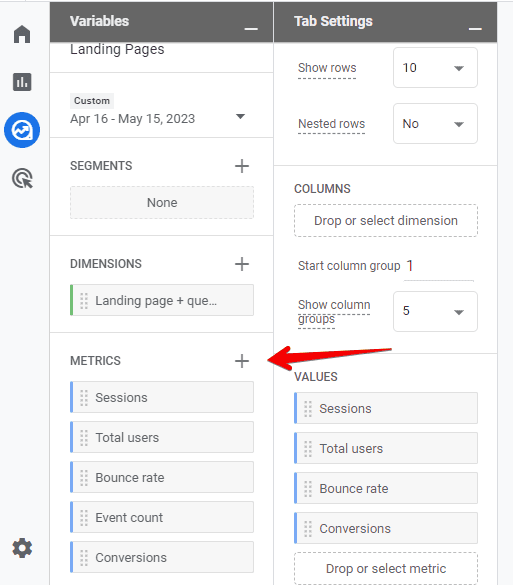
Feel free to add any additional metrics that you find necessary.
The best part of this method? Its versatility knows no bounds. You can easily incorporate any dimensions and metrics you desire and enhance their visualization by altering the report type.
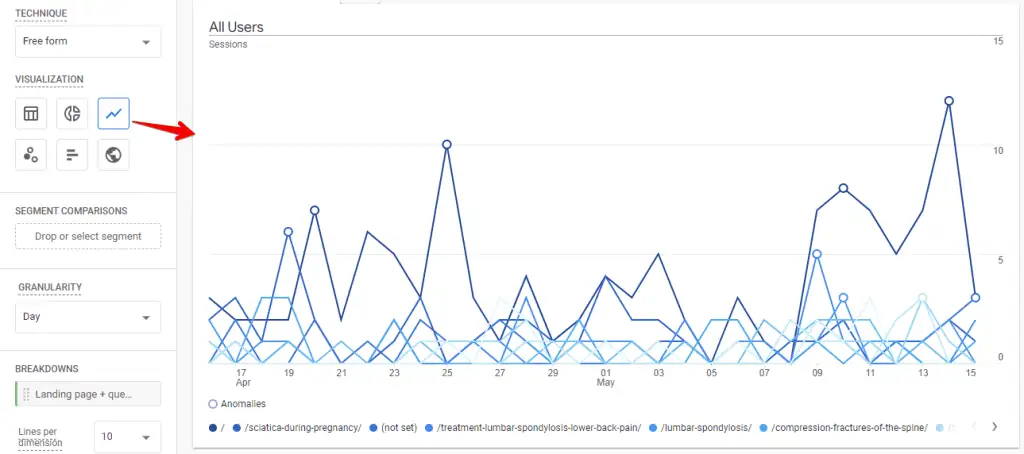
By clicking on the visualization icons, you can change the view of your data. Here are a few examples of what it looks like:
This is a donut chart of your data visualization.

This is a line chart of your data visualization.
Armed with this more advanced approach, you can dig even deeper into your landing page data, extract invaluable insights, and gain a comprehensive understanding of your website’s performance.
Embrace the power of customization and elevate your analytics game like never before!
How to Configure Landing Page Report in Looker Studio
The last method involves connecting analytics to another data visualization tool, Looker Studio (formerly Google Data Studio). Let’s build a basic report on landing page visits based on the data available in Google Analytics 4.
By default, no landing page dimension is available in the Google Analytics 4 data source. However, we hope that in the future, Looker Studio will add a Landing page dimension, as well.
Currently, the main alternative we can suggest is to use the event called “session start.” In Google Analytics 4, every session is expected to start with the session start event. So, let’s create a table with this event.
Click on Add a Chart and choose Table chart
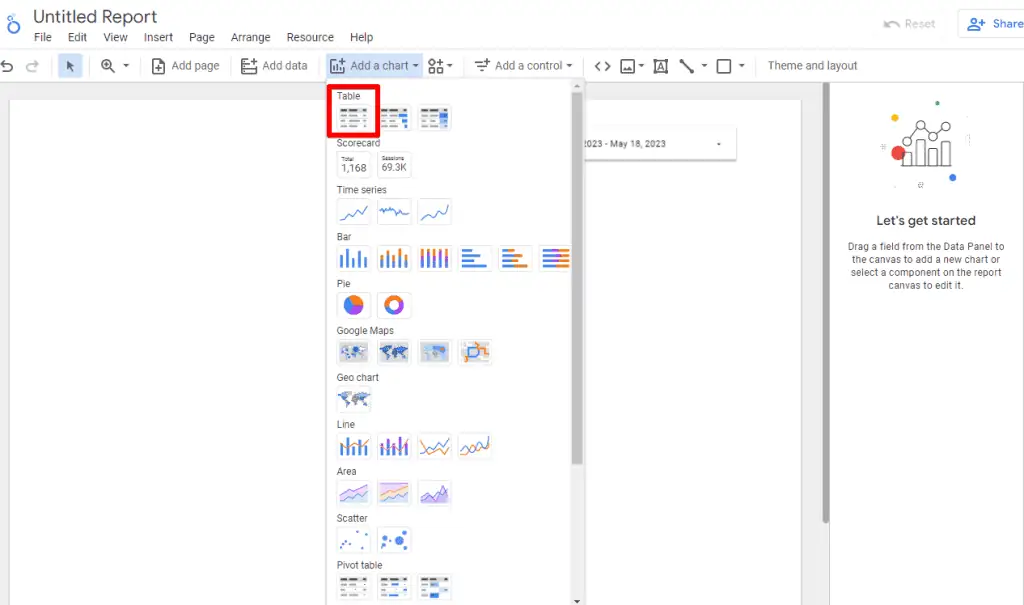
After we add the table, we will see the list of all events and the number of views by default.

We are interested in the event – session_start. That is, I can filter down to only the session_start event.
Click Add a Filter, create a filter, and name it something like session_start
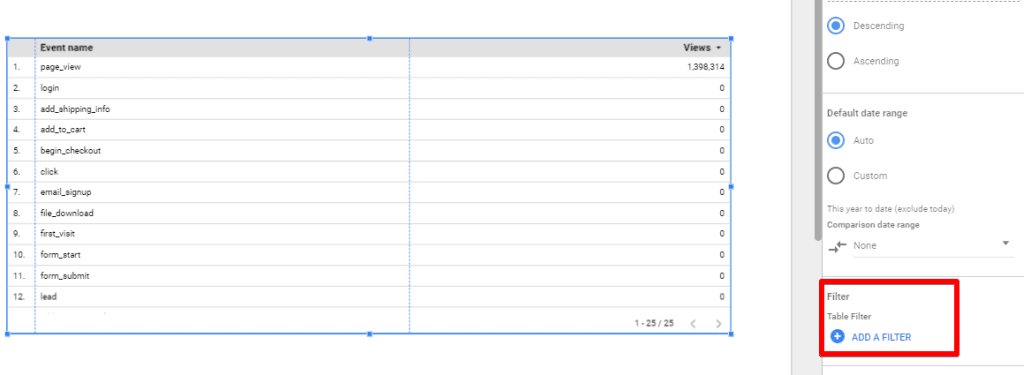
Then, include only the events where the event name equals session_start. Click save.

The first thing you’ll notice is that the Views metric doesn’t work with the session start event. It only works with the page view event.

Change the metric from Views to Event count
To see numbers here, you should change the metric from Views to Event Count.
This way, we will count the number of times the session started. Remove the Views metric and add the Event count metric instead.

The page URLs or page paths where sessions started
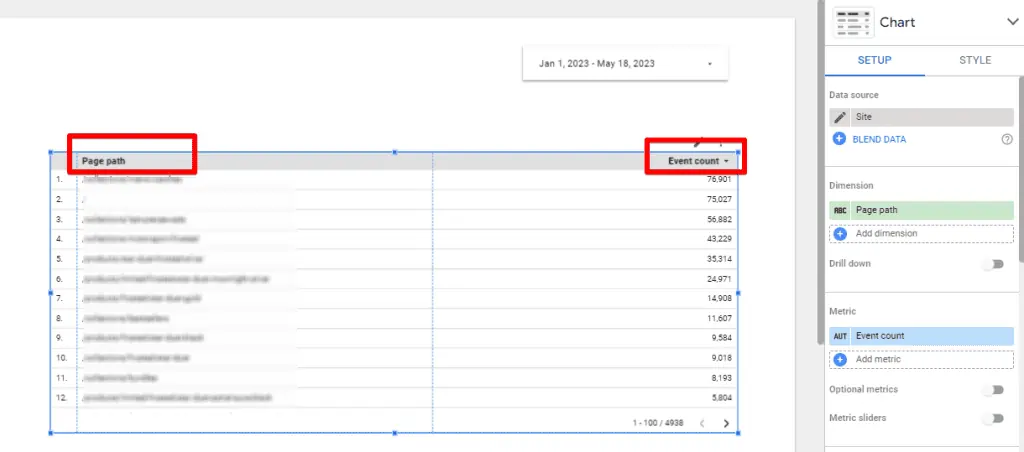
To achieve this, remove the event name dimension and instead add a dimension such as a page path, page title, or full page URL. Suppose we want to see the page path. Clicking on it will display the page location where sessions started.

The displayed number accurately indicates how often sessions started on these pages, excluding subsequent page views.
Although, including additional metrics like conversions becomes almost impossible with this method. This workaround method will suffice for a basic report that answers the question of how often those landing pages were seen.
However, reporting conversions introduces much greater complexity. In such cases, you will likely have to wait for the landing page dimension to be added to Looker Studio.
Alternatively, you could take a highly advanced approach by connecting Google Analytics 4 with BigQuery and then connecting BigQuery with Data Studio.
This would enable you to build a custom landing page report with additional metrics.
Check out our guide to read more about how to overcome GA4 limitations with Looker Studio.
FAQ
How can I add a landing page report to the left-side navigation menu in GA4?
To add a landing page report to the left-side navigation menu, follow these steps:
1. Go to the Reports section in GA4 and select Engagement, followed by Pages and Screens.
2. Click on the customize report icon at the top right corner of the page.
3. In the customization options, access the Dimensions data section.
4. Add the Landing Page + Query String dimension to your report.
5. Set the Landing Page dimension as the default option.
6. Save the customized report as a new report and give it a name.
7. Open the Library, locate and edit the collection where you want to include the landing page report.
8. Drag and drop the Landing page report into the collection and save your changes.
9. The newly added report will now be visible in the left-side navigation menu.
How can I build an advanced landing page report within the Exploration section of GA4?
To build an advanced landing page report within the Exploration section, follow these steps:
1. Go to the Exploration section of GA4.
2. Choose the Blank report type to start a new exploration.
3. Give your report a name and add the Landing Page Query String dimension.
4. Select the dimensions and metrics you want to include in the report.
5. Double-click on each dimension and metric to generate a visually appealing table with columns and rows.
6. Customize the report type and visualization by clicking on the visualization icons.
7. You can add additional dimensions and metrics as needed to enhance your analysis.
How can I configure a landing page report in Looker Studio?
To configure a landing page report in Looker Studio using the session start event, follow these steps:
1. Add a Table chart in Looker Studio.
2. By default, you will see a list of all events and their associated views.
3. Filter the events to only include the session_start event.
4. Change the metric from Views to Event Count to count the number of times the session started.
5. Add a dimension such as page path, page title, or full page URL to see where sessions started.
6. The displayed number indicates how often sessions started on those landing pages.
Note that including additional metrics like conversions may require more advanced methods such as connecting GA4 with BigQuery and then with Data Studio.
Summary
In this guide, we discovered a step-by-step process for creating landing page reports in GA4.
We explored three methods for obtaining landing page reports, including building an advanced Landing Page report within the collections reports in the Exploration Section within GA4 and Data Studio.
Check out our guide to get more advanced info on how to customize your GA4 reports.
What challenges have you faced in finding valuable landing page reports in GA4? Share your strategies for configuring landing page reports, and let’s discuss how data analysis can drive better conversions and campaign success. Join the conversation in the comments below!


")
Hi Inna, I wonder if it’s possible to add the custom dimension ‘content_group’ against landing page dimension?