
Last Modified on January 30, 2025
Are you wondering which Google Analytics 4 reports are the most important?
In this digital age, the importance of data-driven decision-making has never been more evident.

Master the basics with our FREE GA4 Course for Beginners
Every business, whether a startup or a multinational corporation, relies on analytics to understand user behavior, track conversions, and measure campaign success.
Analytics tools are designed to gather, process, and visualize vast amounts of data into comprehensive reports.
Google Analytics 4 (GA4) is the latest iteration of the free web analytics service by Google. It tracks both website and app traffic and events.
In this guide, we’ll discuss the various available Google Analytics 4 reports, where and how to access them, and which are the most essential for your business needs.
Here is an overview of what we’ll cover:
- Importance of Google Analytics 4 Reporting
- Types of Google Analytics 4 Reports
- Google Analytics 4 Reports for eCommerce Businesses
- Important SEO Reports in Google Analytics 4
- Create Custom Reports with Looker Studio
Let’s dive in!
Importance of Google Analytics 4 Reporting
Let’s take a step back and think about the evolution of businesses.
Traditionally, decision-making was driven by intuition or straightforward calculations. For instance, a store owner could estimate which products were in demand based on how quickly they left the shelves.
As businesses moved online, the vast digital landscape brought an influx of user interactions. From a simple page view to a complex purchase funnel, every click and scroll became data.
This transition required a more sophisticated method of understanding user behavior. That is where analytics tools entered the scene. They became the bridge between raw data and actionable insights.
Tools like Google Analytics provide a deeper look into their website’s performance, audience demographics, and user engagement metrics.
Essentially, these tools turned a jumble of numbers into coherent narratives on user behavior.
Ability to Get Quick Insights
Speed and efficiency are the cornerstones of the modern business landscape. In an era where competitors are just a click away, companies cannot afford to wait weeks or months for insights. They need real-time data to adapt and evolve.
Imagine launching a marketing campaign. Without real-time analytics, you would have to wait for the campaign to end before assessing its performance.
This delay could cost your business in terms of missed opportunities, especially if the campaign isn’t resonating with your target audience. Real-time reporting allows businesses to pivot, make adjustments, and optimize their campaign while it is running.
💡 Top Tip: Check out our Ultimate Guide to GA4 Real-time Report to learn how to monitor user behavior and gain valuable insights.
Moreover, quick insights mean that businesses can be more proactive than reactive.
If an eCommerce site sees a sudden drop in sales, immediate insights from analytics can help identify the root cause, be it a technical glitch or a competitor’s promotion. In contrast, delayed insights might result in prolonged sales slumps, harming the bottom line.
You can see and interact with insights in GA4 at three places. First, go to Home in the sidebar. Scroll down until you reach the Insights and Recommendations section.

Next, go to Reports → Reports snapshot. Here, you have a condensed Insights card.

Lastly, go to Advertising → Advertising snapshot. Similarly, we have an Insights card.

Analytics provides two types of insights:
- Automated Insights: Google detects unusual changes or emerging trends in your data and reports it in your Analytics platform.
- Custom Insights: You specify conditions to detect changes in your data that are important to you. You can create up to 50 custom insights per property.
💡 Top Tip: Gain more control over the insights you see on your Analytics page by learning How to Set Up GA4 Custom Insights.
GA4 Doesn’t Have a Lot of Prebuilt Reports
With the introduction of GA4, Google has taken a different approach to reporting. Unlike its predecessor, GA4 doesn’t bombard users with several prebuilt reports. It is not a shortcoming but a feature of this tool.
The idea behind GA4’s design was flexibility and adaptability. Every business is unique, and prebuilt reports will not cater to everyone’s needs.
GA4 gives users a clean slate, enabling them to customize their reports based on their unique business model and objectives. Furthermore, the reduction in the number of prebuilt reports is a nod to the changing dynamics of the digital ecosystem.
User behaviors and digital trends are constantly evolving. Relying solely on predefined reports might render some businesses oblivious to emerging patterns and behaviors.
GA4 encourages a more thoughtful and deliberate approach to analytics.
Instead of providing numerous reports to cover most business needs, Google focused on having some baseline Google Analytics 4 reports. Users can then build upon these prebuilt reports and use them as templates or customize their own.
With this flexibility, businesses can ensure that they are tracking metrics that matter most to them, leading to more precise and actionable insights.
Types of Google Analytics 4 Reports
At its core, GA4 offers two primary reporting sections that cater to countless analytics needs: Standard Reports and Explorations.
While both sections are integral to understanding user interactions and website performance, they serve distinct purposes and offer different features.
Standard Reports provide a structured and quick overview of primary data points and metrics, arranged systematically for immediate insights. Think of them as your go-to dashboard for a snapshot of your site’s performance.
Explorations are more versatile and dynamic. They are for analysts who wish to dive deep into data, create custom reports, and derive nuanced insights from raw data. It is like an analytics sandbox where you can manipulate, compare, and visualize data.
Standard Reports
The Standard Reports in GA4 offer a more streamlined approach to analytics. These reports are straightforward and designed to provide quick insights.
You can access the standard Google Analytics 4 reports by going to the Reports section.

When you open your reports, you will see a Reports snapshot report, a Real-time report, and several predefined reports. Commonly, you will see the Life Cycle and User reports.

The default set of predefined reports changes depending on which business objective you selected while creating your GA4 property.
🚨 Note: The predefined reports are grouped into collections, which can have topics and reports. Under topics are overview and detailed reports. For example, the Life Cycle collection has the Acquisition, Engagement, and Monetization topics and the Retention report.
As a reminder, here are the business objectives you can select:

You will get the Life Cycle collection if you select Get baseline reports. Selecting the other options will give you the Business Objectives collection with the selected objective/s as topics under the collection. All properties have the User collection by default.
🚨 Note: You can select one or multiple business objectives, but you can’t combine business objectives with the baseline reports option.
The Life Cycle collection helps you understand how people use your website or app. Each stage of the customer journey – from acquisition to retention – is described in a section.
Next, the Business Objectives collection provides a tailored set of reports that help you find information relevant to your business goals.
Most reports in the Life Cycle collection are also present in the Business Objectives collection. The reports are regrouped according to your business goal to provide a more focused view and to reach your insights faster.
💡 Top Tip: Read more on the included reports for each business objective by going to the official GA4 Business Objectives Collection documentation.
Finally, the User collection helps you understand the people who use your website or app, including their demographics (age, gender, etc.) and their used technologies (device, browser, operating system, etc.).
Let’s discuss the Google Analytics 4 reports in the Life Cycle collection since they are more general and apply to most business types.
Acquisition
Understanding where your users come from is fundamental for any business. Acquisition reports in GA4 provide detailed insights into the sources driving traffic to your site.

These traffic sources can include organic search, paid campaigns, social media channels, direct visits, and more.
💡 Top Tip: Learn more about the origin of your traffic sources and better understand your audience by checking out our guide on How to Track Website Traffic Sources with GA4.
The Google Analytics 4 reports included in the acquisition section are the Overview report, User Acquisition, and Traffic Acquisition. These reports give you both quantitative measure and qualitative data about your traffic sources.
For instance, you can analyze which sources lead to longer session durations, higher engagement, or better conversion rates. Such insights are invaluable when optimizing marketing strategies, allocating budgets, or tailoring content to audience segments.
Engagement
Once you know where your users are coming from, the next step is understanding their actions on your site. Engagement reports in GA4 shed light on what users do once they land on your website.

The Overview, Events, Conversions, Pages and screens, and Landing page reports are included in this topic. These reports provide a comprehensive overview of user interaction, from the pages they visit to the buttons they click.
You can identify popular content, track user journey paths, and pinpoint areas of friction. Such insights help businesses improve site navigation, enhance user experience, and boost engagement.
Monetization
Monetization reports are crucial for businesses that operate online stores or offer premium content.

The Google Analytics 4 reports included in the monetization topic are an Overview report, E-commerce purchases, Purchase journey, In-app purchases, Publisher ads, Promotions, and Checkout journey. These reports provide insights into the commercial aspects of your site.
You can track product sales, monitor transaction values, analyze purchase patterns, and more.
With monetization reports, businesses can understand which products are best-sellers, which promotional campaigns work, and which segments have the highest conversion rates.
Leveraging these insights can lead to optimized product placements, tailored promotional campaigns, and increased revenue streams.
Retention
Finally, the Retention overview report summarizes how well your website or app retains users.

Here, you can see the average time users spend engaged on your site or app after they arrive. We also have the percentage of users who return each day in their first 42 days.
The retention overview report includes the following summary cards: New Users and Returning Users, User Retention by Cohort, User Engagement by Cohort, User Retention, User Engagement, and Lifetime Value.
Customizing Standard Reports
These standard Google Analytics 4 reports are a good starting point for diving into your data. However, there may be times when you open these reports and find they are one or two steps away from what you need.
If only it included this other metric, maybe the chart type used could be better, or you want the default dimension to be different. It is serviceable and provides the needed information but lacks something. It is not perfect, but it is close.
If you find yourself under these circumstances, you may want to look into customizing your Google Analytics 4 reports.
If you are working with a team/organization, ensure you have the Editor role and have sufficient permissions to customize the reporting section. With this role, you can do the following:
- Edit a report – You can modify the dimensions and metrics users can see in the report, change the chart types, add/remove cards, add a report filter, and change the layout.
- Create a custom report – You can start from a template similar to the predefined reports or customize from a blank report.
- Add a report to a collection – You can add predefined or custom reports to existing or new collections.
- Create, edit, and publish a collection – You can customize collections to suit your business needs. Create one from scratch or modify existing ones. Once you have a collection, you need to publish it to see it in the reports section.
Let’s quickly look at how you can edit/customize an existing GA4 report.
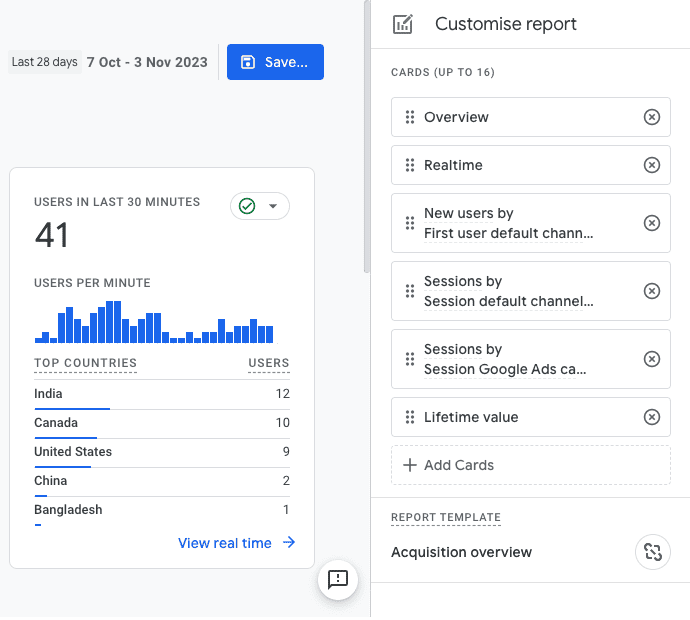
Click the Customize report at the top-right corner of the report.

Depending on the report type, you have different customization options. For an overview report, you can add/select up to 16 cards to display.
You can change the report data (the dimensions and metrics shown), charts, and summary cards for detailed reports. You can also add a report filter.

Next, you can create custom reports and create, edit, and publish collections in the GA4 Report Library. You can create new reports, custom collections, or edit existing collections.

For more details, check out our guide on customizing Google Analytics 4 reports if you want a full explanation of creating custom reports and collections.
The last thing we will describe in this section is how to publish collections. To demonstrate, let’s publish the Business Objectives collection.
Click on the collection action menu and select Publish.

Customizing standard reports is for when you need to make minor tweaks to standard reports. If further customization is required, it is best to create exploration reports.
Exploration Reports
The GA4 Explorations feature is an analytics powerhouse designed for those who want to dive deep into their data, unearthing layers of insights that aren’t immediately apparent from the standard reports.
These reports allow for customization and detail that can reveal finer nuances of user behavior and interactions. You can implement comparisons, filters, and segments for all report types.
🚨 Note: You can now save comparisons in Google Analytics 4.
You can access the Explorations section below the reports tab.

Let’s break down the primary Exploration techniques.
🚨 Note: We will only discuss each type briefly. For a detailed explanation of these primary exploration techniques and other available reports, check out our Top 10 GA4 Exploration Reports with Use Cases.
Free-form exploration
First, free-form explorations are the most flexible of all exploration techniques.

Think of this exploration report as a blank canvas where you can drag and drop various metrics and dimensions to create a custom report. You can produce basic tables or more complex detailed cross-tabs. You decide the format, data points, and visual representation.
You can visualize your data in tables or graphs, compare multiple metrics, create nested rows to group data, refine the data with segments and filters, and create segments and audiences from the selected data.
This tool is practical when you need a report that doesn’t fit the mold of the predefined standard reports, allowing you to tailor your analytics view precisely to your unique needs.
Cohort exploration
In the digital analytics world, cohorts are users who share common characteristics or experiences within a defined period.
The Cohort exploration Google Analytics 4 reports allow you to analyze these specific groups of users over time.

You can create cohorts based on your user’s acquisition date, an event they triggered, transactions, or conversions; cohort analyses group cohorts into daily, weekly, or monthly granularity.
It is valuable for tracking the effectiveness of marketing campaigns or accessing the longevity of user engagement after particular interventions such as a site redesign or a product launch.
Businesses can better understand user lifecycle and retention by monitoring how specific cohorts behave over time.
Funnel exploration
Every website has a desired user journey or conversion path, whether signing up for a newsletter, completing a purchase, or engaging with content.
The Funnel exploration tool visualizes this journey, showing where users drop off or continue forward.

It helps you optimize the user experience and identify over/underperforming audiences.
💡 Top Tip: Here is a more detailed guide on funnel explorations: How to Create a Funnel Exploration Report in GA4.
Businesses can optimize their site by identifying these friction points. It ensures users complete the desired actions and have increased conversions and engagement.
Segment overlap
Understanding how different user segments interact with your content can be enlightening.
The Segment overlap tool in GA4 lets you compare up to three user segments to see where they overlap.

Discover commonalities between different segments and identify new segments of users with more complex criteria by utilizing this technique.
This exploration type is handy for marketers trying to identify cross-selling or up-selling opportunities or content creators looking to target shared interests among user groups.
User Lifetime
The User lifetime report lets you analyze user behavior and user value over a customer’s lifetime.

It can help you find specific insights about user behavior, like when your monthly active users last purchased a product from your site or engaged with your app.
You can determine the active campaigns acquiring more users with higher purchases and lower churn probability.
It helps you understand your valuable campaigns and how to get more valuable customers.
Path exploration
Path exploration Google Analytics 4 reports focus on the broader navigation paths users take through your site or app.

Businesses can identify favored content sequences, optimize site navigation, and ensure that users find the content or products they look for with this visual representation of the paths.
It helps you understand how users navigate your website. You can find the top pages that new users open after opening the homepage, uncover looping behavior that indicates users becoming stuck, and determine the effects of an event on subsequent user actions.
User exploration
User exploration is similar to path exploration, with the former delving more into individual journeys.
🚨 Note: The example explorations we showed are from the Google demo account. Due to some privacy regulations, we cannot present an example of this report.
This tool allows businesses to drill down into individual user interactions, providing a granular view of how specific users navigate the site.
Understanding individual behavior is essential for personalizing the user experience and gaining insight into or troubleshooting a user flow. It can be invaluable for troubleshooting user issues, understanding the impact of personalized content, or A/B testing.
Customizability of Google Analytics 4 Reports
One of GA4’s standout features is its unparalleled customizability.
Beyond the standard reports and explorations, GA4 offers tools and features that let users tailor their analytics experience to their business needs.
Whether you create custom definitions (custom dimensions, custom metrics, and calculated metrics), adjust the data retention settings, or integrate them with other platforms, GA4 is designed for adaptability.

This adaptability means businesses can mold their analytics platform to fit their needs, ensuring that the insights they gather are relevant and actionable.
Google Analytics 4 Reports for eCommerce Businesses
In today’s digital age, eCommerce businesses thrive on understanding customer behavior and preferences. GA4 offers specialized eCommerce reports tailored for these businesses, ensuring that every click, purchase, and interaction does not go unnoticed.
Let’s delve into some essential Google Analytics 4 reports that every eCommerce business should know about.
Monetization Reports
Understanding revenue streams is crucial for any eCommerce business. Monetization reports in GA4 offer insights into the financial aspects of your online operations.
Product Performance
First, it is essential to have a comprehensive view of how individual products perform on your eCommerce store.
A readily available report to see this information is in the E-commerce purchases report.

You can track metrics like product views, add-to-cart actions, purchases, and revenue.

Businesses can tailor their marketing and inventory strategies accordingly by understanding which products are top sellers and which are lagging.
Transaction Data
Beyond individual products, it is vital to understand overall transaction trends.
A report where you have a high-level view of your data is the Monetization Overview report.

This section provides total revenue, average order value, purchase quantity, and more.
Again, create an exploration report if you require a more detailed look into your data. Just a reminder: you must import the eCommerce dimensions and metrics you need.
Let’s highlight one important metric you may need – the conversion rate.
Conversion Rate
Conversions are any valuable action you want users to take. They can occur when a user submits a form, signs up for your newsletter, or makes a purchase.
💡 Top Tip: Check out our guide on How to Set Up GA4 Conversion Tracking to properly set up conversions and ensure accurate conversion rate values.
The conversion rate for your eCommerce site is the percentage of conversions over the total. It helps you gauge the effectiveness of your sales funnel.
💡 Top Tip: Activate enhanced eCommerce tracking in GA4 to get the most out of these reports. It will populate your reports with rich data, providing a fuller picture of user interactions and conversions.
Advertising Reports
Effective advertising is the lifeblood of many eCommerce businesses. Whether you’re running PPC search campaigns, display ads, or retargeting efforts, GA4’s advertising reports can offer invaluable insights.
Source/Medium Report
Multiple reports can show you how you have acquired your users based on the source/medium.
One of these is the User acquisition report. Change the table dimension to the First user source/medium.

Are your Facebook ads more effective than your Google ads? Is organic search outperforming paid search? These insights can help refine your ad spend and strategy.
Campaign Performance
A campaign performance report is invaluable for businesses running multiple ad campaigns across different platforms.
Previously, we have discussed standard Google Analytics 4 reports and exploration reports. There is an additional collection available called the Advertising section.
🚨 Note: To get the most out of the Advertising section, ensure you link Google Ads to your GA4 property. When you link to Google Ads, your reports will contain detailed Google Ads campaign data.
Go to Advertising → All channels.

Next, change the table dimension to campaign.

Here, you can track metrics like conversions, ad costs, cost per conversion, total revenue, and return on ad spend. These help you identify which campaigns offer the best ROI.
Ad Destination Report
Understand which landing pages are the most effective in converting ad traffic.
In the standard Landing page report, you have a graph of the number of sessions by landing page over time and a table with the number of sessions, users, average engagement time per session, conversions, and total revenue.

If a particular landing page has a high bounce rate, it might be time for optimization.
💡 Top Tip: If the native GA4 landing report does not give you all the information you need for productive analysis and improvement, you should create a custom report instead. Follow this guide: How to Build a GA4 Landing Page Report.
Keyword Analysis
Finally, knowing the specific reasons and motivations behind a user’s journey to your website is essential. Determining which keywords they used to get there gives you a good idea.
💡 Top Tip: Follow our guide on How to See Keywords in Google Analytics 4 to learn the different methods to view what users were looking for before landing on our site.
While GA4 won’t provide exact keyword data for organic search, it is still a vital tool for paid search campaigns. Understand which search queries drive traffic, sales, and conversions to help you refine your keyword bidding strategy.
Important SEO Reports in Google Analytics 4
Search Engine Optimization (SEO) remains an essential strategy for businesses aiming to improve organic traffic, enhance visibility, and boost website rankings. GA4, with its rich reporting features, is an indispensable tool for SEO specialists and marketers.
Let’s delve into the key Google Analytics 4 reports that provide invaluable insights for SEO efforts.
Connect Search Console
GA4 and the Google Search Console, when used in tandem, provide a comprehensive view of how users discover and interact with your website through search engines.
💡 Top Tip: Read our article on the Google Search Console vs Google Analytics 4 to learn the similarities and differences and how to connect the two tools.
Search Queries
Once connected, GA4 will display the top search queries driving traffic to your website.
In the Reports tab, you will see the new Search Console collection. Open the Queries report.

Scrolling down the page, you will see a detailed table showing the top search queries.

While it won’t show the exact keyword for privacy reasons, you can still gauge the broad match queries and understand the topics users are interested in.
Clicks, Impressions, and CTR
Another report to view these metrics is the Google organic search traffic report.

Scroll down to see a table with the values of these metrics for each landing page + query string.

These metrics provide a snapshot of how often your website appears in search results (impressions), how many users click on your listing (clicks), and the ratio of clicks to impressions (CTR).
A high CTR often indicates that your title and meta description are compelling to users.
Landing Pages
Landing pages are helpful not just for eCommerce businesses but also for SEO. You can understand which pages on your website attract the most search traffic.
These pages can help identify which content resonates with users and which product pages rank well. Refer to the previous section if you need a refresher on accessing this report.
Devices
Determine which devices users are employing to access your site via search. It can provide insights into optimizing your website for mobile, tablet, or desktop users based on traffic sources.
You can see this information in the Tech details report. Change the primary dimension to the Device category.

Acquisition Reports
While SEO is about organic traffic, understanding the broader picture of your traffic sources can offer context and further optimization opportunities.
Source/Medium Report
You can still use the User acquisition report, but for this part, instead, we will use the Traffic acquisition report. Similarly, change the primary dimension to Session source/medium.

This report offers a breakdown of where your traffic is coming from. Is organic search outperforming direct traffic? How does social media compare to referrals?
Such insights can help tailor your SEO and broader marketing strategies.
Referral Traffic
Discover which external websites are linking to and sending traffic to your site. There are two ways to view referral traffic in your reports.
In your traffic acquisition report, you can add a filter. Set the filter to Session default channel group exactly matches referral.

Another way is to change the primary dimension to the Session default channel group. You should see a row for the Referral traffic.

It can be instrumental in link-building strategies, helping identify potential partners or areas where your content is resonating.
Organic Search Traffic
Dive deep into the metrics specific to users who find your website through organic search.
You can see organic search traffic in the Traffic Acquisition report by adding a filter or changing the table’s primary dimension.
For a deeper look into organic search traffic, create an exploration report where you can explore metrics like session duration, bounce rate, and pages per session.
These can help you understand the quality and behavior of organic visitors.
Channels Report
Creating a channels report shows how your traffic channels like organic search, paid search, social, and email stack up against each other.
A good base report for this is the Traffic Acquisition report, where we change the table’s primary dimension to the session default channel group.
There may be instances where you find that the default channel grouping is not what you need.
For example, you need to group several referrers into one channel, different traffic sources are part of the same marketing campaign, or you want your Google Analytics 4 reports digestible for business owners.
In these instances, you may want to create custom channel groupings. Use them in your standard reports, comparisons, filters, and exploration reports.
💡 Top Tip: We have covered many more types of reports that can help in SEO. Check out these 10 Reports in GA4 to Measure SEO Performance.
Next, we will explore another tool for creating reports to present your data: Looker Studio.
Create Custom Reports with Looker Studio
Modern businesses require bespoke solutions, especially for data analysis and reporting.
Looker Studio offers an avenue for those who seek to customize and tailor their reports beyond the standard offerings of GA4.

Why Consider Looker Studio?
Aside from overcoming GA4 limitations, Looker Studio is a robust tool with many features that you should consider. Here are some of the highlights of Looker Studio.
Flexibility
Looker Studio stands out for its adaptability. It allows for combining data from various sources, not just GA4. Businesses can obtain a holistic view of their operations by connecting to different datasets.
800+ connectors are available to access your data from more than 1000 datasets.

Customization
As with most reporting tools, you have a set of predefined templates you can build your reports. Access the template gallery by clicking Templates.

Google categorizes the templates based on the various data sources they pull data from. Here, let’s look at the available GA4 templates.
Select the eCommerce PPC template.

You can interact with the dashboard and test out its features. If you want to use this template, click Use My Own Data or Edit and Share.

As the name implies, the first option allows you to connect and use your data to populate the report. The second option will use the sample data used to build the template.
Both options will direct you to the editing interface, where you can change the metrics presented and adjust the color scheme, font sizes, chart types, etc.

Users are not limited to predefined templates. They can create, modify, and present data in ways that are most meaningful and relevant to their specific needs.
Accessibility
If you have security measures in place that limit who has access to your GA4 data, it can be challenging to share insights with your teammates or stakeholders.
With Looker Studio, you can create, share, and access reports without granting direct access to the primary data source. This ability ensures information dissemination without compromising data security.
Partner Integration
Beyond GA4, Looker Studio can pull data from CRM systems, databases, and other analytics tools, providing a unified view and richer insights.
Aside from the connectors built and supported by Looker Studio, multiple partner connectors created by various Looker Studio partners are also available.

💡 Top Tip: If you want to try out Looker Studio, check out these Looker Studio Basics, where we discuss all you need to get started.
Summary
The digital landscape is continuously evolving, with data at its forefront. As businesses, we must harness this data effectively and draw actionable insights that drive growth.
GA4, with its advanced features, provides a robust foundation for understanding user interactions and website performance.
Whether you rely on the built-in Google Analytics 4 reports or venture into custom creations with tools like Looker Studio, the key lies in interpreting the data in ways that resonate with your business goals.
Most of the reports we showed are from the GA4 demo account. It connects to a live merchandise store and allows you to view and access data you may not have in your account.
Check out our guide on the Practical Values of the GA4 Demo Account to know what the account is for, what account types are available, how to access it, and its limitations.
Remember that while the tool offers vast possibilities, the questions you ask and the insights you derive are what matters. Stay curious, keep exploring, and let the data guide your business decisions.
Do you agree with our list? Are there other reports that you consider essential? Let us know in the comments below!
Master the basics with our FREE GA4 Course for Beginners


")