
Last Modified on January 7, 2025
Are you experiencing some issues with your GA4 data?
Despite the many advantages of Google Analytics 4, some of its limitations can noticeably impact your business data. What can you do when faced with several issues but don’t have access to the source code or the Google Tag Manager account?

Master the basics with our FREE GA4 Course for Beginners
We’ll look at how to use Google Looker Studio (as a powerful complement to GA4) to overcome GA4 limitations. Learn how Looker Studio can save the day by helping provide your clients with the insights they need to succeed.
Here are a couple of methods of how to overcome GA4 limitations with Looker Studio:
Let’s dive in!
Some of GA4 Limitations
Let’s begin by highlighting the limitations of GA4 we’ll address.

Firstly, GA4 doesn’t have a built-in feature to remove duplicate data.
Even if it does have this feature, GA4 doesn’t have retroactive capabilities, meaning any changes you make will not apply to past data. If you set up a new event, filter, or conversion, they will only start working from the moment of creation.
If you discover an issue with your implementation, the changes you make to correct them will not fix the data from that mistake.
Lastly, while GA4 is perfect for showing results, seeing your progress toward a target is difficult. Unless you know your numbers like the back of your hand, you must take additional steps to determine if you’re meeting your goals.
I’ll show you how to overcome GA4 limitations in Looker Studio using three simple yet powerful formulas.
Problem #1: Removing Query Parameters
Let’s get started with problem number 1: removing query parameters.
What are query parameters, and why would we want to remove them? Sometimes, GA4 can look at a single web page and report it as multiple pages if they have different parameters.
For example, in your Google Analytics account, go to Reports → Engagement → Landing Page.

As the name suggests, this report contains insight into the landing pages on your website. For example, our third landing page brings in close to 7,000 sessions and 6,000 users.

The next one brings in close to 4,000 sessions and 4,000 users. The issue is that when you visit these two pages, they direct you to the same page. Both landing pages lead to the blog path.
If it is the same page, what is the purpose of distinguishing the two and adding the long text at the end? These are called query strings added to URLs. They carry information and communicate with tracking tools to enhance your data.
🚨 Note: When working with GA4, you can classify traffic sources with the help of UTM parameters. See this information in your reports by checking out our guide on How to Track UTM Codes in GA4.
For example, let’s say you shared a link on Facebook and got multiple users to click on the link to your landing page. For each user, Facebook will add a unique parameter to the URL. It causes the duplicated data in GA4 since there will be equally as many landing pages and users.
A compounding issue brought about by this is high cardinality. For those who are unaware, GA4 can only show a limited number of rows in your reports.
This is why some of you may have seen this weird entity called Other.

This becomes an issue because our data gets summarized into the other row, like in the example above. While you can see more data in your exploration reports, data sampling can occur if you have a large website.
Let’s see how to fix this in Looker Studio.
We have a table with the landing page dimension and total users metric.

Here, we can click on specific links and see how those pages trend over time.

Looking at the table, notice how the first part of the URL is the same, and the difference occurs after the question mark.

You may be under the impression that our website has many different pages for the jeans category, but in reality, these refer to the same page. All text after the question mark is the query string, and the text before is the URL for each unique page.
We’ll use a formula using regular expressions (RegEx) to determine each unique page path. To build this in GA4, we need to create a calculated field.
💡 Top Tip: Check out Regular-Expressions.info for an in-depth site about RegEx. Next, you can test out your regular expressions by using RegEx101.
There are two ways to do this. One is to implement it at the chart level, and the second at the data source level. Let’s use the second way.
Go to your data source and click on Add a field.

Now, we can start building our formula. We’ll use a regular expression, specifically, the REGEXP_REPLACE function. Its syntax is as follows:
REGEXP_REPLACE(X, regular_expression, replacement)The X parameter is our field or dimension. The regular_expression parameter will determine which portion we want to replace. Finally, the replacement parameter is the text we want to replace the matched text.
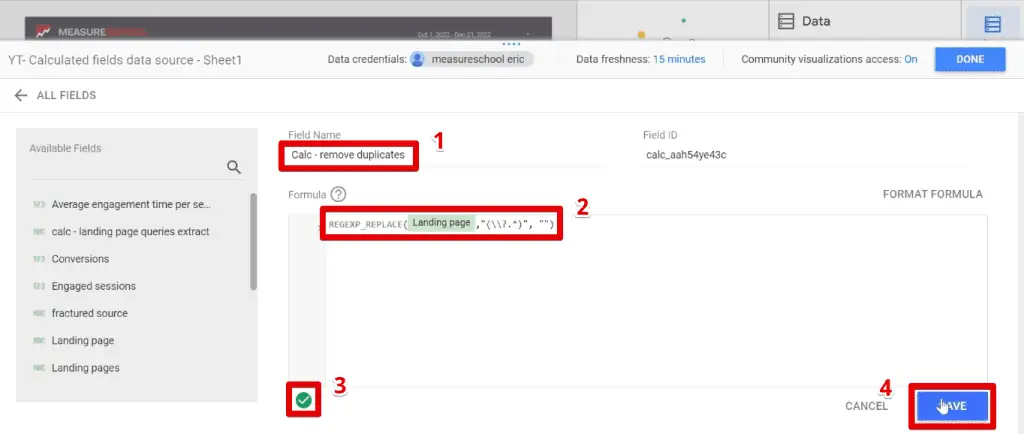
For our example, we want to delete the latter portion of our landing page that starts with the question mark. In other words, replace the query string with nothing. Here is our formula:
REGEXP_REPLACE(Landing Page, “(\\?.*)”, “”)Here, we’ll look at all our landing pages. The regular expression will find the portion that starts with the question mark to the end. Finally, it replaces that portion with nothing, essentially deleting it. This leaves the URL protocol, domain, and path.
Let’s give a name for our calculated field, and then paste our formula. The green check mark means that the formula syntax we provided is valid. Click Save.
Select the table, grab our calculated field, and bring it to the chart dimensions.

We have successfully removed the query strings from the URL, but still have duplicate data.

This is because we have kept the landing page dimension in the table. Click on ✖ to remove the landing page dimension.

Now, we have accurate numbers for the pages on our website.

Problem #2: Content Grouping and Untracked Data
The next problem involves content groups and untracked data.
For this scenario, let’s say our client needs to track their blog content categories and know how their content themes performed. Their blog is about animals and they write articles about cats, dogs, birds, etc.
Without access to WordPress or Google Tag Manager, how do you extract these topics from 100+ pages and place them into different categories, also known as content groups for analysis? Normally, you would create content groups in GA4.
Go to Engagement → Pages and Screens. Here, we have the Content Group as a primary dimension.

To create/modify content groups, you’ll have to either mess with the Google tag code or send custom parameters via Google Tag Manager. Since the client doesn’t have access to both, the next option is to use Firebase.
We can quickly achieve this in Looker Studio with the help of the famous Looker Studio case statement. Based on the page titles, we’ll create groups of topics like these:

This solution is also very useful if you want to track product categories for sites that don’t have eCommerce implemented. Let’s see how.
We have a table here with our page titles, number of users, engaged sessions, and conversions.

Let’s build our formula. We’ll be using what is known as the CASE function. It allows us to create a condition that returns a value if true. We can specify multiple conditions and a catch-all value if none of the values are met.
A Case function has the following syntax:
CASE
WHEN condition THEN result
[WHEN condition THEN result]
[...]
[ELSE else_result]
END
Always start with CASE and close the function with END. Each condition starts in a new line with WHEN then the value returned when the condition is met comes after THEN. An optional result when no conditions are met can be specified after ELSE.
Next, we’ll bring back some RegEx magic for specifying the conditions in our case function. We’ll use the REGEXP_CONTAINS function with the following syntax:
REGEXP_CONTAINS(X, regular_expression)This function returns true if the value of the X parameter or any substring thereof matches the pattern of the regular expression. It shares similarities to the REGEXP_MATCH function, where the latter matches the entire value by default.
To demonstrate how these functions work together, let’s look at a portion of the formula we’ll use for our content groups:

We begin with the CASE function. Next, we start with the first condition by using the REGEXP_CONTAINS function. Here, we look at the page title and look for those that contain Google Analytics 4 or GA4. These pages will be under the GA4 content group.
Let’s understand what we are trying to do here.
Our blog has a lot of content around Google Analytics 4 or GA4. Some posts may have a title like How to Learn Google Analytics 4. Another post can be called How to Track Forms in GA4.
These two conditions pertain to a single content theme, just worded differently. We can condense them in a single condition in our RegEx. If any of our page titles have the words Google Analytics 4 or GA4, then create the GA4 content group.
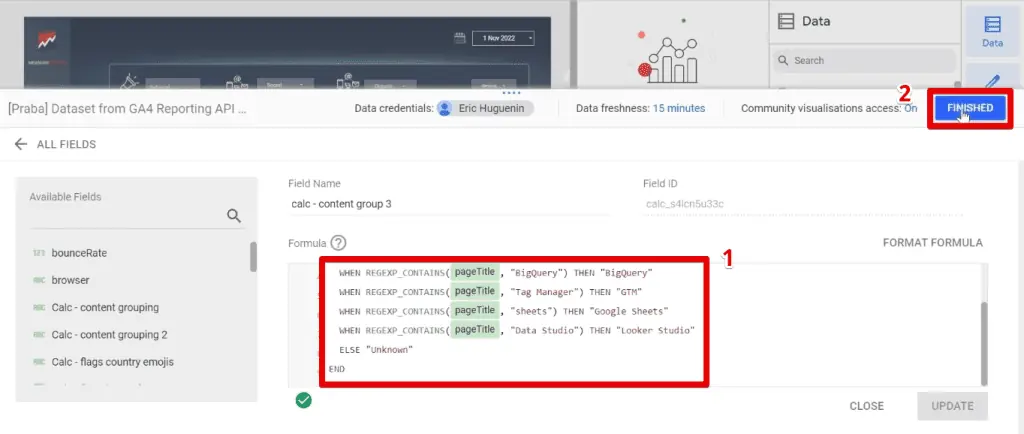
The other conditions follow a similar logic. Here is our complete content group formula:
CASE
WHEN REGEXP_CONTAINS(pageTitle, “Google Analytics 4|GA4”) THEN “GA4”
WHEN REGEXP_CONTAINS(pageTitle, “Ads”) THEN “Ads”
WHEN REGEXP_CONTAINS(pageTitle, “BigQuery”) THEN “BigQuery”
WHEN REGEXP_CONTAINS(pageTitle, “Tag Manager”) THEN “GTM”
WHEN REGEXP_CONTAINS(pageTitle, “Sheets”) THEN “Google Sheets”
WHEN REGEXP_CONTAINS(pageTitle, “Data Studio”) THEN “Looker Studio”
ELSE “Unknown”
END
We won’t go through all the steps for the other ones. The gist of the formula is to specify a content group per line based on certain keywords.
Page titles that don’t have any of the keywords we specified in our RegEx will be grouped into the “Unknown” content group. This title could be anything you want, just place its name after the ELSE clause. Finally, close the formula with END.
Paste the updated formula to our calculated field, then click Finished.
Replace the page title dimension with our calculated field.

There you go! We now have our content groups.

Having the ability to specify our content groups is very useful because we can compare how the content groups perform against each other. For example, we can see which content group brings the most user traffic, engagements, or conversions.
It can also be very insightful because, like the above example, we can discover other content to explore. Our unknown category brought in the largest numbers on all metrics, so we can find new topics here.
Problem #3: Track Marketing Progress
The last problem deals with setting targets and viewing your progress.
With all the features GA4 has, it doesn’t help in setting targets and knowing how close you are to achieving them. For example, let’s say that your client has a monthly traffic goal of 12,000 users. There isn’t a setting in GA4 that you could toggle to view this.
We can easily overcome this GA4 limitation in Looker Studio. In the example below, we have a gauge chart in the middle that quickly visualizes how close we are to reaching the target.

What’s great with Looker Studio is we can personalize the report to show the information that we need. In the sample report, we have displayed the target on the left and the current number on the right. Lastly, we also have a time series chart showing the progress per day.
The other good thing is that you can also track your progress as you go along. Let’s say that we want to see what the progress was like in the middle of September.
Change the date range for the beginning of September to, let’s say, the 10th. Notice the gauge chart changes accordingly.

Aside from the gauge chart, the current user traffic and time series chart also reflects the data up to the 10th of September. Now, let’s see how to recreate these features.
Most of the elements in our report are basic visuals like text or shapes, so we’ll focus on the charts that show data from GA4.
To start, let’s insert a scorecard showing the Total Users metric.

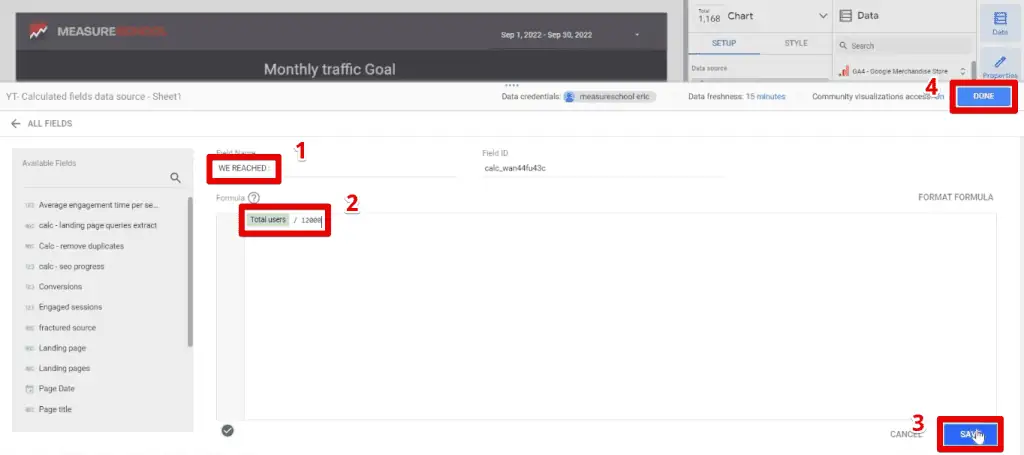
Next, we’ll create a calculated field to compute the percentage of our current users to the target. Name the calculated field, then type the formula:
Total users / 12000Click Save. Finally, click Done.
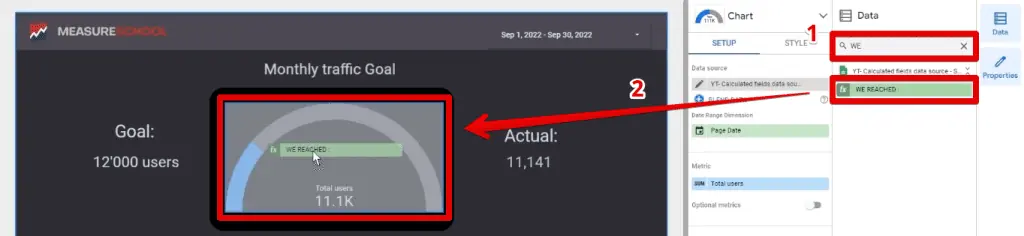
Next, click on Add a Chart → Gauge Chart.

Place it in the middle of our report. Search for our metric, then drag it to our gauge chart.
Next, we’ll increase our font size. Go to Style. Change the font size to 48 px.

Now, you may notice that the number is formatted as a number, not a percentage.
Click on the pencil icon next to the metric.

Go to Type, and select Numeric → Percent.

Next, we’ll create the time series chart.
Duplicate the gauge chart and position it at the bottom of our page. Next, click on the Chart header to change our type.

Select the time series chart.

FAQ
How can you remove query parameters in GA4 using Looker Studio?
To remove query parameters in GA4 using Looker Studio, you can create a calculated field using regular expressions (RegEx) to remove the portion of the URL containing query parameters. This helps eliminate duplicate data.
How can you track marketing progress in Looker Studio?
Looker Studio allows you to set targets and track progress towards them. By creating visualizations like gauge charts and time series charts, you can easily monitor your progress and compare it to your targets.
What are the benefits of using Looker Studio for overcoming GA4 limitations?
Some benefits include:
1. Removing query parameters to eliminate duplicate data.
2. Creating content groups without access to WordPress or Google Tag Manager.
3. Setting targets and tracking progress towards goals.
Personalizing reports to display the desired information.
4. Visualizing data in a user-friendly manner.
Summary
Looker Studio offers a lot of formulas that can help you overcome limitations in GA4. These three solutions can be applied to a wide range of challenges.
Want to navigate through the different pages of your report? Check out our guide on how to create navigation bars in Looker Studio.
What GA4 limitation do you want to overcome? Which solution did you find most useful? Let us know in the comments below!
Master the basics with our FREE GA4 Course for Beginners


")
how on earth did you have the landing page dimension on your looker studio? I noticed that there are a lot of dimensions available on GA4 explore tab that are missing in looker, esp. the event parameters for the default events link_url, link_.domain etc.
yes, there are differences between GA4 and Looker Studio Dimensions. You might need to register it as custom dimension to pull over to Looker Studio