
Last Modified on March 26, 2025
Google Analytics provides a lot of valuable information that SEO professionals can use to gauge the effectiveness of their SEO performance and identify potential problems such as site speed or find conversion opportunities from landing pages that rank well and convert.
Some of GA4’s reports are a must-have in any SEO beginner’s and specialist’s toolbox.

Master the basics with our FREE GA4 Course for Beginners
This is why we’ve brought you a list of SEO reports in Google Analytics 4 that help in various aspects of your SEO strategy.
🚨 Note: Some standalone reports from the previous version of Google Analytics (e.g., the Referral report, the Landing Page report) have to be manually recreated in GA4 or ended up being incorporated into other ones. But we’ll still present them here separately.
Here’s what we’re going to cover:
- Conversions Report
- Traffic Acquisition Report
- Referral Traffic
- Landing Page Report
- Google Search Console
- Site Speed Report
- User Retention
- Mobile Report
- Report Snapshot (Automated Insights)
- Looker Studio
Why Google Analytics is Important for SEO
Google Analytics provides in-depth answers about your SEO efforts. Thanks to its metrics, it allows you to monitor the development of your site’s pages, which is useful since SEO is a marketing strategy that takes time to bear fruit.
Google Analytics is an excellent solution for detecting opportunities and problems for both technical and on-page SEO. By pointing out what is working or not working based on your goals, Google Analytics helps you know where to invest financial resources and time.
In addition to revealing details about the origin of your traffic, it sheds light on the behavior of users after arriving on your site, which is essential for optimization.
Some examples of what Google Analytics can do for your SEO:
- Where is my traffic coming from?
- Which content is the least or most engaging?
- Which content brings in the most sales?
- Which device brings in the most traffic?
- And much more…
Now let’s look at 10 places that will help you achieve all of that.
1. Conversions Report
Proposing more budget for SEO or demonstrating its ROI can occasionally be difficult. We tend to believe that tons of traffic are the best way to gauge SEO success, but a large volume of traffic that doesn’t convert is the opposite of that, regardless of rankings.
This is why being clear on what are your website’s objectives and translating them into goals (called conversions in GA4) is so important.
Having GA4 conversions turned on allows you to track target objectives, which makes it easier to prove SEO results and justify more budget.
Also, SEO results are known to take longer than other digital marketing practices. Therefore the earlier you can set them, the better since you’ll be able to show beyond doubt their effectiveness over time.
SEO goals can be the number of pageviews attained, sales conversions, form submissions for leads, or any action you expect users to take.
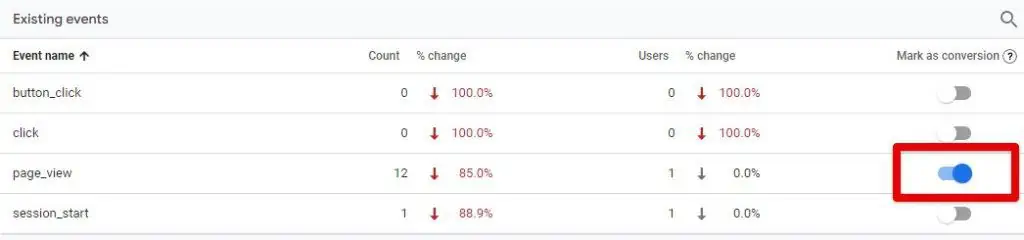
Once you’re tracking the interactions you want on your website (called Events in GA4), the rest is a piece of cake in GA4. You only have to turn on a little toggle to mark your events as conversions.
Let’s look at an example. Go to Configure → Events
Then turn on the event you want under Existing events by clicking on the toggle. It should turn blue.
You can view your list of conversions here Configure → Conversions.
🚨 Note: Unlike in Universal Analytics, in GA4 you can modify the standard reports in any way. Our handy guide can show you how.
2. Traffic Acquisition Report
SEO is about improving the visibility of your web pages in organic search results. GA4’s Acquisition report provides deep insights into your website’s traffic sources. This includes organic traffic from search engines like Google, Yahoo, or Bing.
Organic traffic in GA4 can therefore be analyzed and compared to other traffic sources like Google, Facebook, Direct, etc.
Here you can understand where (aka source) your users are coming from and how (aka medium) they’re getting there.
GA4 looks at Acquisition via two different lenses or attribution models, hence the 2 following reports under Acquisition:
- User Acquisition
- Traffic acquisition
Most of the time, marketers will dive into the Traffic acquisition report. This report is also similar to the one in Universal Analytics (GA3).
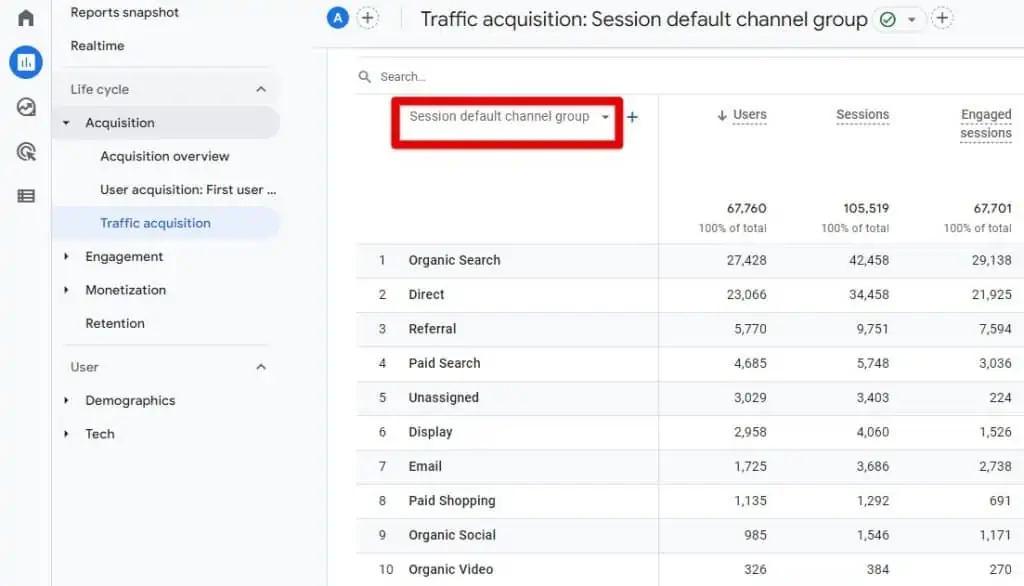
To get to this report, go to Reports → Acquisition → Traffic acquisition
Click on the primary dimension which is the Session default channel group.
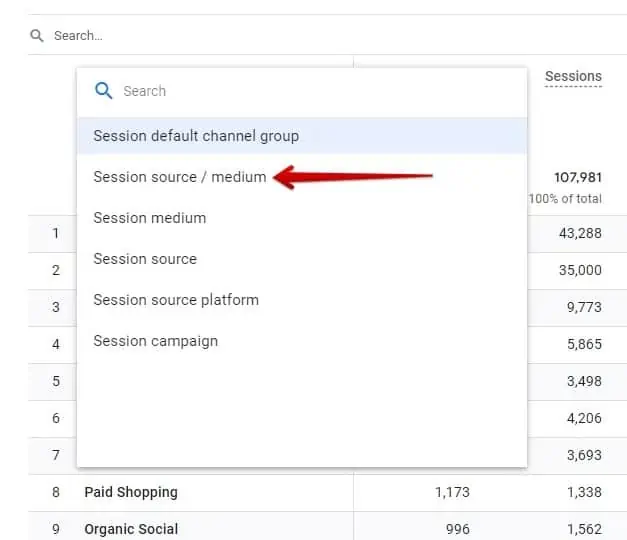
From the list of dimensions, select Session source/medium.
Now that we’re looking only at traffic coming from different sources and mediums, we’ll filter the table to look only at organic traffic.
In the search bar, type organic and press enter.

Now you should have a report highlighting only organic traffic coming to your site.
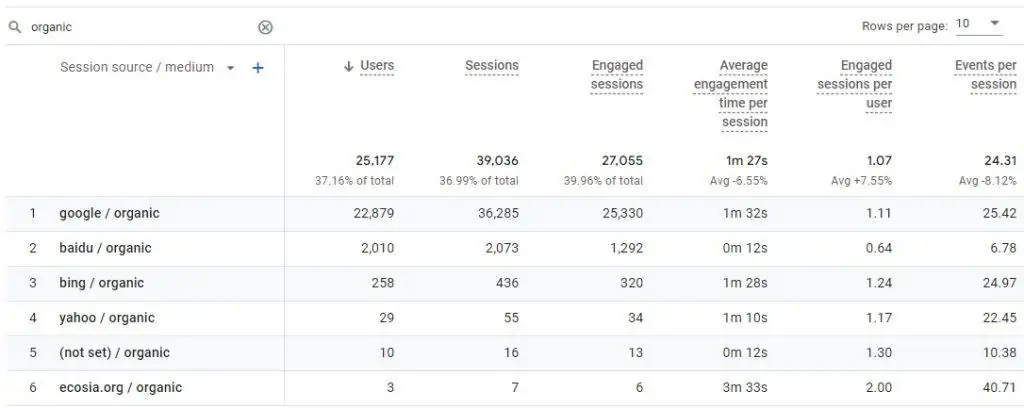
Some good metrics to measure the performance of your organic traffic are Users, Sessions, Engaged sessions, and Average engagement time per session.
3. Referral Traffic
Among the GA4 default reports, referral traffic is another one that is no longer separate. However, it is easily reproducible because it only requires filtering the acquisition report by changing the primary dimension.
Referral traffic shows you sites that link to your site. This differs from clicking on one of your links in a search engine.
Referral traffic is a very important SEO factor. With this type of traffic, you not only increase your volume of traffic but also create backlinks that raise your Domain Authority and your search engine ranking.
If you are aware of the sites that mention your site, you can contact them directly to collaborate.
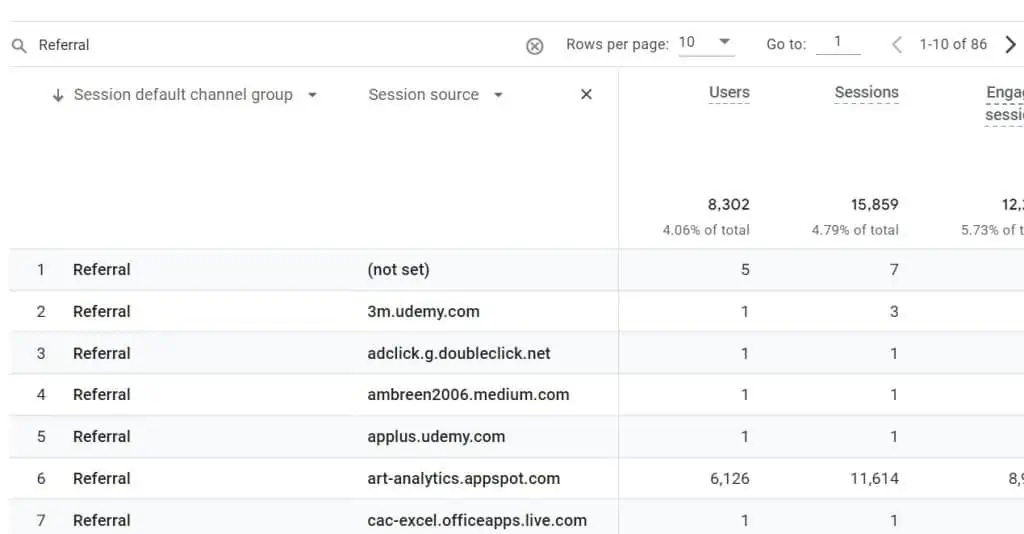
How Do I See Referral Traffic in Google Analytics 4?
Go to Reports → Traffic acquisition
Scroll down to the table. You may find Referral listed there.
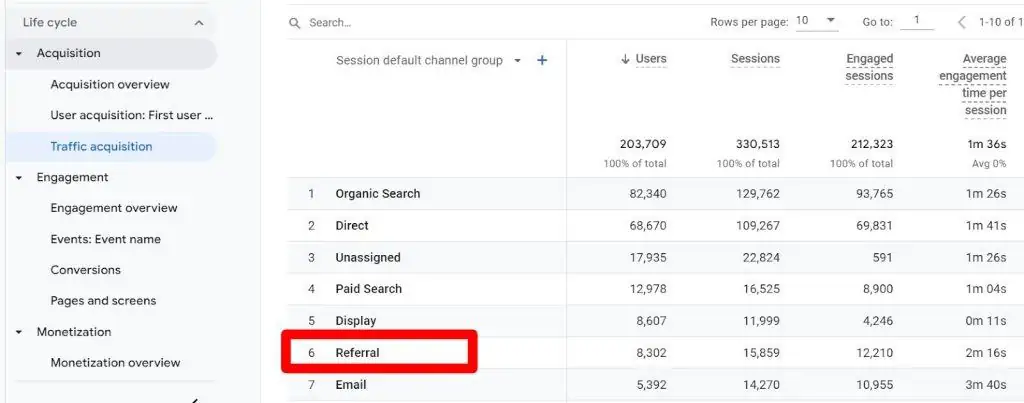
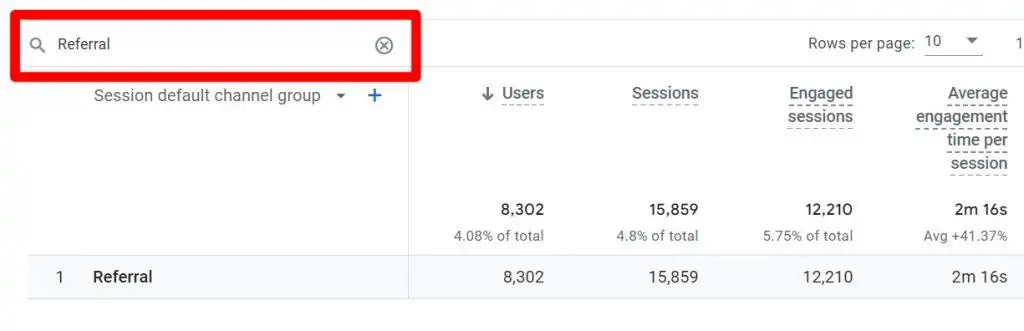
However, you can’t click on it to get more details. To do so, type ‘Referral’ in the search bar and press enter.
🚨 Note: GA4 may occasionally return an empty result after typing a dimension in the search bar. Repeat the process and you’ll see it appear.
Then, to find the sources of your referral traffic, we’ll add the Session source as a secondary dimension.
Click on the + plus sign.
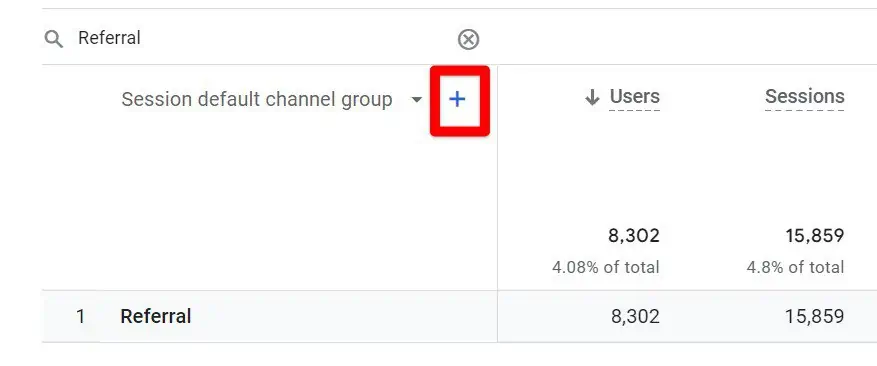
Then select Traffic source and then Session source.
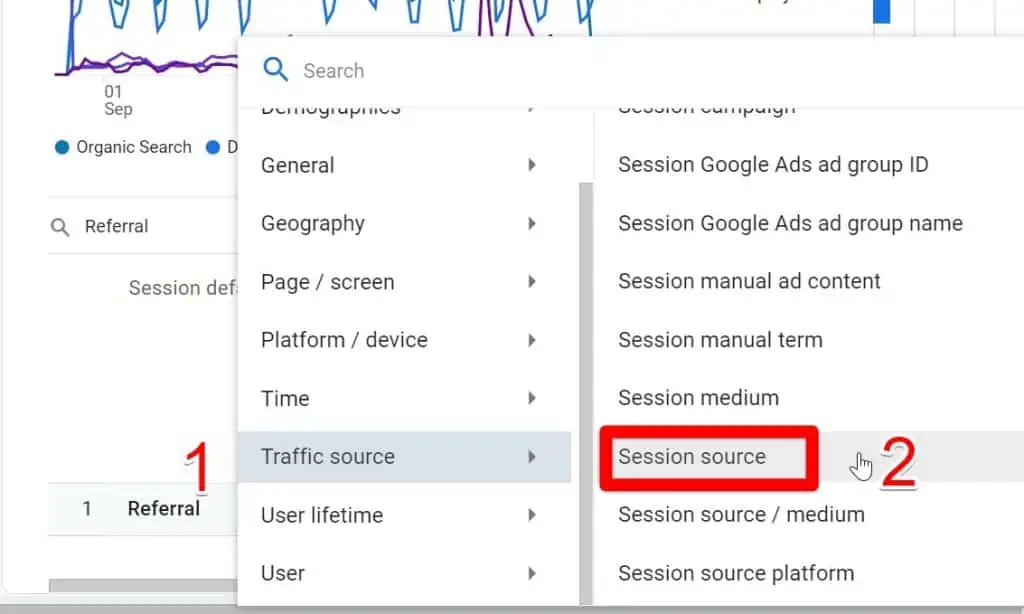
This is the result you’ll get:
4. Landing Page Report
The landing page report shows the first pages users see when they land on your site.
The purpose of this report (and this applies to SEO) is to get a picture of the first impression users have of your website. This helps you to understand what areas (type of content) they pay more attention to, which helps us find opportunities to grow traffic.
Here are some ways you can spot and exploit these opportunities.
Check the top 10 pages (many articles focus on the top 10 pages, but you don’t have to stop there), then, look at the pages that are performing well according to the metrics relevant to you (revenue, engagement, number of views or sessions, etc.).
🚨 Note: Often the top 5-10 pages are enough as they cover most of the pages users land on first. However, you can use what you learn from them and improve other pages, or find those that are not performing as expected.
Take note of the pages that are working well and their trends. The objective is to find what is working and produce more of it and discontinue what doesn’t. With regards to trends, these are usually groups of content that spark your audience’s interest.
Make sure to place your offers (promotions, lead magnets, news, etc.) on the pages that bring the most traffic. Include links to other articles on your website to keep users engaged.
Pages with low traffic or engagement can also present conversion opportunities. A good practice is to compare them with outperforming landing pages and see how to improve them.
When it comes to content and SEO analysis, consider setting a longer date range from 6 months to 1.
How Do I Get a Landing Page Report in GA4?
Unlike the previous version of Google Analytics, also known as Universal Analytics or GA3, the landing page report is not provided by default in GA4.
For this reason, you’ll have to build this report yourself with GA4’s Explorations. If you’re familiar with Explorations, then follow the following configuration on the image:
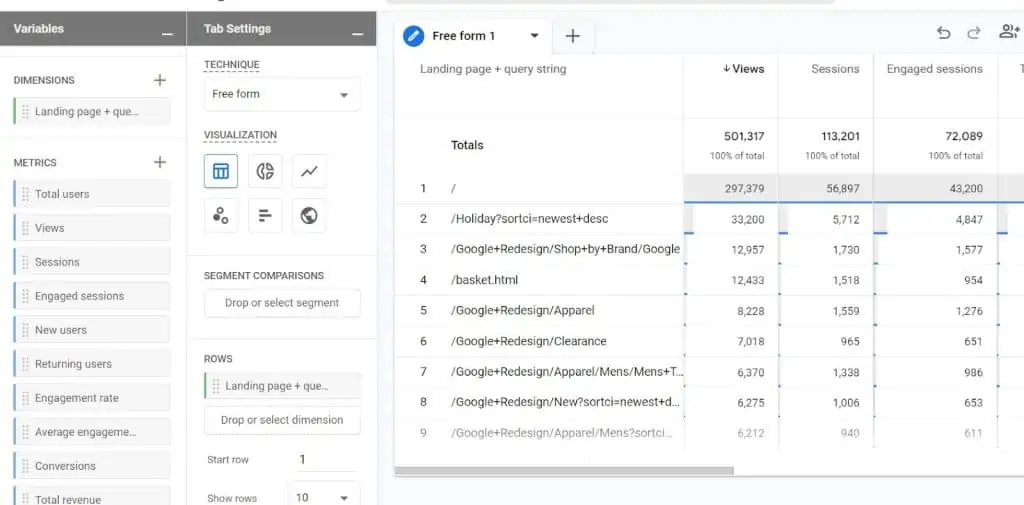
For dimension, search and import the one called the Landing page.
If you’re having issues with Explorations, we’ve detailed step-by-step how to build one to report 404 errors. The mechanism is the same.
5. Google Search Console
The first step before starting your analysis is to connect Google Search Console to GA4.
Once both are integrated, organic search results (such as queries that lead to clicks to your site, or site ranking in search results) can then be investigated further across GA4’s analytics features.
After that, two new reports will be added:
- Organic search traffic report
- Queries report
We will explain these reports in more detail.
🚨 Note: You can rename them as you wish.
The Organic search traffic report shows landing pages linked with Search Console and GA’s metrics. This is the reason why some find it more meaningful to rename this report as ‘Search Console Landing pages.’
You can further your examination by looking at the countries and devices associated with its records.
The report includes the following SEO metrics:
- Organic Google search clicks
- Organic Google search impressions
- Organic Google search click-through rate (CTR)
- Average search position
In the Queries report, you will find search queries linked with Search Console metrics. The limitation here is that you can only drill down the data with Search Console dimensions and not those from Google Analytics.
Both tools appear to have similarities, but they do differ. Read the Google Search Console vs Google Analytics 4 to tell the differences and similarities.
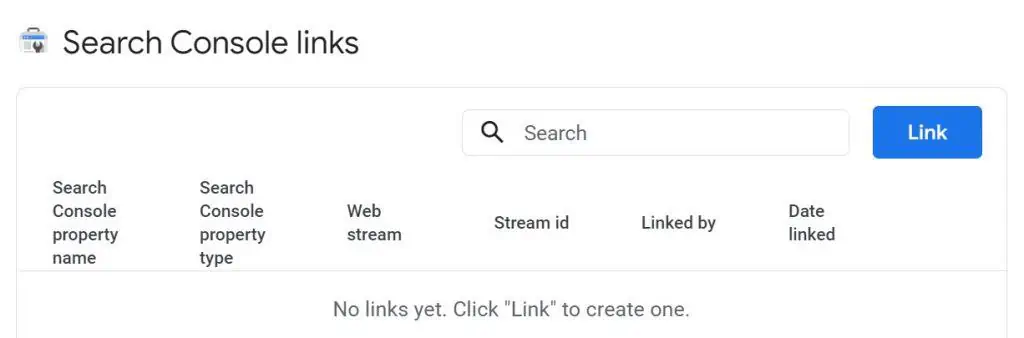
How to Connect Search Console to GA4
In Google Analytics, go to Admin → Property
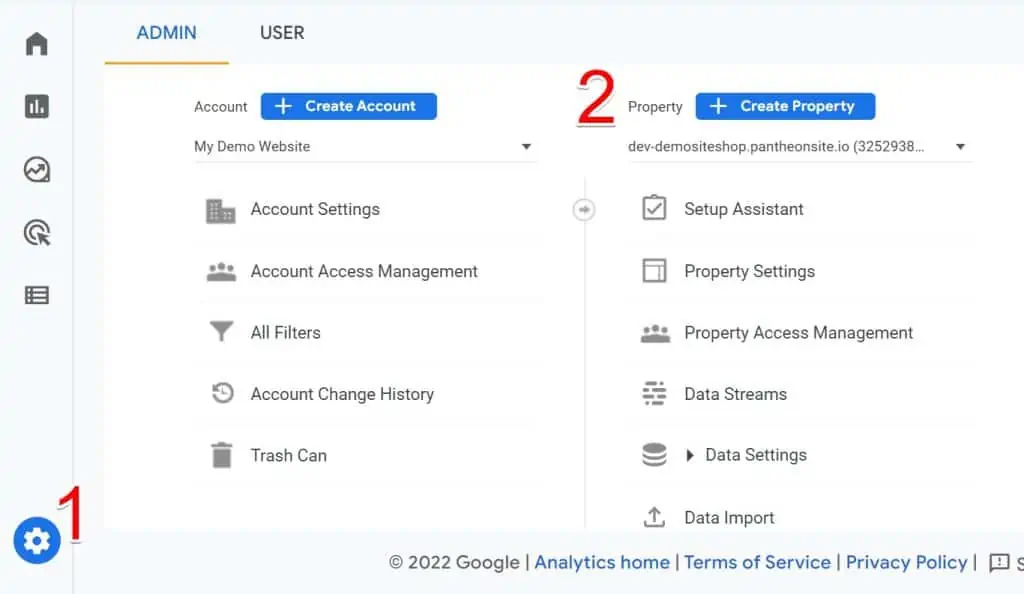
Under Property, scroll down a little and you’ll find the Products Links section. Select Google Search Console Links.
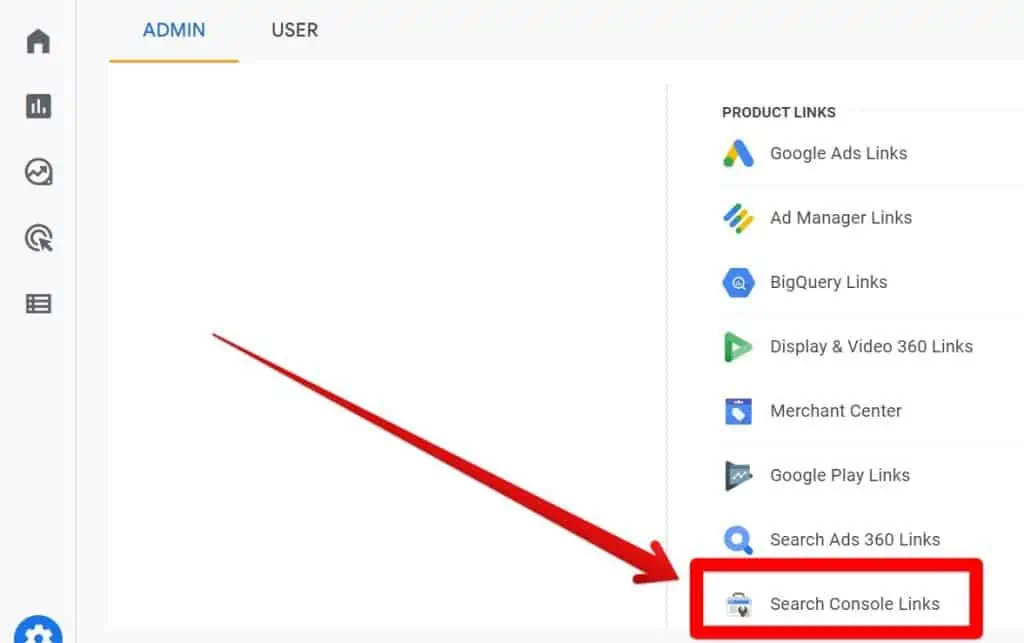
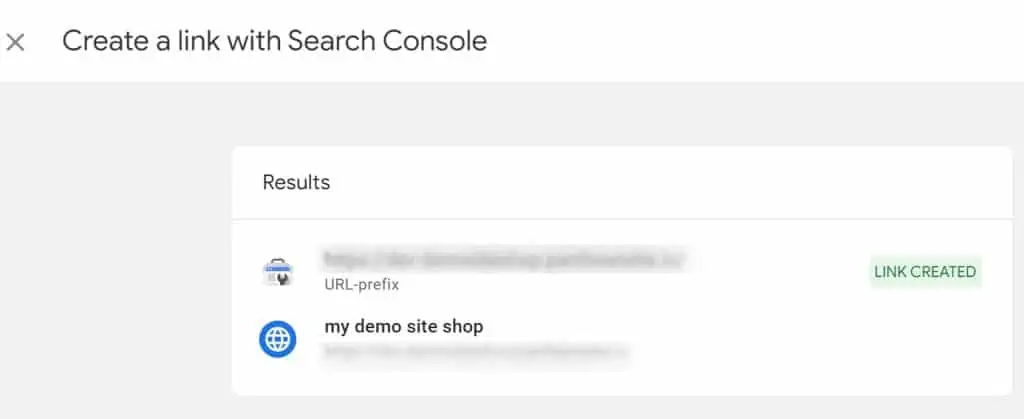
Click on the Link.
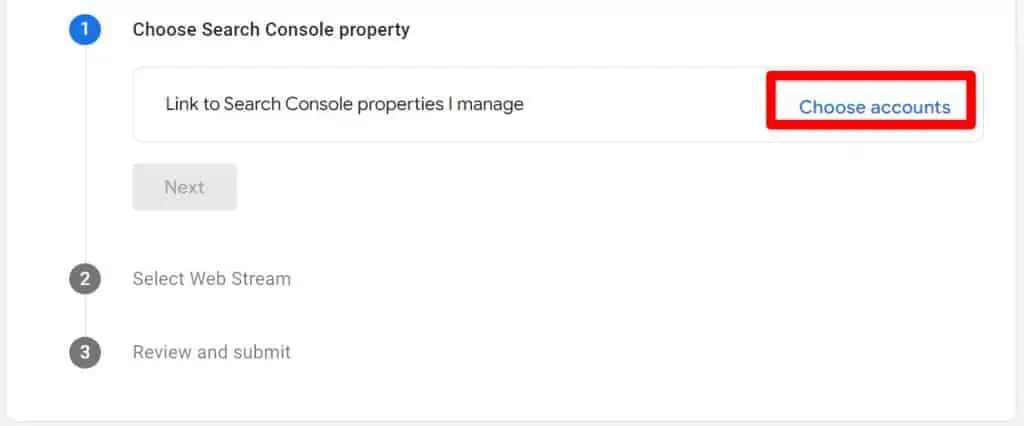
Click on Choose Accounts.
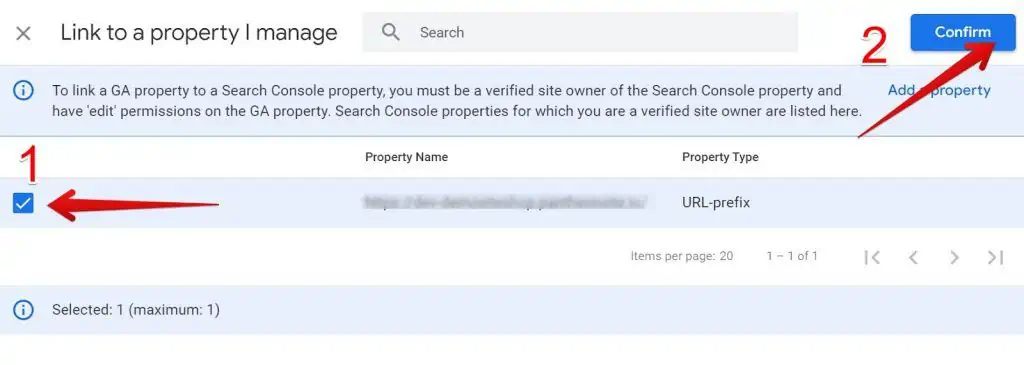
Select the property (website) that you’d like to connect with and click on Confirm.
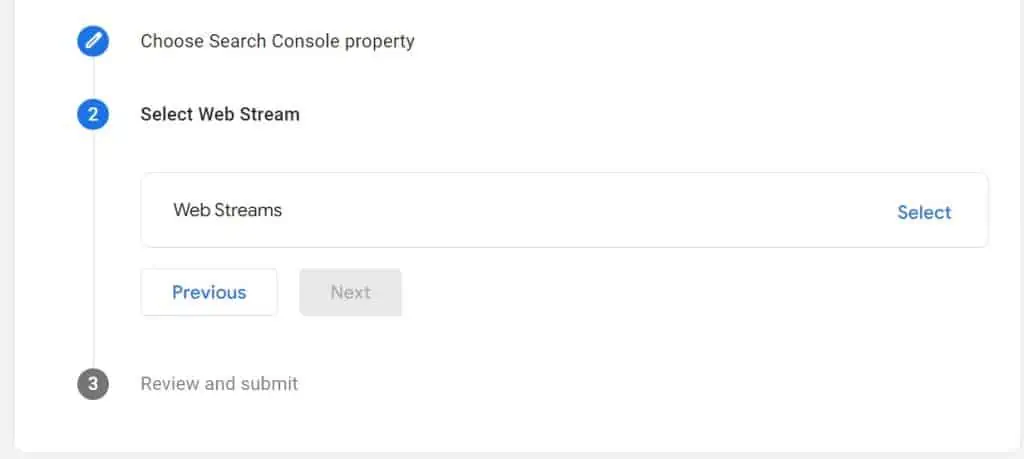
You’re left with two more steps. For the second step, make sure to select the data stream (which is our website connected to Google Analytics) and click Submit in the third step after reviewing your selection.
This is the confirmation you’ll get.
🚨 Note: You won’t see Search Console data show up immediately. You’ll have to wait around 24 hours.
6. Site Speed Report
Site speed affects rankings.
Your users expect web pages to load quickly. Therefore, longer load times hurt their experience and you as the website owner, since they are less likely to return or complete a conversion.
Unfortunately, this report, which was available in Universal Analytics, is not available in GA4.
The good news, though, is that this report can be recreated in GA4 through tools like Google Tag Manager or BigQuery. David Vallejo provides both solutions in his post on Performance Timing tracking with Google Analytics 4.
Some metrics from the Site Speed Report are:
- Site Speed
- Average Page Load Time
- Average Server Response Time
- Average Page Download Time
The part with BigQuery will certainly confuse you if you’re not familiar with the interface, how to connect with GA4, and a bit of SQL.
In that case, the solution with Google Tag Manager is more practical. But you’ll need some working knowledge of GTM and sending events to GA4.
Don’t let the Javascript code intimidate you. Just follow the simple configuration procedure.
🚨 Note: Check out our handy guide and learn to track page load time with GA4.
7. Track User Retention
There are higher chances for returning users to achieve a conversion (e.g., making a purchase or completing a form). Returning users are warm traffic and therefore easier to convert.
Therefore, you want to increase the number of returning visitors to your site.
GA4 has its Retention report that you can see in Reports Monetization Retention
Opinions diverge on this report. Some find it useful, whereas other experienced marketers don’t.
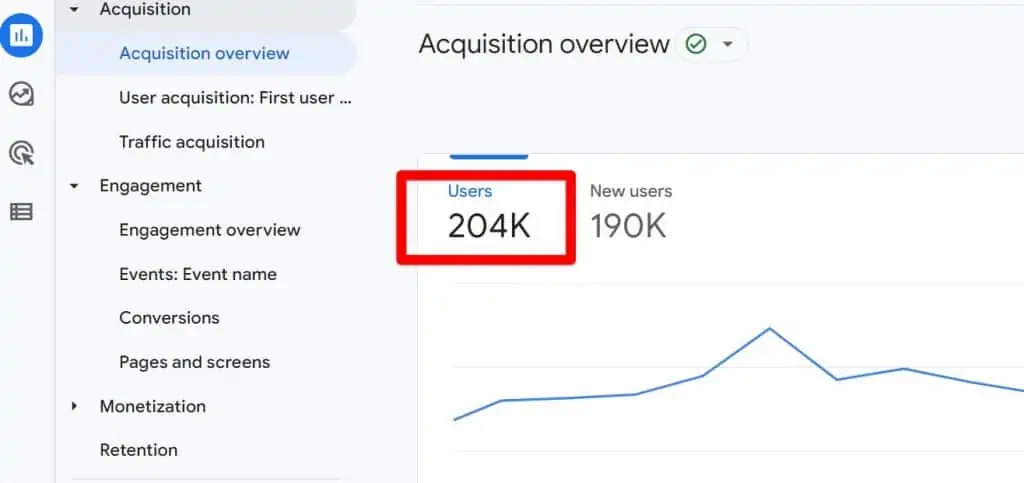
What you can do though, is to find the ratio of New vs Returning users and measure it against a benchmark if you have one, since not all industries coincide.
Here is the formula for Returning visitors:
Rate of returning visitors (RVR) = number of returning visitors in a given period / Total unique visitors
You could reproduce this calculation using GA4’s numbers. The number of total unique users can be found in the Acquisition overview.
As for what period to look at, you should adjust it based on your needs and situation. Typically, user retention is something you want to monitor over time. Often user retention is calculated on a weekly, monthly, quarterly, and yearly basis.
It is said that the ideal ratio would be 50% which is rare and also not needed for every website. As a general rule, 30% is considered a good returning visitor rate, anything below could be considered bad or needing improvement.
Hitting these numbers already or proving any increase in returning users (even if it’s below 30%) would indisputably demonstrate the effectiveness of your marketing campaign and in gaining customer/audience loyalty.
8. Mobile Report
When discussing SEO, it is impossible to ignore the use of mobile devices.
According to research, mobile internet usage has increased to the point where it now accounts for more than 50%, and in some cases 60%, of all Internet traffic worldwide.
It was inevitable for Google to release a mobile-friendly version of search results given the large number of consumers who do searches on mobile devices.
Here’s an excerpt of what was posted on the Google Search Central Blog:
“We’re boosting the ranking of mobile-friendly pages on mobile search results.”
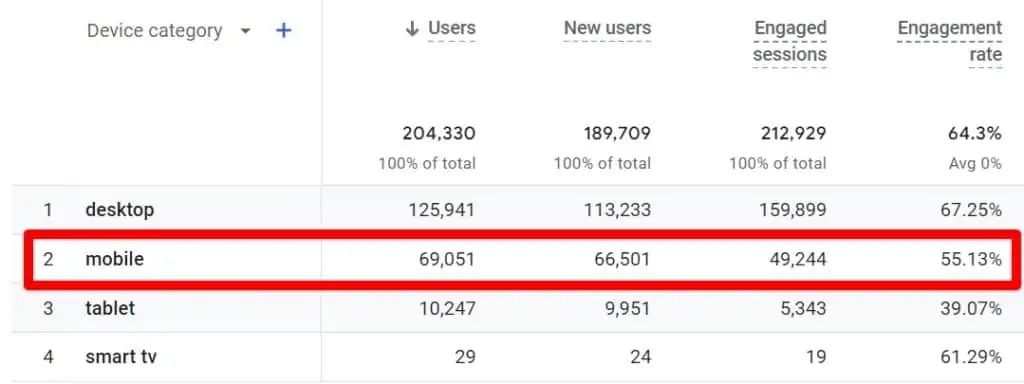
Once you’re in GA4, compare your mobile data with engagement metrics. For example, high bounce rates for the mobile category may indicate that your site is not mobile-friendly.
To understand how mobile users experience your site, go to Reports → User → Tech details
Scroll down to get to the table and change the primary dimension from Browser to Device category.
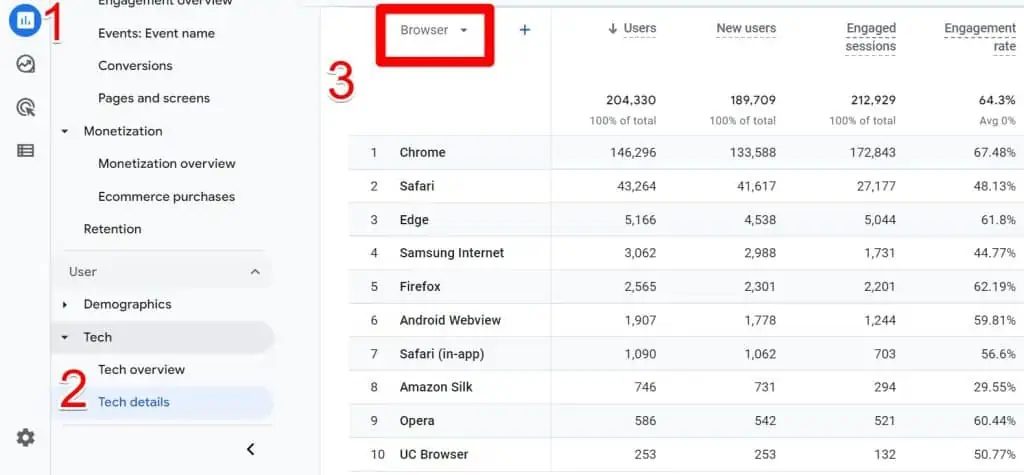
To change the dimension, click on the primary dimension or the little dropdown arrow, then select the Device category.
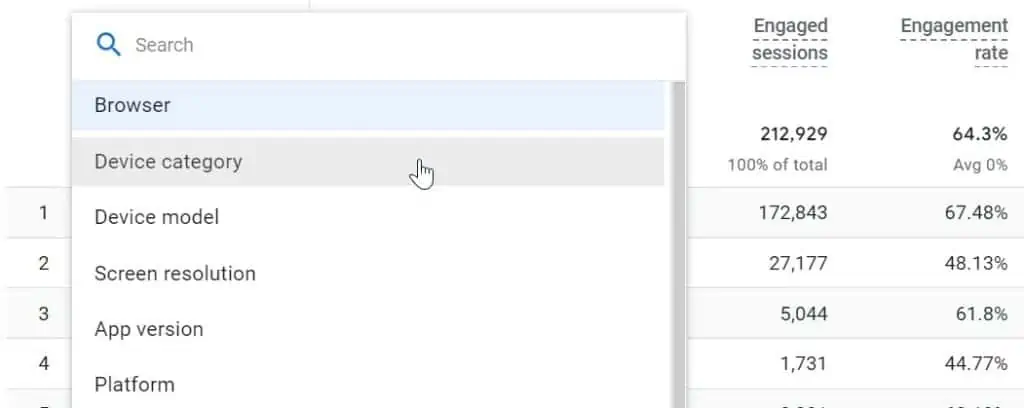
Here is the device category table:
9. Report Snapshot (Automated Insights)
SEO can only take advantage of the advances of AI which GA4 also offers with Analytics intelligence.
GA4’s artificial intelligence can recognize abrupt changes in your data and notify you about your site’s anomalies. The Analytics insights combine the advances of machine learning and allow you to feed into your conditions.
Let’s state right off the bat that GA4’s AI can do a job at answering the what, but not the why. The advantage is that you can view a snapshot of anything out of the norm.
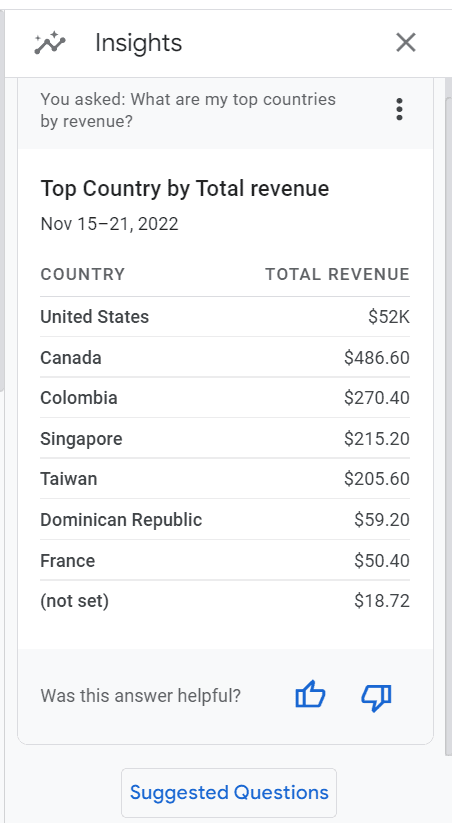
If that’s not enough, you can ask questions you want yourself.
Insights are delivered in 2 manners: Automated Insights and Custom Insights.
Automated Insights
Here GA4’s analytics intelligence does the job for you as it detects unusual changes and growing trends in your data. For example, it can detect if your traffic suddenly increases or decreases.
It will then automatically notify you of these changes and how significant they are.
Custom insights
Here you configure conditions that are important to you, which means they can be SEO-oriented. The analytics intelligence will notify you when these conditions are met.
Both Automated Insights and Custom insights are generated in real-time and presented in what is called Insights cards. Each card can be clicked on to get more info.
There are 3 ways to access these insights.
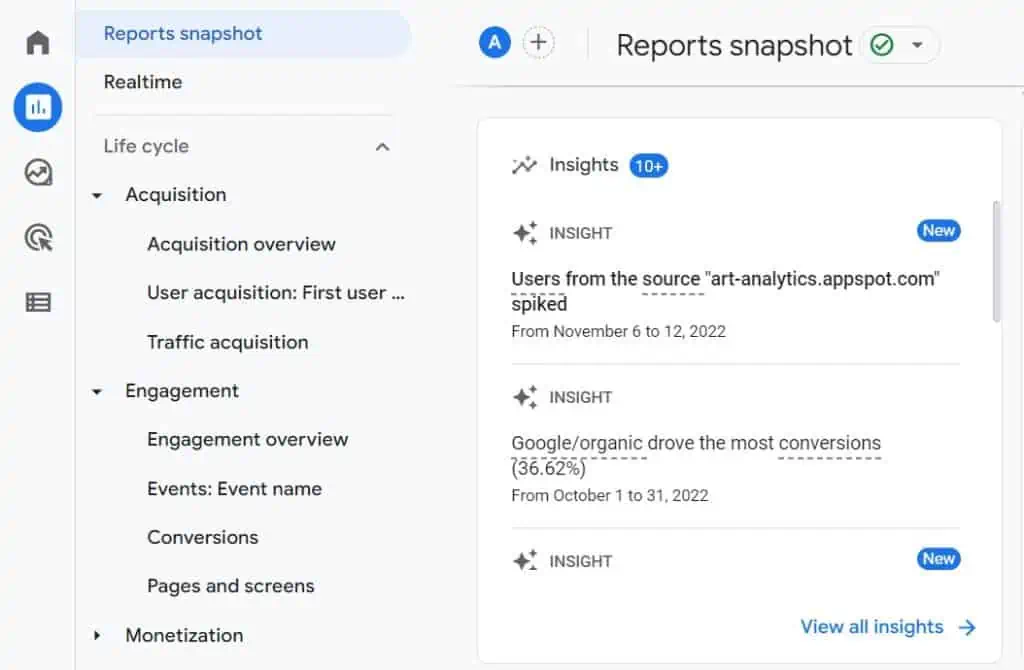
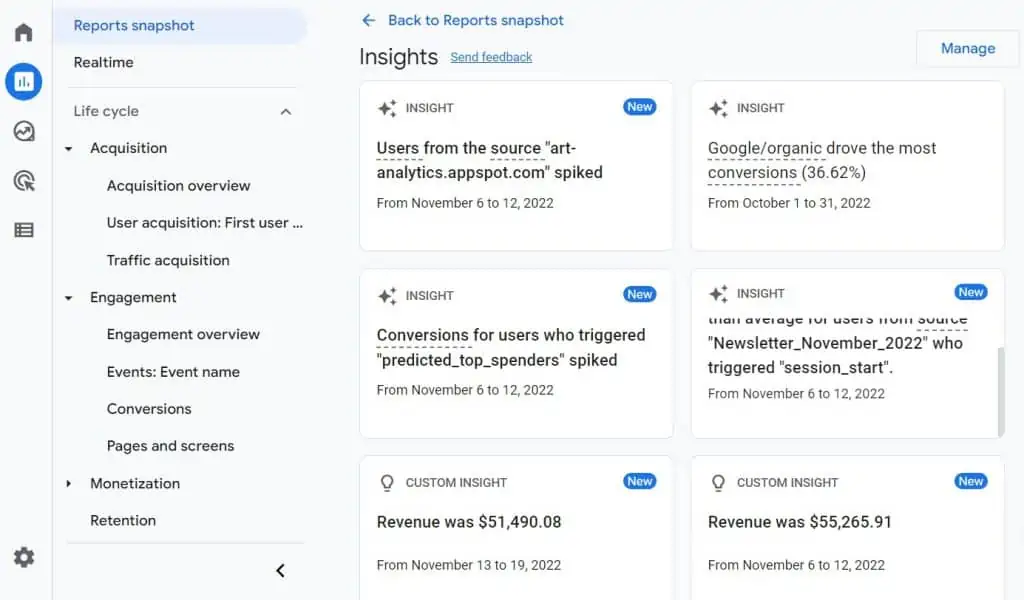
The first two are within the Reports Snapshot.
Scroll down a little and you will see the main Insights card. You can either click any insights listed there or View all insights.
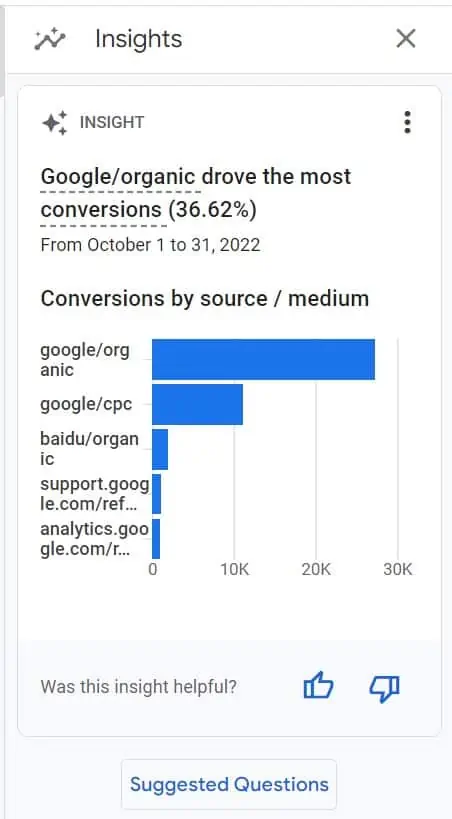
To illustrate, let’s choose the second Insight Google/organic drove the most conversions (36.62%).
A card will appear on the right with more details.
The other way to access Insights in the Reports snapshot is by clicking View all insights.
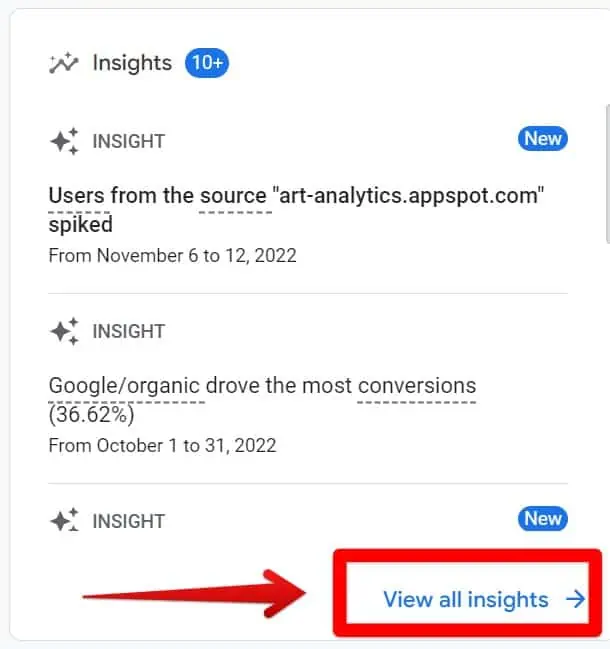
You’ll be taken to the full list of Insights cards.
You also have the option to access any insights by clicking on the Insights icon at the top right corner of every report in GA4.
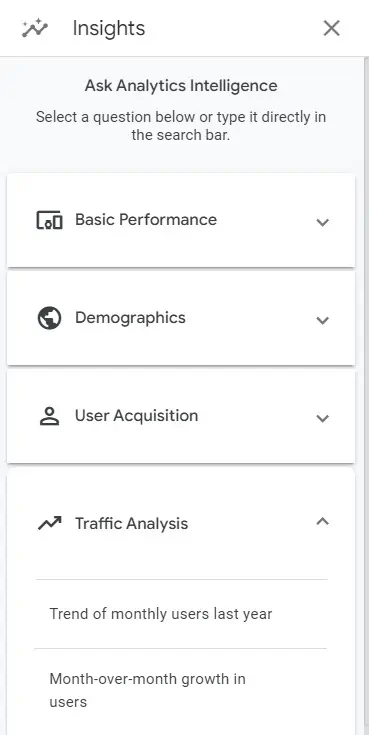
The third way is to use the search box:
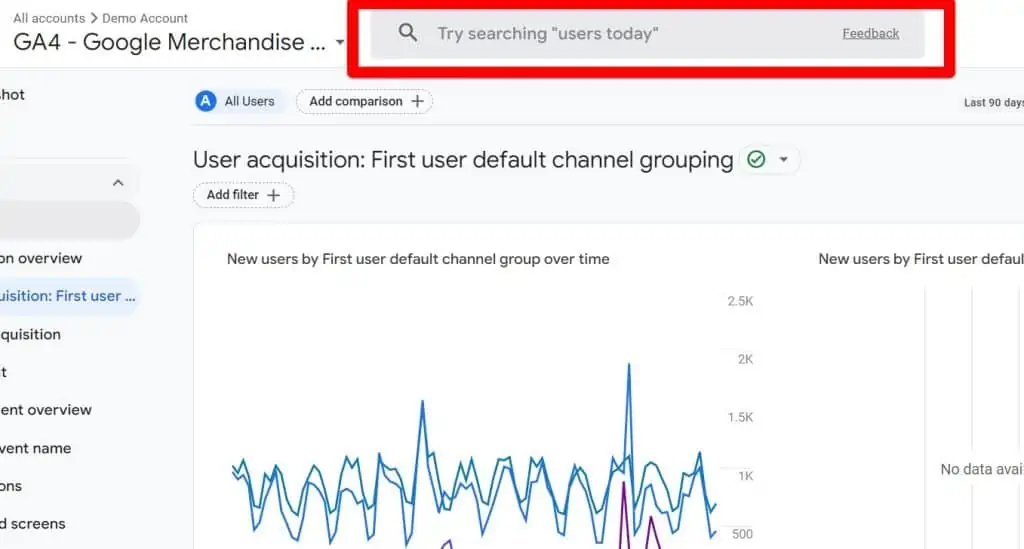
You could type simple SEO-related questions like ‘how much traffic from organic search’.
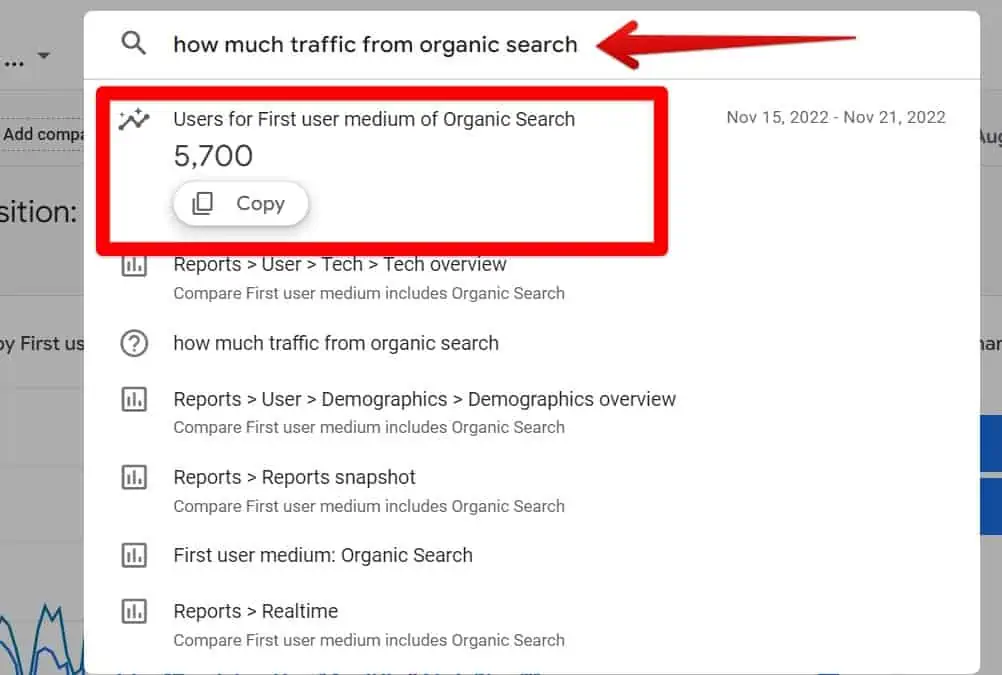
You’ll be presented with a list of suggestions. If you don’t find a relevant answer, other links on the list can send you to helpful resources or directly to the reports that can help you find your answer.
🚨 Note: You’ll notice that all Insights have a Suggested Questions button. By clicking it, you’ll have the option to get more detail on a list of pre-selected common questions.
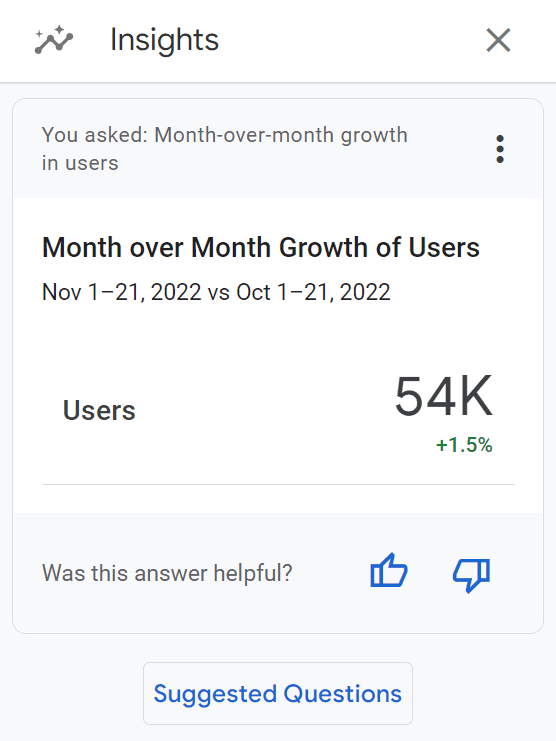
Then select a question of interest. I want to look at Traffic Analysis and see the Month-over-month growth in users.
Then here’s how your answer will be displayed:
10. Looker Studio
This list of SEO reports focused on GA4. However, it would be a disservice at this point to not mention Looker Studio (previously known as Google Data Studio).
🚨 Note: If you’ve never heard of Looker Studio before, you can learn what it’s all about it in our Looker Studio guide.
GA4 may be more than enough to conduct your analysis and has visualization capabilities. However, understanding how to read its reports correctly or build explorations may not be easy for someone jumping in GA4 the first time.
Looker Studio is the perfect companion to GA4. It allows you to combine data from multiple sources into one place and build attractive and comprehensive dashboards.
Having metrics displayed in the way you prefer means speeding up your analysis and limiting repetitive tasks.
If you enjoy visualization, then make sure to visit our blog to step up your game. We cover quite a lot of relevant Looker Studio/Google Data Studio topics there.
The good news is that you don’t have to reinvent the wheel.
The Report Gallery provides many free top-notch templates you can use for your SEO needs. You can either use them immediately simply by plugging in your data source, or you can use them just for inspiration.
For example, here’s the beautiful All-in-one Search Console Template by Data Bloo. However, to fully use this template you’ll have to provide your email.
FAQ
How can I create a landing page report in Google Analytics 4?
Unlike the previous version of Google Analytics (Universal Analytics or GA3), the landing page report is not provided by default in GA4. To create a landing page report in GA4, you need to use GA4’s Explorations feature and configure it to include the Landing page dimension.
How can I track user retention in Google Analytics 4?
In Google Analytics 4, you can track user retention using the Retention report. By analyzing the ratio of new vs. returning users and measuring it against a benchmark, you can monitor the effectiveness of your marketing campaign and customer/audience loyalty.
Is the Site Speed Report available in Google Analytics 4?
No, the Site Speed Report is not available by default in Google Analytics 4. However, it can be recreated in GA4 using tools like Google Tag Manager or BigQuery.
Summary
We’ve done our best to show you where to find GA4’s reports to boost SEO and how to build some of them.
However, to succeed in your SEO optimization process, you must know which metrics to focus on and understand them clearly to conduct relevant analyses.
The new AI tool called ChatGPT has completely changed everything! Find out how to utilize ChatGPT with Google Tag Manager to make your tracking more efficient.
Hope this helps. See you later, measure geeks!
Master the basics with our FREE GA4 Course for Beginners


")