
Last Modified on January 7, 2025
Realtime reports are often overlooked in analytics but can be useful when it comes to making quick decisions and staying ahead of everyone.
Google Analytics 4 allows businesses to monitor user behavior on their website in real-time and gain valuable insights into their website’s performance.
However, using the GA4 Realtime Report can be intimidating for those who are entirely new to the platform or have switched from UA but are struggling with the new UI.
In this definitive guide, we’ll walk you through the ins and outs of the GA4 Realtime Report, from understanding the interface to interpreting data and troubleshooting common issues. We’ll cover the following topics:
- What Does the Realtime Report Mean in GA4?
- GA4 Realtime vs UA Realtime Report
- Why Use GA4 Realtime Report?
- Understanding Insights Cards
- Limitations of GA4 Realtime Report
By the end of this guide, you’ll be equipped with the knowledge to use the GA4 Realtime Report effectively and make informed decisions in real-time. Let’s jump in!
What Does the Realtime Report Mean in GA4?
It simply means that you can see what users are doing on your website as it happens during the previous 30 minutes – which you can also see on a per-minute basis.
Even so, sometimes there can be a little delay for the data to flow in. The report is different from the other GA4 reports, which are updated later on with certain info like custom dimensions taking up to 24 hrs.
The cards are laid out to show you how users enter your conversion funnel and how they act once they are in it.
You can find the following data in your real-time report:
- What devices they are using, i.e., desktop, mobile, or tablet
- Where your users are coming from, i.e., source, medium, or campaign
- Who your users are, i.e., audience
- Type of content the users engage with, i.e., page title and screen name
- Events triggered by the users, i.e., event name and count
- Conversions completed by the users
- Users by user property (only applicable if configured)
But how is it all different from the real-time report in UA? Let’s have a look at that.
🚨 Note: You can now get your reports sent to you via email on a scheduled time basis. Learn more about the GA4 scheduled reports feature!
GA4 Realtime vs UA Realtime Report
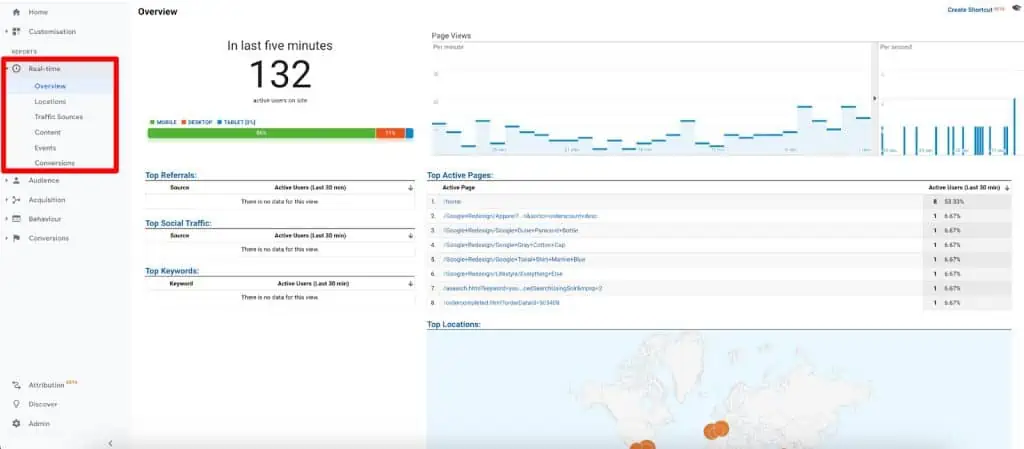
In UA, the Realtime report found on the left navigation under Reports is divided into six sections, i.e., Overview, Locations, Traffic Source, Content, Events, and Conversions.
In GA4, there’s a single Realtime report in the left navigation with more up-to-date visuals that matches the overall theme of GA4 reporting in general, as well as being more interactive.
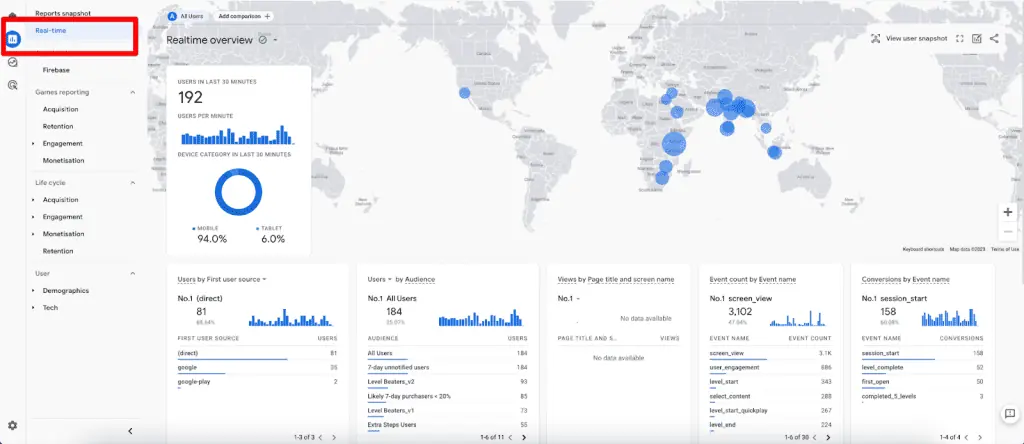
You might get confused with the Reports snapshot above the Real-time, but that’s the snapshot or home of all the other reports. Looking closer, you can tell that similar sections in UA are now being presented as interactive cards in GA4.
You can interact with these cards by changing dimensions (not applicable to all), clicking on individual items to view more details (not applicable to all), and/or hovering over items.
For instance, if you hover over the circles on the map, you can see data related to that region/city.
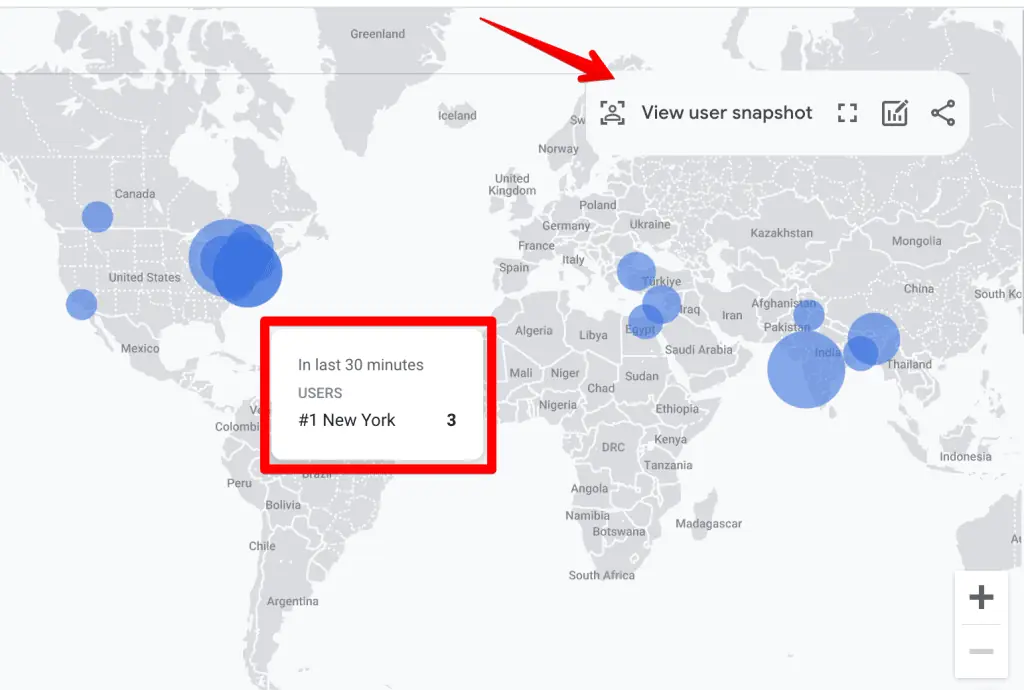
In the screenshot above, at the top right corner of the map, you can also see something new to GA4, View user snapshot.
This shows a random user’s actions in a timeline in the left and center, as well as with their top events and user properties on the cards at the right.
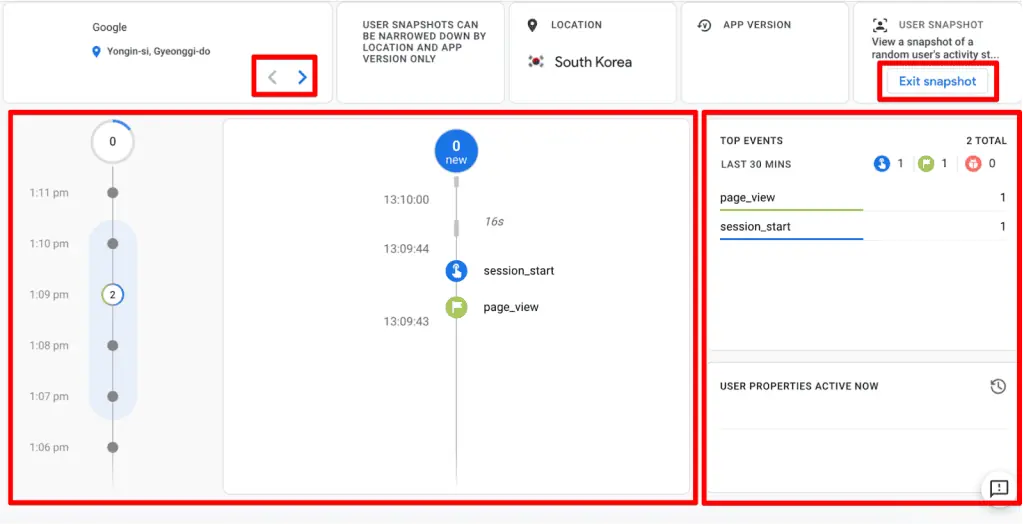
If you click on the top left arrows < > then you can toggle between users from different locations. To go back, simply click on the Exit snapshot button in the top right corner.
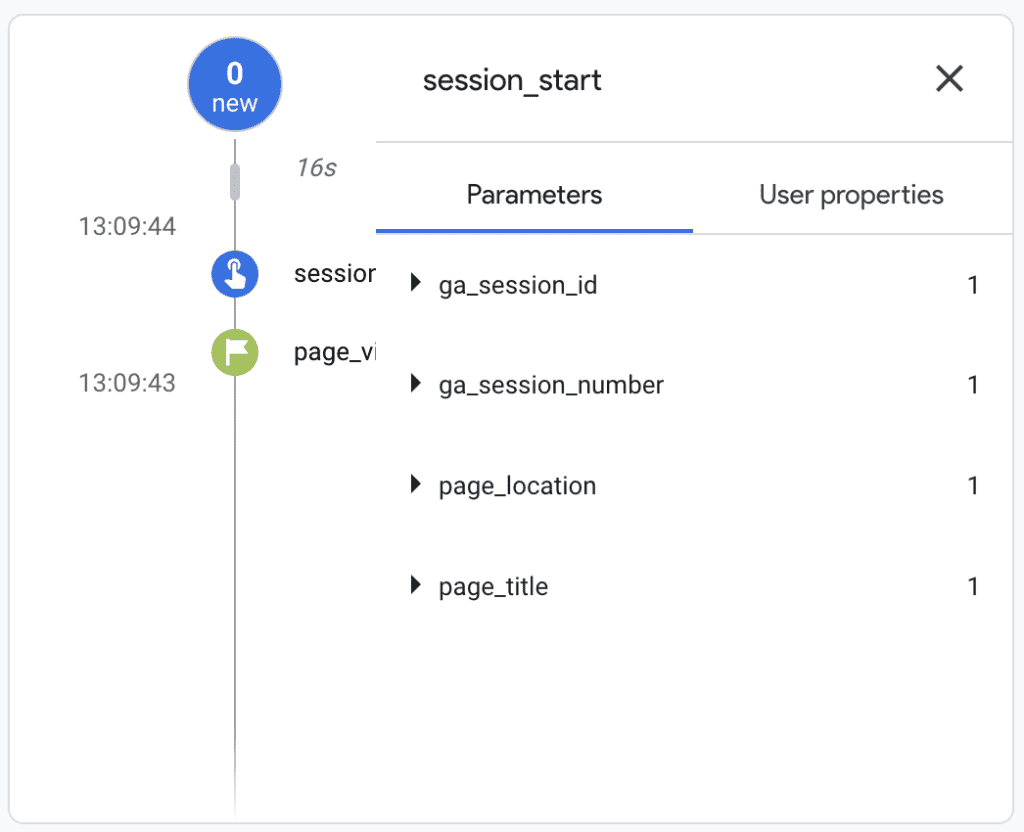
Click on the timeline in the center to pause, so you can easily navigate through it, or simply click on any events triggered by the user. E.g., if you click on session_start event, you can see event parameters and user properties (if configured).
But why select a random user? If you’re able to identify a user and select them, then that goes against the privacy rules!
Right next to the View user snapshot is the icon to go to Full Screen, which wasn’t available in UA. Given that we work with multiple screens and quickly navigate from one report to another, I’m not sure how useful it will be.
The icon next to the Full screen says Edit comparison if you hover over it. It’s also unique to a GA4 Realtime report where you can compare four types of data sets.
Clicking on the icon opens up a Customise report panel on the right. By default, All Users are selected to compare with, but you can click on the three dots to modify this data set by clicking on Edit comparison.
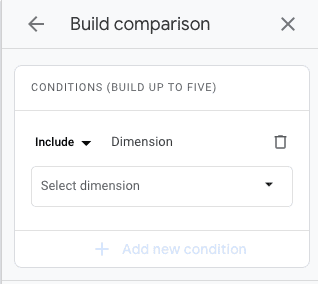
Below All Users, you will see the Add new comparison button that leads to the Build comparison interface, where you can use up to five include/exclude conditions for your filter.
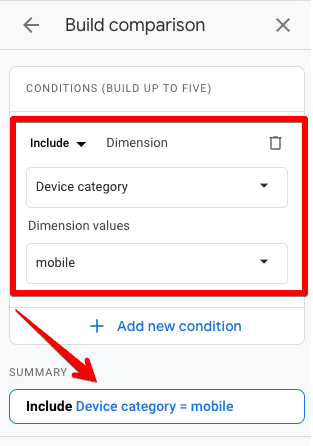
Let’s try a simple one by comparing mobile users with All users.
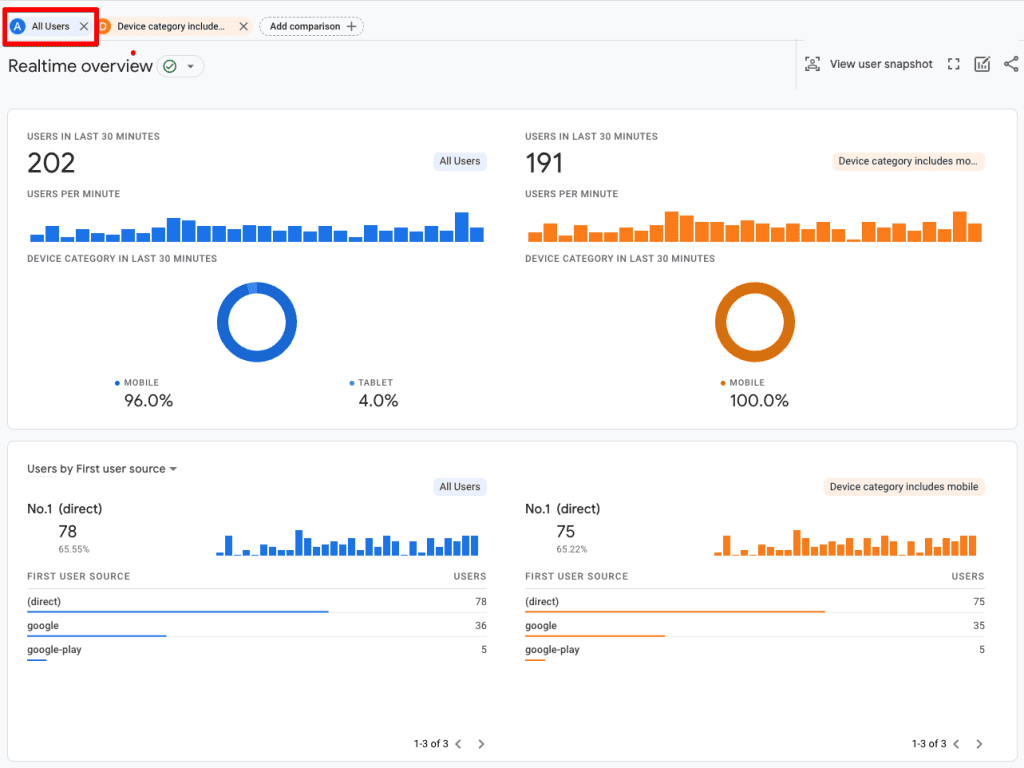
Once you Apply the filter, you can see the side-by-side comparison in blue (All users) and orange colors, but the location map disappears.
If you want to see only mobile users, then you can simply click on the cross for the All users filter on the top left corner of the report.
If you’re wondering what the data sets would look like, then here’s a quick overview of the comparison between All users and device brands, i.e., Google, Apple, and Samsung.
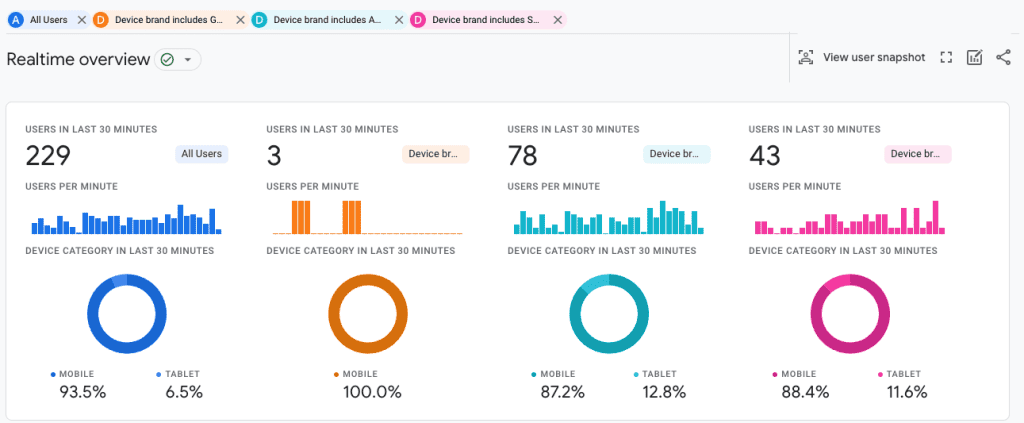
Nice and colorful, right? Coming to the location map, in UA when you click on any location, it filters the data for that specific location only. But in GA4, it goes into comparison mode as above.
For instance, when we click on the city of Lisbon in UA, it shows data for Lisbon only.

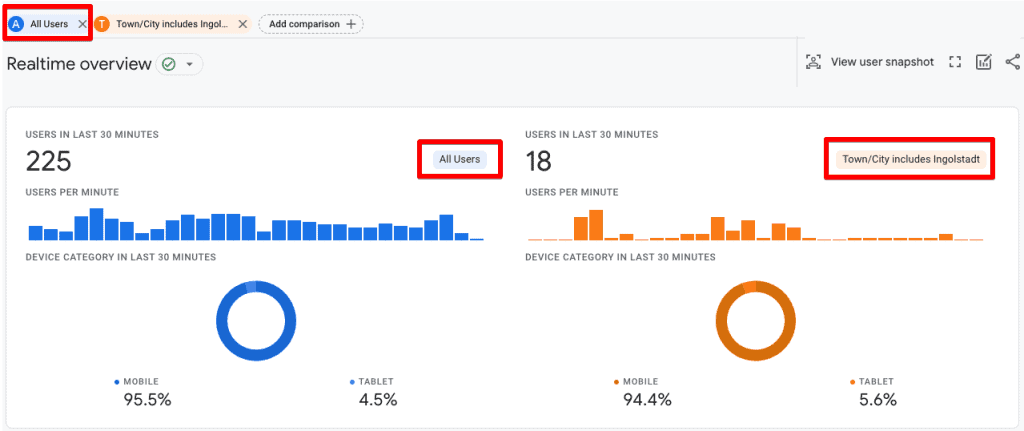
But when we click on the German city of Ingolstadt, it automatically compares it with All users.
As mentioned above, once you remove the ‘All users’ filter at the top left corner of the report, you can see data for that region only – which in this case is Ingolstadt.
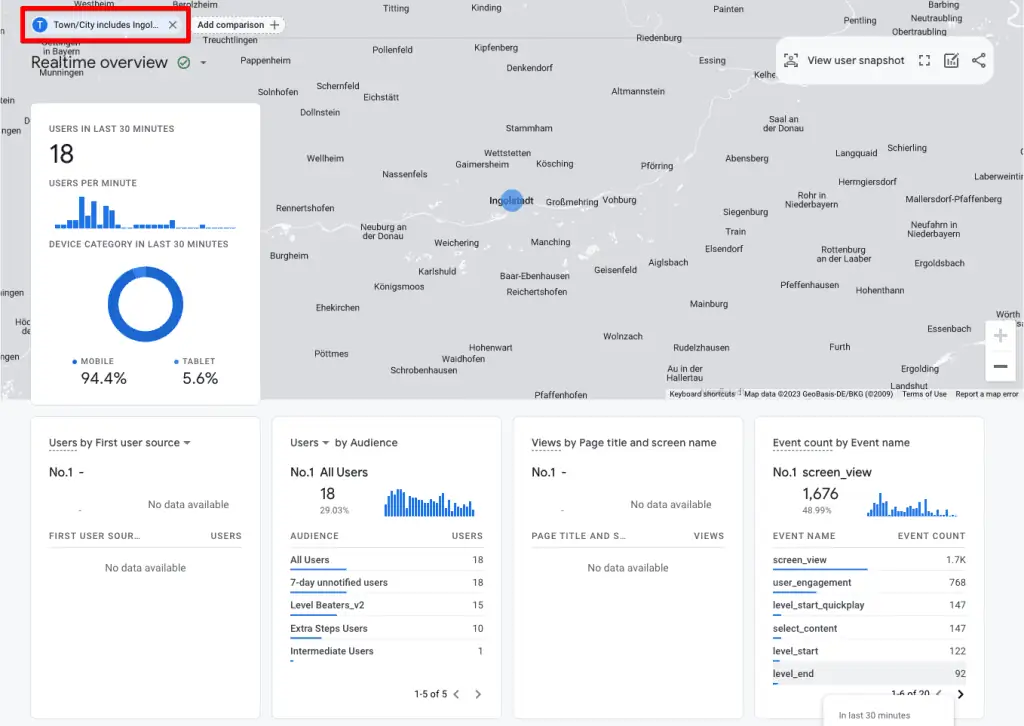
Everything turns to default blue and you can see that the map returns when only one filter is applied.
All in all, there are some good improvements over its predecessor in terms of visuals, interactions, and some other cool stuff like random user snapshots but we’re not done yet with exploring the real-time report.
Why Use GA4 Realtime Report?
There could be several reasons for you to use the Realtime report, but the following three scenarios can give you a good idea of its use case.
Scenario # 1 – You are a marketer who recently launched a campaign and wants to ensure that all are tagged properly and everything else is working as expected. So, using the Realtime report will help you to quickly catch any mistakes in time before you go on with the full-on launch.
Scenario # 2 – You are a content creator who wants to see the performance of recently published content and wants to adjust, in time, if there are any issues with your content. The Realtime report can come in handy!
Scenario # 3 – You’ve implemented some tracking changes and want to QA the data you’re receiving so that you can correct any issues in time and not let your analytics data get messy. In regards to tracking, the GA4 Realtime report can also be useful if you’re debugging any issues with the existing tracking setup.
These are not the only scenarios but are some of the common ones among others, so you can see what events and conversions users are triggering on what devices.
To cap it up, the GA4 Realtime report can be super helpful to catch any issues in real time and fix issues quickly rather than waiting for the data to update in the standard reports.
Understanding Insights Cards
So what about the insights cards from the GA4 Realtime report? Unlike the standard reports, the insights you can get from the Realtime report are limited and for a short period to act on, as there’s not enough historical data for context.
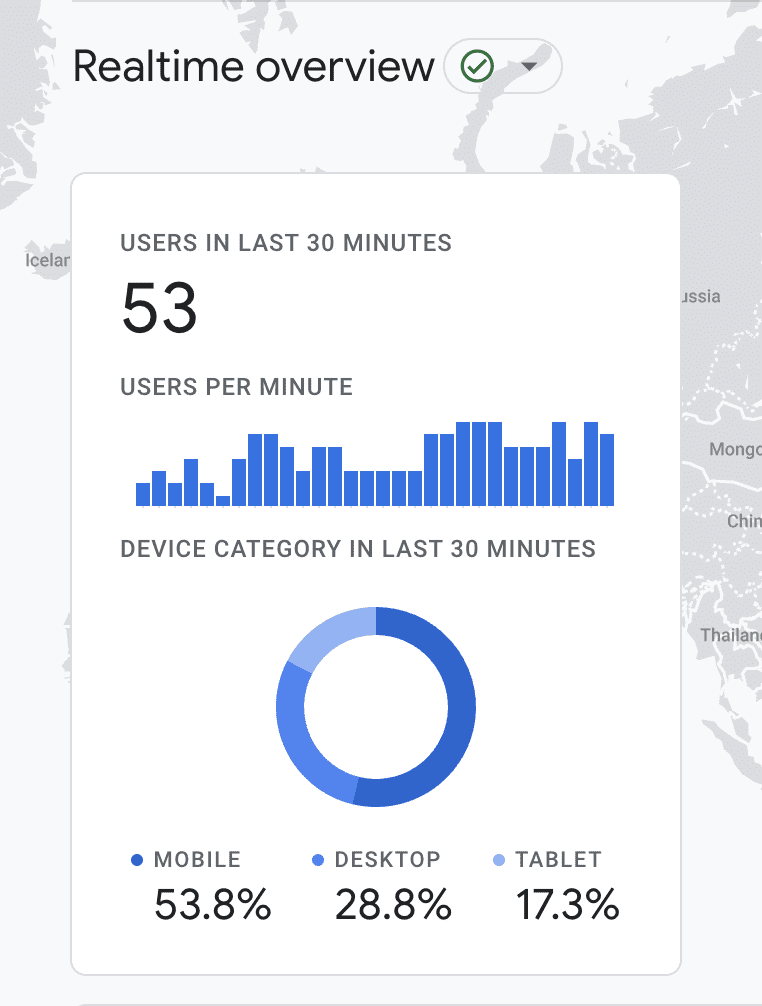
Nevertheless, let’s look into these cards starting with the first card on the top of the map that shows a summary of Users In Last 30mins, a breakdown of Users Per Minute, and the Device Category.
The Users by First user source card can be helpful to know what’s the traffic source of the users and to help you understand if the users are coming from the correct source or if you’re seeing a spike in the type of sources you shouldn’t be seeing.
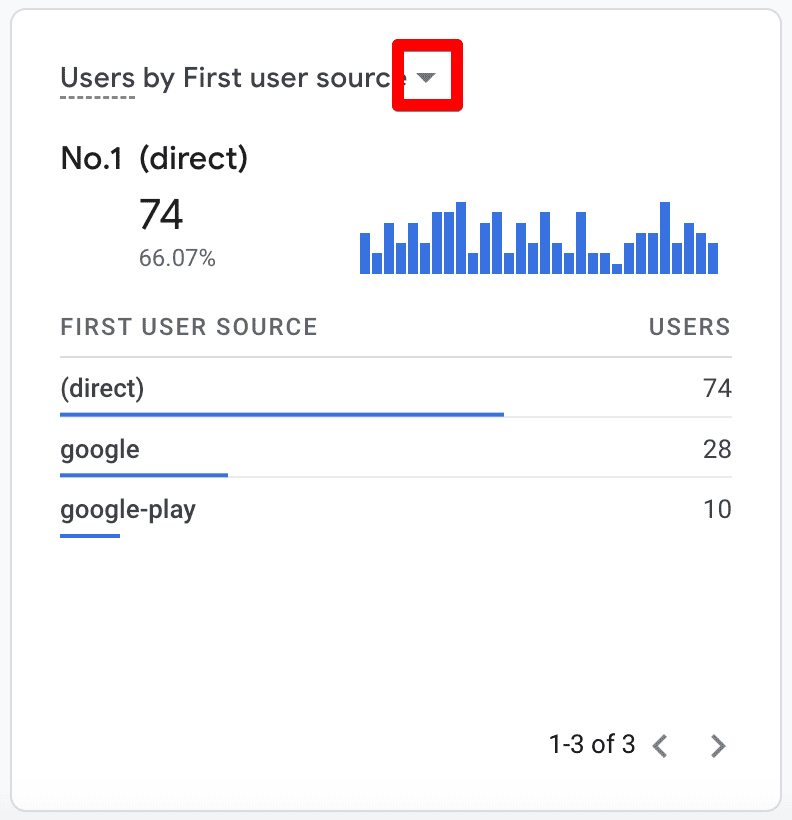
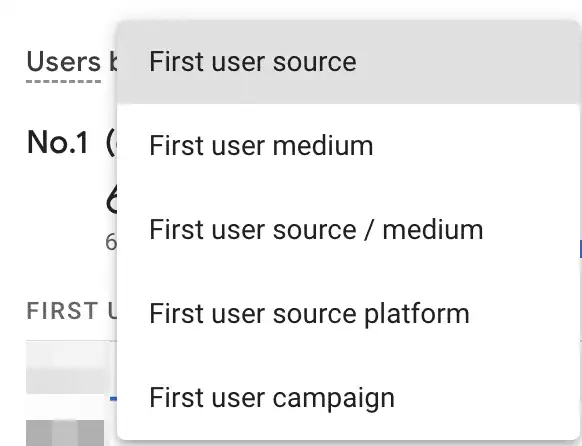
If you see the arrow in front of any dimension on the card, that means you have more options to choose from as highlighted in the screenshot above.
So for this user card, there’s also first user medium, source/medium, source platform, and campaign dimensions available.
The next card is about the Users and New Users by Audience, which is detected by GA4 based on any audience settings or targeting for ads.
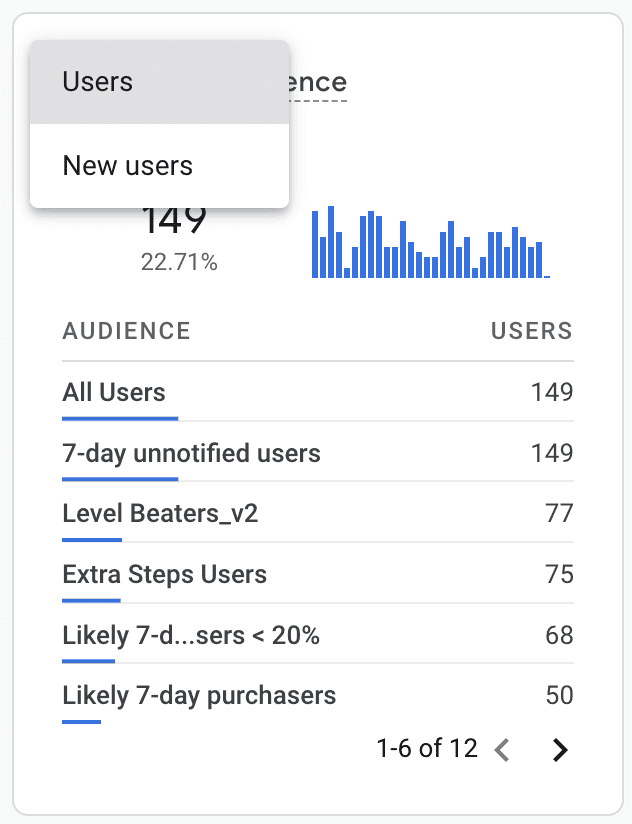
This could be helpful to ensure you see the correct audiences that you’ve recently started targeting in a newly launched campaign, but that’s about it.
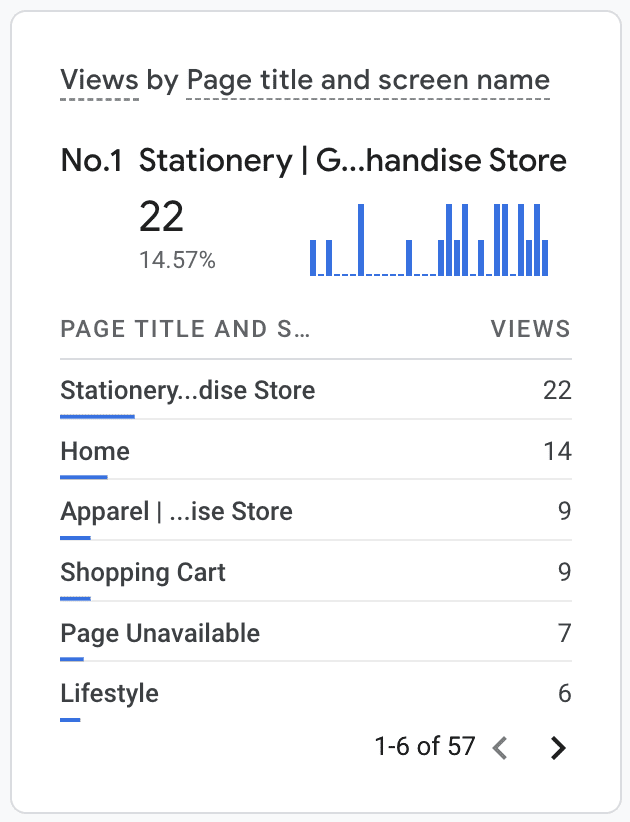
The Views by Page title and screen name card can come in handy to monitor any real-time performance of your content and to adjust anything if needed. Unfortunately, you cannot select any other metric apart from the Views.
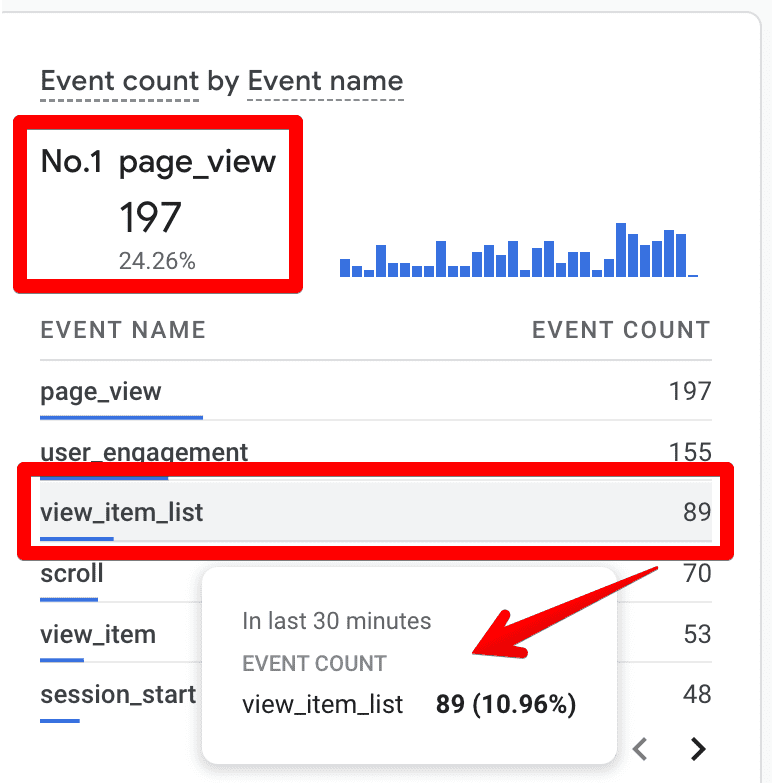
The next card is Event count by Event name, which shows all the events triggered (in the last 30 mins). If you’re expecting to see certain events triggered on the website, then you should see them here.
However, don’t forget to go until the end as it might not show in the top events.
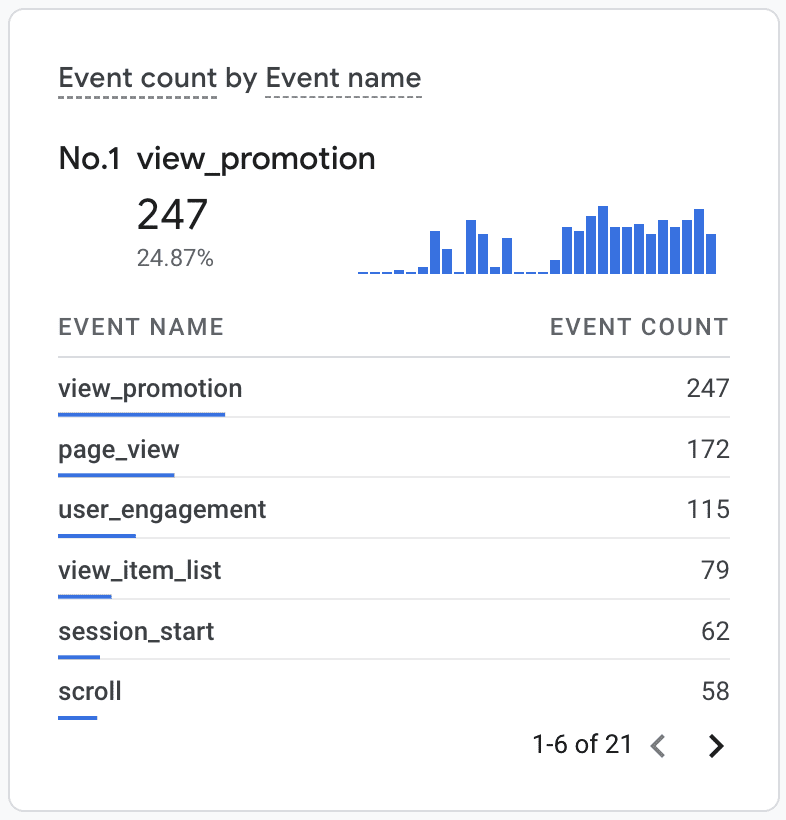
Understandably, this card also doesn’t allow you to choose any other metric other than the event count. However, you can click on the individual events to see more details like parameters and their value.
For instance, if we click on the view_promotion event, we can see several parameters.
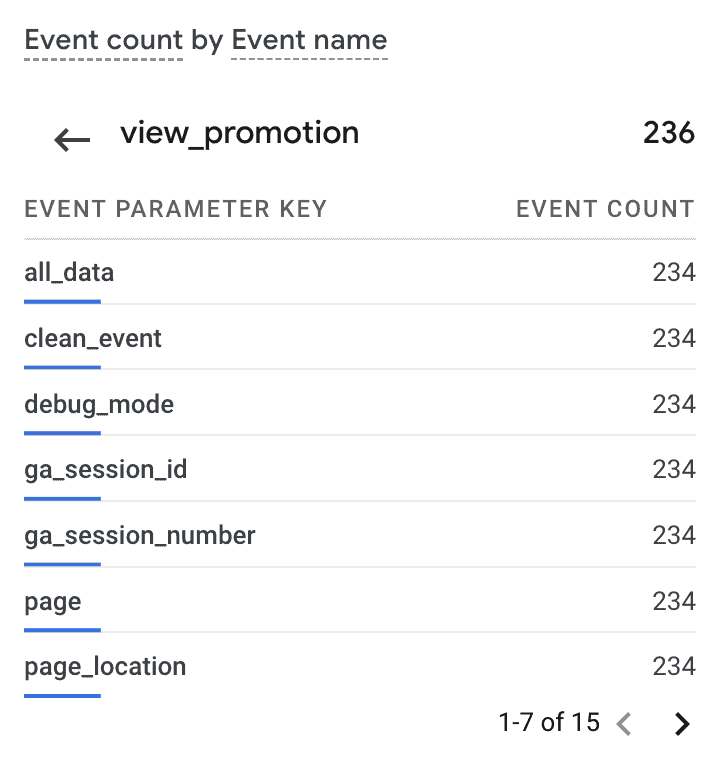
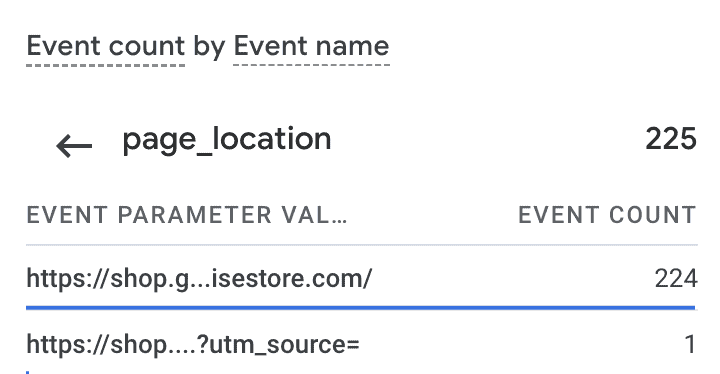
You can click through these parameters to see their values, as well as if we click on the page_location.
Interestingly, the Conversions by Event name card doesn’t show this level of detail. However, you can see the events marked as conversions here, so generally the list should be smaller.
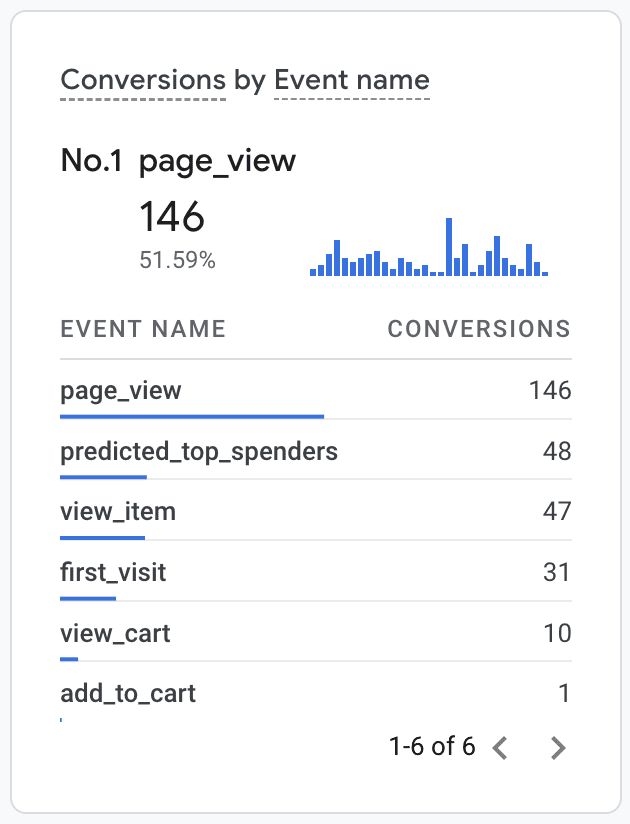
Looks like Google has marked page_view, view_item, etc. as a conversion. But, you might not see that for most accounts because these events are not considered conversions.
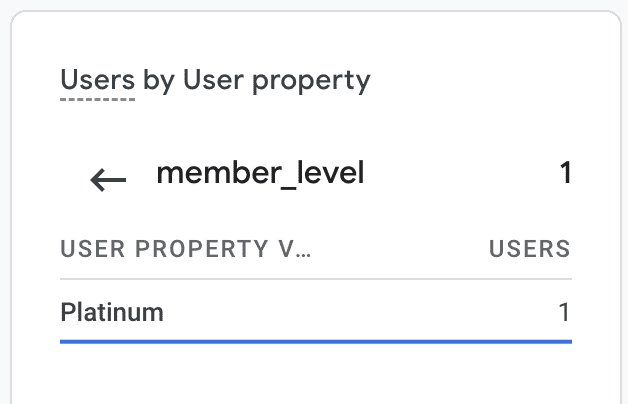
This leaves us with the last card, Users by User property, which is only visible if user properties are configured.
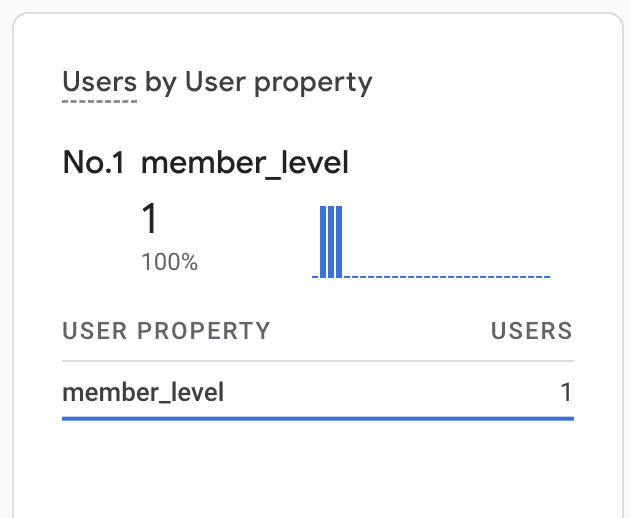
As with events, you can click the user properties to view their values. So, if we click on the member_level property, we can see the value is Platinum.
Two things are common across all the insights cards:
- The top line shows the share of the top item in the list along with its count.
- If you hover over individual items, you can see their share (%) in the totals.
Limitations of GA4 Realtime Report
There are several limitations when you’re working with GA4 Realtime report. Let’s have a look at them:
- The most obvious limitation is the amount of time you can store the data, i.e., only from the last 30 mins. An option to extend that would’ve been quite useful.
- You cannot edit the insights cards that we just looked at in the above section, or customize any areas of the report apart from adding comparisons.
- You cannot download the report in PDF, sheets, or CSV formats. The only way to share it is via a link. But what if you want to share it with someone who has no access to the property? Screenshot(s) can be helpful here.
- Sometimes there can be delays in processing the data, and this is even more true for app data which is batched to conserve battery.
- New and returning users who are not processed are excluded from the ‘Users’ count, so you might not be seeing a complete picture.
Despite these limitations, the Realtime report can come in handy at times. However, you shouldn’t be making big decisions on just 30 mins of data, as things change pretty quickly in the online world.
Moreover, if you’re not constantly monitoring this report, like a stock exchange feed, there’s not much you can do unless you go in with some specific questions. Even then, it does not paint a complete picture.
As long as you’re aware of this, you should be fine with your analysis. Who knows if Google has planned some more exciting updates for this part of GA4 in the future?
FAQ
Why should I use the GA4 Realtime Report?
The GA4 Realtime Report can be useful in various scenarios, including:
1. Verifying the proper tagging and functionality of campaigns before a full launch.
2. Monitoring the performance of recently published content and making timely adjustments.
QA (Quality Assurance) of tracking changes and identifying and resolving any issues with the tracking setup.
3. Getting real-time insights into events, conversions, and user behavior on different devices.
What insights can I gather from the GA4 Realtime Report?
The GA4 Realtime Report provides insights through interactive cards, including information on users in the last 30 minutes, users per minute, device categories, traffic sources, audience data, content views, events triggered, conversions, and user properties.
These insights help you monitor real-time performance, identify issues, and make timely adjustments.
What are the limitations of the GA4 Realtime Report?
The GA4 Realtime Report has some limitations, including:
1. Data is only available for the last 30 minutes, and there is no option to extend this timeframe.
2. You cannot edit the insights cards or customize the report beyond adding comparisons.
3. The report cannot be downloaded in PDF, sheets, or CSV formats; it can only be shared via a link.
4. Delays in data processing can occur, especially for app data that is batched.
5. New and returning users who are not processed may be excluded from the user count, resulting in an incomplete picture.
Summary
Thank you for sticking by. This definitive guide should help you not only understand how the GA4’s Realtime report works but also how it compares to its predecessor.
You also learned why you should be using the GA4 Realtime report and when the limitations kick in so that you can make effective decisions.
The Realtime report is sometimes confused with GA4’s DebugView, which looks quite similar to the User snapshot we saw above but has a completely different purpose.
If you’re not sure how the debug view in GA4 works, head over to our GA4 DebugView guide to get started.
We hope this blog post helps you to understand and use the GA4 realtime report to your or your client’s advantage.
Let our readers know in what scenarios you have used the GA4 realtime report and how it helps you! We are curious to find out how our readers use it!


")