
Last Modified on January 4, 2024
Every analyst knows how useful Looker Studio (ex Google Data Studio) is as a free visualization tool, but how do you get the right data to work with in Looker Studio?
Google introduced Connectors in 2017, and the capabilities of the Looker Connector Gallery have only grown since then.
The most recent major update in August 2020 brings even more power, along with a few interface updates.
In this guide, I’ll explain what Connectors are, how the Connector types are different, and what options you have as a Looker Studio user.
I’ll also show you how to set up third-party Partner Connectors, plus give a quick overview on creating custom metrics using your Connector data.
Stick around at the end for some handy resources and guidelines for using Looker Studio Connectors—including building your own.
An overview of what we’ll cover:
- What Are Looker Studio Connectors?
- Why Looker Studio Connectors are Awesome
- What Connectors are Available?
- Guidelines for Data Connectors
- Build a Community Looker Studio Connector
Let’s dive in!
What Are Looker Studio Connectors?
Looker Studio Connectors automatically pull data straight from your tracking and analysis tools. These data sources can be simple spreadsheets or more complicated tracking software.
The Looker Studio Connector Gallery contains three types of data source connectors: Google Connectors, Partner Connectors, and Open Source Connectors.
Google Connectors are built and supported by the Looker Studio team. Most of these connect to data sources owned and operated by Google, such as Google Ads, BigQuery, and YouTube Analytics.
Partner Connectors are built by what Google calls “Looker Studio partners.” These partners are usually SEO, data reporting, and web tracking companies like Supermetrics or SEMrush.
These connectors can pull data from a variety of sources like Facebook Ads, Shopify, AdRoll, and more.
Open Source Connectors are built and maintained by the Looker Studio open source community.
At the time of posting, this category contains only three Connectors: Chrome UX Report, GKE Usage Metering, and Kaggle.
Why Looker Studio Connectors are Awesome
So why are these connectors awesome? Looker Studio Connectors are powerful and easy to use.
There are over 300 available Connectors in the Looker Studio Connector Gallery. They cover a huge variety of data sources. Chances are, you can pull data from any tool that you already use.
But if you can’t find one for what you need, you can even build your own Connector (resources below). With Looker Studio Connectors, you can quickly and easily import any data you want into your visual reports.
What Connectors are Available?
Let’s take a quick peek at some of the connectors that are available. In the Looker Studio Connector Gallery, you can see a full list of current Connectors.
Using Connectors, we can pull data for everything from Bing Ads to Twitter Analytics. If you’re interested in building your own Connector, that option is available under Partner Connectors.

Supermetrics Connectors
Google sheet no more! You can now directly pull all your marketing data in your Looker Studio with Supermetrics Connectors.
What is Supermetrics, you ask? If you don’t know already, Supermetrics is a data-management superpower. It can consolidate data from a variety of sources so that you can analyze and visualize huge amounts of data from different sources.
Supermetrics currently is the biggest provider of Partner Connectors in the Looker Studio Connector Gallery. Supermetrics Connecters make it simple to pull data from marketing platforms, including Facebook Ads, Twitter Ads, and many more.
All the connectors permit you to pull and blend data from multiple accounts. You can read more about Supermetrics Connectors and find a list of all their current ones here.
The Supermetrics Facebook Connector
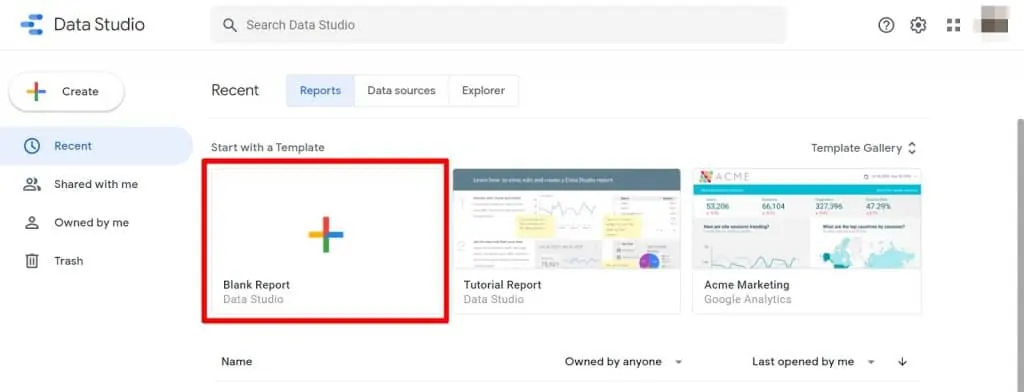
So what do these Connectors look like in practice? Let’s start in Looker Studio with a Supermetrics Facebook Ads Connector as an example. Open up a new dashboard by clicking Blank Report.
When you open a new report, you’ll be prompted to add data by choosing a Connector source. Scroll or use the search bar to find the Facebook Ads Connector by Supermetrics to get started.

Facebook Connector Set Up
To set up your Connector, we’ll need to authorize any third parties to access our Looker Studio account. If you’re using a Google Connector, then you won’t need to complete this step. However, since this is a Partner Connector, we’ll need to click Authorize.

Google will ask you to select and log into your account to provide authorization. Click on the account that you want to use.

When prompted, click Allow to give Supermetrics permission to access your Google account.

Now, you’ll need to connect your Looker Studio account to your Facebook Ads account through the Supermetrics Connector. Click the second Authorize button.

You will need to log into your Facebook account and select any pages that you want to collect data from. Click the Continue with Facebook button.

You may be prompted to log in with Facebook. Click the Continue button.

If you successfully link Looker Studio to Facebook Ads through the Supermetrics Connector, you will get a success message.
Click the OK button to continue.

The last step to set up your Connector is to select from which Facebook Ads accounts to pull data and from what conversion window.
I will go with the 28-day click window and click Add to connect all of my data.

Pulling Metrics and Dimensions
Your dashboard will automatically be populated by a graph or table by Looker Studio. Click on it to see the Data tab in the sidebar on the right.
Here, you’ll see a bunch of Available Fields. If you have worked with Looker Studio before, you’ll know that the ones with blue icons are metrics and the ones with green icons are dimensions.
If you have a huge list of available fields, you can use the search bar to find a specific field quickly.
We can take a look at these in more detail. Under Data source, click the pencil-shaped edit icon.

In this window, you can details about all of your metrics and dimensions.
The types of metrics and dimensions that are built into your data set depend on the source that your Connector is attached to.
In older versions of Looker Studio, you had to add your data to your report using this window.
However, now we can pull data directly into each individual chart.
Click Done when you’re done examining your fields.

Pulling Data from Facebook into a Chart
Next, let’s add some visualizations to this report. Click the Add a chart dropdown in your topbar and click on a Scorecard.
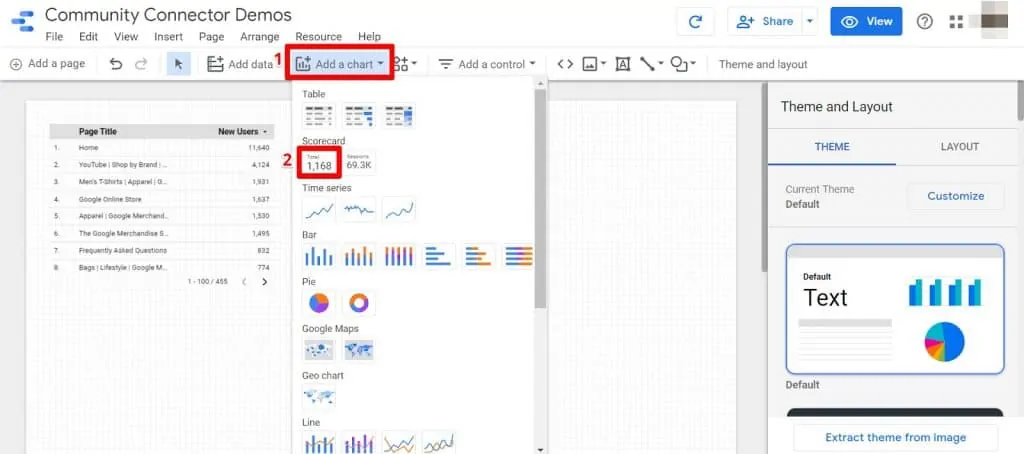
A scorecard can display the raw number for any metric you like.
To choose a metric, simply click and drag it from the Available Fields to the Metric section in the Data tab.

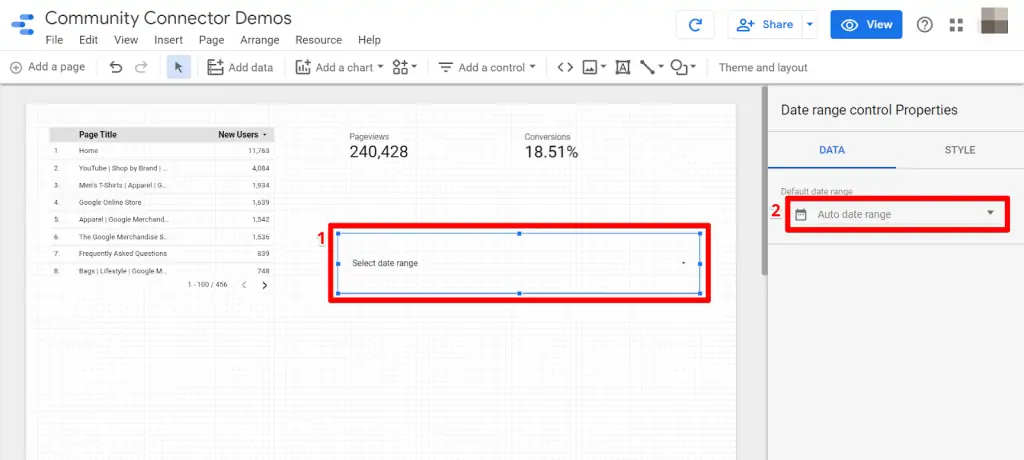
Finally, you can specify what time period you want to examine for each metric.
Click Insert and select the option Date range control.

Click and drag a box onto your report where you want to insert your date range controller.
In the Data tab, click on the Default date range dropdown.
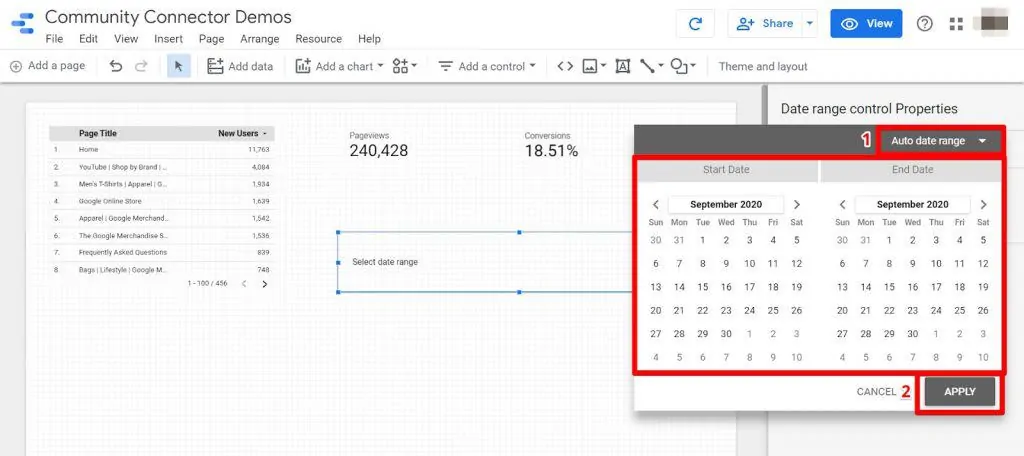
In the calender window, you have two options to select your date range.
The first option is to click the dropdown menu at the top-right corner to select from several date range presets.
The second option is to set a custom-defined date range by clicking on a Start Date and End Date on the calendar.
Click Apply when you have chosen your date range.
Custom Calculated Metrics with Connector Data
Let’s say that you want to display data from your Connector, but your available fields don’t include a metric that you want to show.
Instead of analyzing your data externally and importing it through yet another Connector, you can build a custom metric inside Looker Studio.
For example, let’s create a new conversion rate metric in our dashboard.
On a new scorecard, click the pencil-shaped edit icon next to your current metric, then click Create Field.

In this window, you can create or edit a custom metric. Let’s name this one Conversions.
In the Formula field, we can take existing metrics and tell them to interact with each other.
For this conversion, for example, we’ll divide Product Checkouts by Product Detail Views.
In a shop, this would tell us how many users viewed the product and then went to checkout with that product in their cart.
Since it’s a conversion rate, let’s choose Percent as the Type so that we get a whole number instead of a decimal. Click Apply.

Guidelines for Data Connectors
Since the Looker Studio Connector Gallery’s launch in 2017, it has grown considerably and given analysts even more powerful tools to visualize their data. The original launch statement can still be read here, but you can find all of Google’s most up-to-date help and information on their official support page.
Build a Community Looker Studio Connector
If you have software that you want to connect but isn’t supported in the Looker Studio Connector Gallery, then you can build your own Connector.
If you want to get started on building your own data Connector, you could probably start out by reading through this developer documentation.
My friend Ben Collins has written a great blog post about this. He actually goes through an example of how to build a community Connector with some code examples. So if you’re interested in building your own Connector, definitely check it out.
FAQ
How can I find available connectors?
To find available connectors, you can visit the Looker Studio Connector Gallery, which provides a full list of current connectors. The gallery includes connectors for various platforms such as Bing Ads, Twitter Analytics, and more. If you’re interested in building your own connector, you can explore the Partner Connectors section.
How do I set up a Supermetrics Connector for Facebook Ads in Looker Studio?
To set up a Supermetrics Facebook Ads Connector, follow these steps:
1. Open Looker Studio and create a blank report.
Choose the Supermetrics Facebook Ads Connector as your data source.
2. Authorize the connector to access your Google and Facebook accounts.
3. Connect your Looker Studio account to your Facebook Ads account through the Supermetrics Connector.
4. Select the desired Facebook Ads accounts and conversion window.
5. Pull metrics and dimensions from Facebook Ads into your report’s charts and visualizations.
Can I create custom metrics using Connector data in Looker Studio?
Yes, you can create custom metrics using Connector data in Looker Studio. If the available fields from the Connector don’t include a specific metric you want to display, you can build a custom metric within Looker Studio. By defining a formula that interacts with existing metrics, you can create new metrics tailored to your needs.
Summary
So in conclusion, Connectors are a great way for us to pull data from third-party data sources into Looker Studio.
If Google hasn’t made a Connector for your data source, you can build your own! If you have any kind of software or Open Data API that you want to pull in, then you can do that.
That said, Looker Studio can still be hard to control when it comes to mixing and matching data. So if you have different data sources, you’ll need to blend your data within Looker Studio.
For more on the other possibilities of Looker Studio, head over to our Looker Studio tutorial where you can learn how to start building an awesome data report.
Was this helpful to you? Let us know in the comments what your favorite Community Connectors are!


")