
Last Modified on October 30, 2024
Can’t find where to monitor the loading time of your website in Google Analytics 4? Are you also frustrated by the absence of page load time metrics? Don’t worry, you’re not alone.
In this comprehensive guide, we’ll show you how to set up, effectively report, and track GA4 page load time.
Why does it matter?
Page Load Time is a critical metric for user experience and SEO. A faster website not only keeps visitors engaged but also ranks higher in search engine results.
By tracking page load time in GA4, you gain the power to optimize your site speed and enhance overall performance.
- How to Track GA4 Page Load Time with Google Tag Manager
- Displaying Page Load Time in Google Analytics 4 Reports
- Reporting on Page Load Time in Google Analytics 4
- Building Page Load Time Reports in Looker Studio
Let’s dive in!
How to Track GA4 Page Load Time with Google Tag Manager
If you’ve been reviewing your reports and are feeling stuck because you can’t find any loading time data, there’s no need to worry. It hasn’t been concealed. GA4 just doesn’t provide these metrics and we have to configure them manually.
So, let’s do it with the help of Google Tag Manager. We presume that you’ve already set up a GTM container on your website with GA4 integration in place.
💡 Top Tip: However, if you’re new to Google Tag Manager and don’t find a GA4 configuration tag within your container, we recommend taking a moment to go through our Google Tag Manager tutorial.
Step 1. Create Variables
The first step is creating new user-defined Variables, so let’s navigate to this part on the left sidebar.
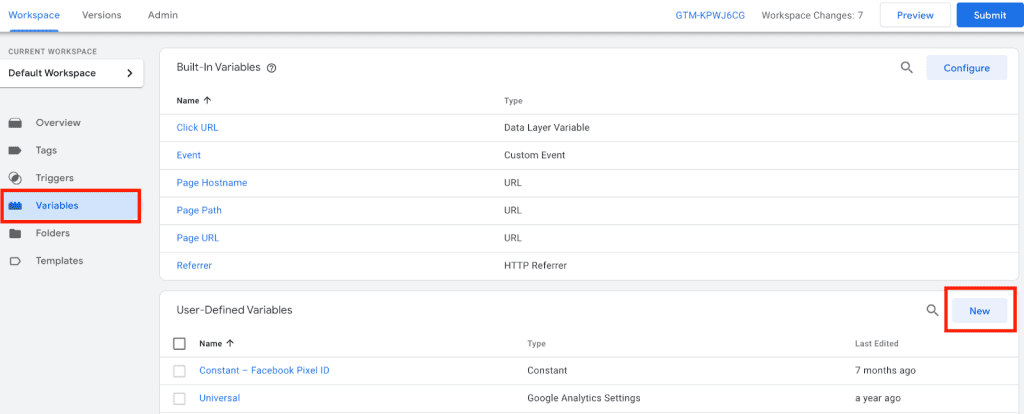
Choose variable type: Custom JavaScript.

After choosing the type, we have to put in custom JavaScript code that will calculate the loading time of our pages.

This code leverages the Performance Navigation Timing API to compute the duration, measured in milliseconds, between ‘loadEventEnd’ and ‘startTime,’ thereby providing us with the page load time.
Feel free to copy and paste it:
function() {
	if (window.performance && window.performance.getEntriesByType) {
		var entries = window.performance.getEntriesByType("navigation");
		if (entries.length > 0) {
			var navTiming = entries[0];
			var pageLoadTime = navTiming.loadEventEnd - navTiming.startTime;
		return Math.round(((pageLoadTime / 1000) + Number.EPSILON) * 100) / 100;
		}
	}
}
🚨 Note: If you prefer to report in milliseconds instead of seconds, you can make adjustments to the JavaScript code.
Below the field with the code, open the dropdown with Format Value. Enable the option Convert undefined to and put 0 as the value.

It means that if the navigation timing API fails, then the variable will return a zero value. Name and save the variable.
Step 2. Create Triggers
Navigate to the Triggers section. Clock on the New button for creating a trigger.
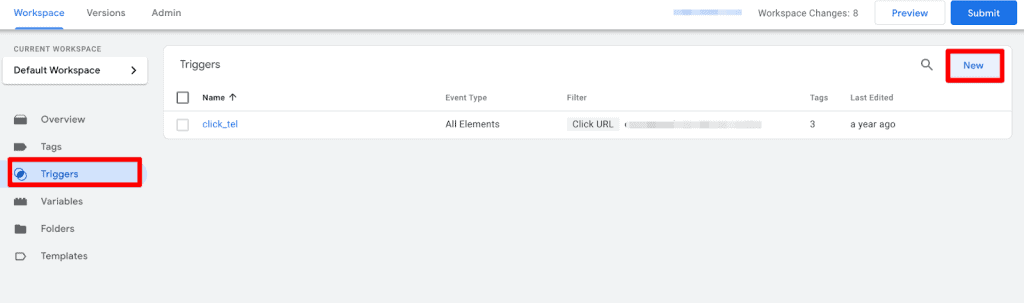
Choose the Window Loaded trigger type.

Leave All Windows Loaded Events and save the trigger. This trigger will fire our tag after a page has completely loaded in the browser.

Then, we need to create another trigger with a page load time of less than 0. In this case, you have to choose the trigger type Custom Event.

Put .* as the event name and click the checkmark for using regex matching.

After that, we need to choose the option of Some Custom Events when the trigger should be fired and choose our created variable with JavaScript – Page Load Time.

Enter the value that is less than 0. It will prevent our tag from firing if our variable returns 0 value. Name and save the trigger.
Let’s also create a repetitive variable to include this parameter for all tags automatically. Go to variables, click New, and choose Google Tag: Event Settings type of variable.

Add Event Parameter loading_time_sec and choose our new variable as a value.

Name and save the created variable.
Step 3. Create a GA4 event tag for page loading time
The next step is to create a GA4 event tag to send the loading time of our pages to Google Analytics. Let’s navigate to Tags, and click New.

We assume that you have installed the GA4 measurement ID.
💡 Top Tip: If you have not installed the measurement ID and need help, read this post.
Then, add the event name as page_load_time, click on Event Parameters, and add our created reuse Event Settings variable.

By clicking on Show inherited parameters, you can check whether created event parameters are connected.
The last step is connecting triggers to the tag. You need to add Page Loaded as a trigger.
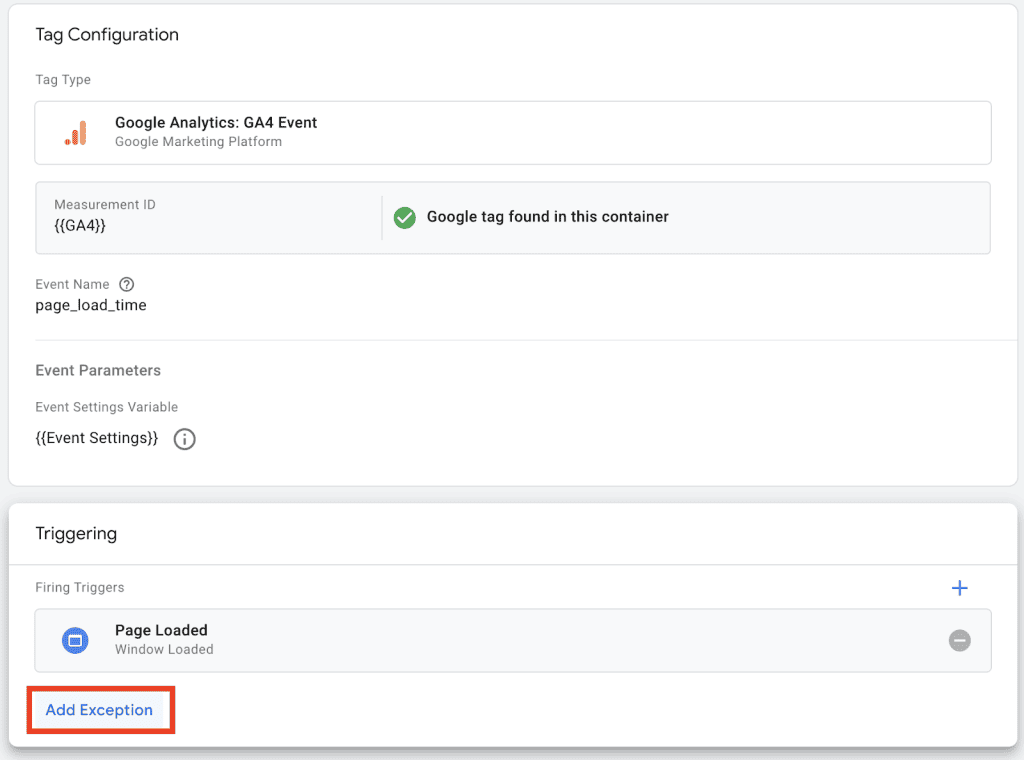
Then under Exceptions, we need to add our other trigger. Let’s select the Page Load Time Less Than 0 trigger.

This will prevent the tag from firing if the page load time variable has a value less than zero. Now, let’s save the tag and let’s debug it.
Click preview, enter your site URL, and navigate the site. Go back to Tag Manager and we can see that the Tag is fired.

By clicking on Variables details, we should see the raw with Page Load Time value.

Once you’re pleased that everything is working correctly, it’s time to publish the changes.
Displaying Page Load Time in Google Analytics 4 Reports
The loading time of our pages is now being sent to Google Analytics. However, it’s not enough to display it within reports. So, the next thing we need to do is to register the loading_time_sec parameter in GA4.
To display page load time in reports, we need to add the created metric in the GA4 setting. Open your GA4 account> click Admin > Custom definitions > Create custom metrics.

Name metric as Page Load Time, choose the event parameter we set up in GTM – loading_time_sec, and choose Seconds as a unit of measurement.
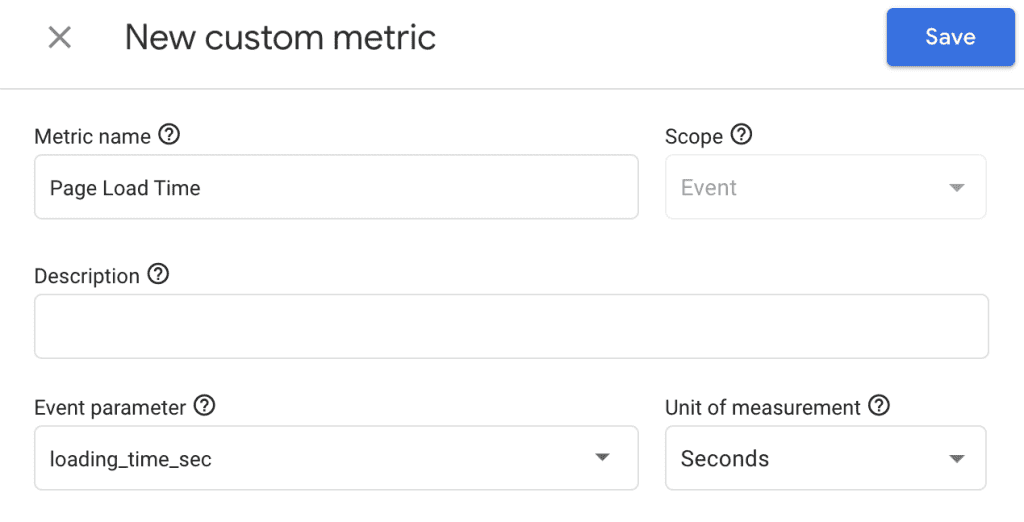
Save custom metric configurations. Now you will be able to use the metric in your reports.
Reporting on Page Load Time in Google Analytics 4
The next step is to report on the performance of our pages. Let’s do this first by creating an Exploration report. Start by navigating to the Explore section and choosing a new blank type of report.
Let’s start by adding the dimensions and metrics you want to display and Import them to our dashboard. We chose Page Path + query string as a dimension, and Views and our created custom Page Load Time metrics.
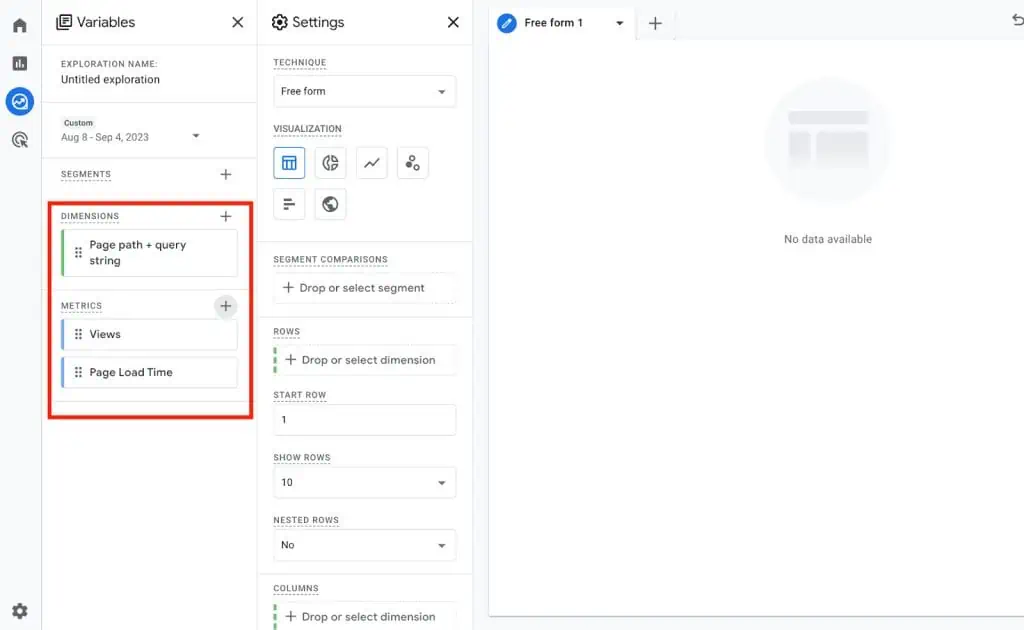
By double-clicking, we can add the dimensions and metrics as rows and values. Now, we will build the report with the loading time for the pages on our website.

In this case, we will see the total page load time. That’s why we recommend using Looker Studio for page load time reporting with more details by page.
Building Page Load Time Reports in Looker Studio
To see the average loading time by pages using the data we’ve collected, it’s better to use Looker Studio reports. Let’s start with creating a Blank Report.

We assume that you’ve already connected your GA4 property to Looker Studio. If you don’t know how to do it, read our guide with Looker Studio basics.
Let’s adjust the initial table. Add Page Path as a dimension. Note that you can add your preferred page-based dimension like Landing Pages.
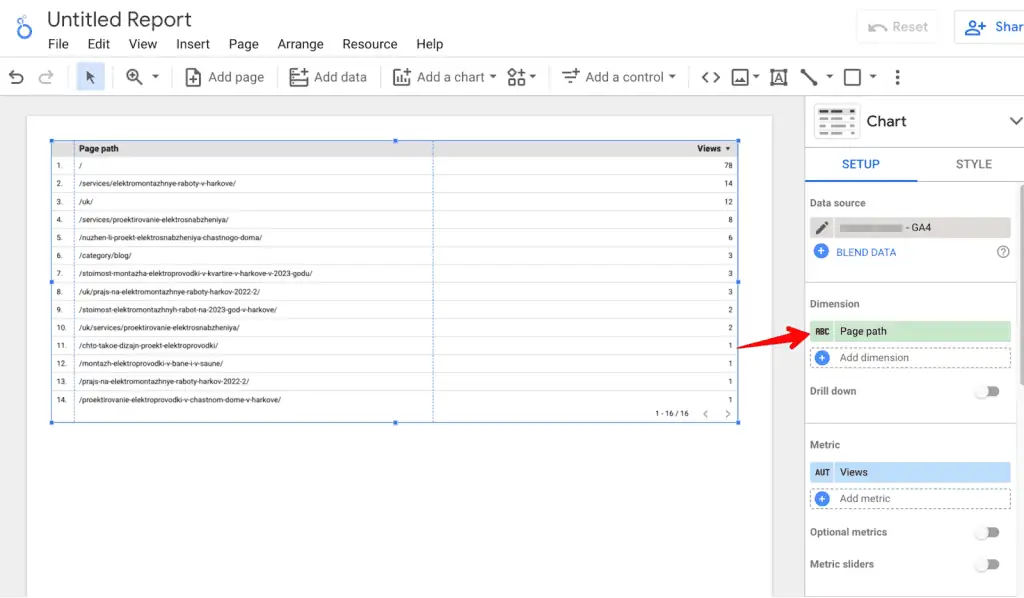
Choose Event Count as a metric and the second metric – Average Page Load Time. Looker Studio suggests this metric by default. You can also use the Page Loading Time metric, which is what we added to our Exploration report before.

Next, we must incorporate a filter into our chart, as there could be instances where a page view has been logged without our Page Load Time tag being triggered.
This might occur, for instance, if you’ve modified the trigger to prevent the event from firing on every page, encountered an error, or if the page loading time was recorded as zero seconds or less.
Choose a selector Include the Event name equal to page_load_time.
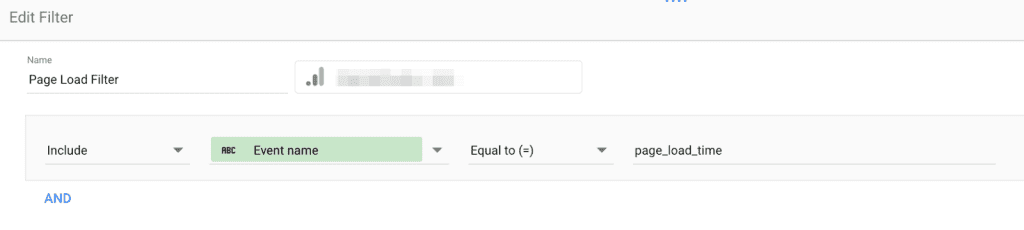
This ensures we’re only including pages where the page_load_time event was triggered in the table.
Finally, we can see our report with the average loading durations for our website pages.

If you prefer a numerical representation, you can click the edit icon – the small pencil icon adjacent to the metric.

Switch the Data Type from Duration to Number.

This adjustment can enhance the analysis and readability of average page loading time in Looker Studio reports.

Summary
In building a report with page load time tracking in GA4, you can assess your content’s performance. We suggest utilizing the described reports to find pages with lots of views, but also with slower loading times.
By optimizing these pages, you can reduce their loading duration, enhancing overall performance and potentially increasing website conversions.
If you’re eager to dive deeper into Google Analytics 4, we suggest our GA4 landing page report guide.
Have you checked your page load time? How long does it take for your homepage to load? Let us know in the comments below!


")
What if Looker Studio does not create the Average Page Load Time by default? I can’t get this metric =(
I had the same issue and solved it by refreshing the GA4 data source. Click on the pencil to the left of the GA4 data source, and then click on REFRESH FIELDS at the bottom left of the edit screen.
Hi TY – im a bit of a novice – when I try adding Average Page Load Time to looker studio I get a Data Set Configuration Error- any ideas why?
Thanks for this! However, the event parameter isn’t showing up in GA4 when making a new custom dimension. Any tips?
Is the parameter showing up in the Debug View?
Yes Debug looks fine.
Sorry, it is now showing. Perhaps a caching delay? Or time delay from GA4. Sorry for the false alarm.
Why have we added the tigger of page load time less than 0?
Thank you for sharing. I successfully tracked the corresponding data according to your sharing, but recently I found that when I put the web page path and average page load time dimensions on the table at the same time, the table will report an error. What causes this?
Inna – with your suggestion to change the average_page_load_time to a number vs duration – what exactly is the number representing? The duration is obviously seconds.
The parameter is not showing up in GA4 no matter what I do.
In Looker Studio, what is the difference between this and Count Page Load Time?
Hi, I followed the guide and GA4 is recording page load times, I’ve created a report in Looker Studio which did pull through the average, but the values shown never update. I’ve tried editing the report setup and changing the Default date range from ‘Auto’ to ‘Custom’ and setting the date range I want, but the data still doesn’t update. I’ve also tried clicking the 3 dots at the top right and then ‘Refresh data’. What am I doing wrong? Thank you.
Hi, apparently if you change the date range in Looker Studio it doesn’t update straight away – even if you click ‘Refresh data’ – it’s overnight. The Looker studio report for a particular month, for the homepage has 290 event count and 4.63s Average page load time. I’ve tried to sense check in GA4 and in an exploration report I can see 7,057 active users, 11,869 views and 113,697 Page load time (which is the total). Why would event count be 290 and not 11,869 or similar? Thanks, James.
Hey there, great article! I am curious though now when you goto add a custom dimension in GA4 it says
Creating a custom dimension with a high number of unique values may negatively impact your reports. Be sure to follow best practices when creating custom dimensions.
How does one then now go about tracking page load time in GA4?