
Last Modified on January 13, 2025
Are you curious about how to track what individual users are doing on your website?
At some point, we all are curious, but identifying who the user is has always been a privacy concern, and rightly so!
The User Explorer report, while not new, has improved a lot in Google Analytics 4, where we can find more about user actions on our site without breaching any privacy laws.
What are those improvements? How can you use this report to your advantage? Well, that’s what we are going to look at in this post, broken down into the following topics:
- What is the GA4 User Explorer Report?
- Where to Find the User Explorer in GA4
- Customizing GA4 User Explorer Report
- Limitations of the User Explorer in GA4
Let’s do some user exploration!
What is the GA4 User Explorer Report?
The User Explorer report helps identify what an individual user is doing as well as selecting a specific group of users based on their interaction with your website and/or app.
This can be quite helpful if you want to find out why a specific user is not completing an order, why someone has a highly unusual number of orders or in general just to learn more about users to personalize their experiences.
The User Explorer in GA4 uses client IDs to identify each user’s activities on the website, so it still protects the actual identities of users. More on that later.
Here are some other reasons why this report can prove helpful:
- Troubleshooting – If there are any issues you want to troubleshoot, then you can look into each user’s actions in a given period and see when/where they face those issues or any errors. This specificity can help you to close in on the issues and not waste time on initial troubleshooting.
- Retargeting – Finding out users who are not completing a purchase or stopped somewhere before the payment, or users who buy something but are not interested in cross/upsells, can help you retarget them at a more personal level to help increase your conversions.
- Customer Retention – If you’re able to identify the buying patterns of users, then you can use that valuable information to devise a marketing/sales strategy that helps you run specific promos, loyalty programs, etc. to retain those customers.
- Conversion Optimization – The specific user behavior can also prove very helpful for conversion rate optimization specialists who can optimize the parts of the experience and buying patterns that can lead to higher conversions.
At the core of it all, sits a lot of personalization and that’s what this report can help with.
Where to Find the User Explorer in GA4
To find User Explorer in GA4, click on Explore and then click on the Template gallery on the right.

Next, you will find Techniques and different report templates.
💡 Top Tip: Wondering what the other techniques are like? Check out our guide on the Top 10 GA4 Exploration Reports with Use Cases.
We are going to click on the User Explorer template.

This will open up the report with some standard traffic and conversion metrics and something called the Effective user ID, which is GA’s way of identifying a user’s device/browser, and being an ID, it’s unique to each user.

The Effective user ID is based on your chosen reporting identity in GA4 settings, where you choose whether you want User ID (set by you), Device ID, and/or Google Signals.
💡 Top Tip: Check out our guide on How to Configure User ID in Google Analytics 4 if you want to identify unique website visitors.
Apart from this, you can apply segments and filters to get more contextual information, but there’s some more customization that you can do.
Customizing GA4 User Explorer Report
You can customize this report at two levels – the report that shows all the users and at an individual user’s level.
At the ‘all users’ level, we can add different segments for more context, e.g., if you want to see the users who came from a specific country, device, or traffic source.

Dimensions are there as soon as you open this report. However, you cannot add any more other than the two already added in the Settings column, i.e., Effective user ID and Stream name.
If you try adding, you will see an error saying Maximum number of dimensions applied and you cannot remove those either.
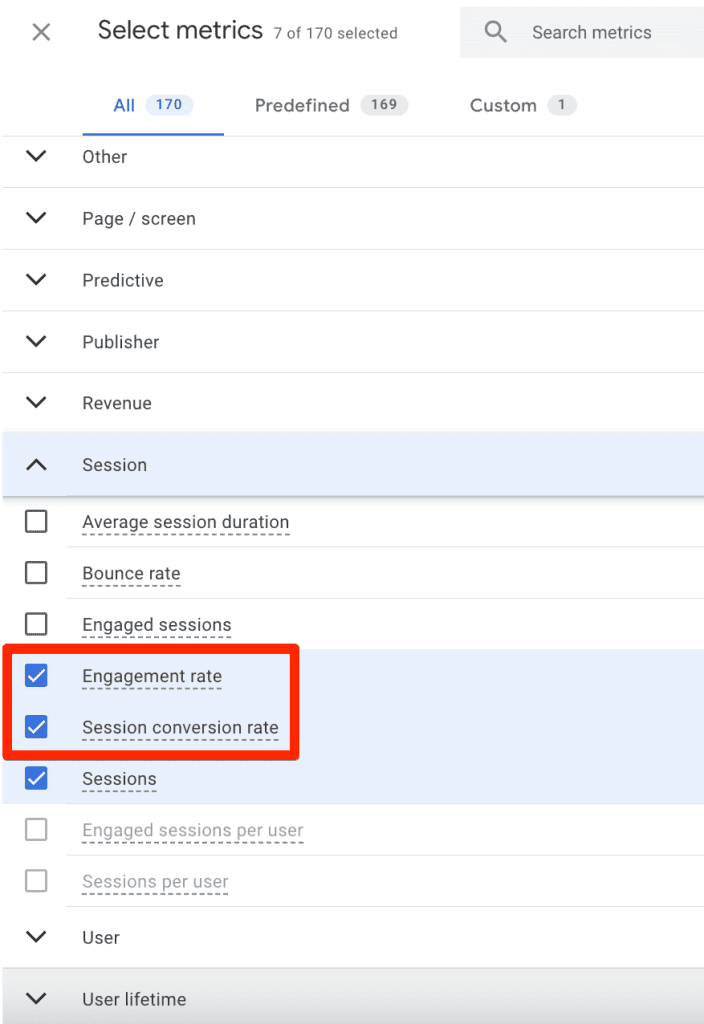
You can add the metrics apart from the ones that are already there, e.g., if you want to know the engagement rate or the conversion rate.
However, not all metrics are available, and some are not very useful. For instance, Active users will always show 1 since the data is shown for only one user.
In the right Settings column, you can add any segments you created in the left Variables column.
You can also adjust the Start row, which is from which row number you want to display the report, and Show rows which is about how many rows you want to display.

Further down, you can change how the data is visualized, i.e., Bar chart, Plain text, and Heatmap.

Finally, the dimensions you have added in the Variables column can be used to filter any data, even if you can’t add them to the report. For instance, let’s say that you want to see the users who browsed on mobile.

Lastly, in the top right corner, you have the option to check if the report is sampled, share the report, or simply undo/redo changes. You can also do undo/redo with the usual keyboard shortcuts.

Now, to see what a single user is doing on your site, click on any effective user ID value.
This will open up another report tab in the exploration called User Activity 1.

Let’s try to break down what’s happening here and what you can do with this report.
At the very top left, you can see the effective user ID you clicked on along with the first visit date, location, and the data stream as it is for the main User Explorer report.

In the right top corner, you can see the Top Events section that shows the event category, i.e., Screen View (for apps), Conversion, Errors, and Other, and the event count of those events below them.

Below these two, there’s a summary section that shows metrics like total event count, purchase revenue, transactions, and total user engagement time.

Below this section is where you can see the timeline of events with dates that represent different sessions. You can choose to collapse/expand individual sessions or days.

When you click on any individual event, you can see details like the event name, the time it happened, Device Info, User Properties, any custom Event Parameters, and the Audience Memberships the user satisfies as per that event.

All the custom parameters show regardless of whether they are relevant to that event or not. If they have values, those will be displayed. Otherwise, you would see (not set) as a placeholder.
💡 Top Tip: Want to get rid of this placeholder? Check out our guide on How to Fix Not Set in Google Analytics 4.
Moving to the Settings column for the report, you can choose whether you want to sort the timeline by descending/ascending order or vice versa.
You can also choose to Collapse All or Expand All for the timeline events. Collapsing can be useful if you want to know how many days the same user visited your site. However, to see details for each day, you would choose Expand All.

If you change the Technique and go back to User Explorer, it starts from the main User Explorer view and not the individual user activity you were viewing.
But what if you’re only interested in the specific and not so many? This is where the filters come in. You can use the Event name dimension and filter for that event, e.g., if we just want to see the scroll event.
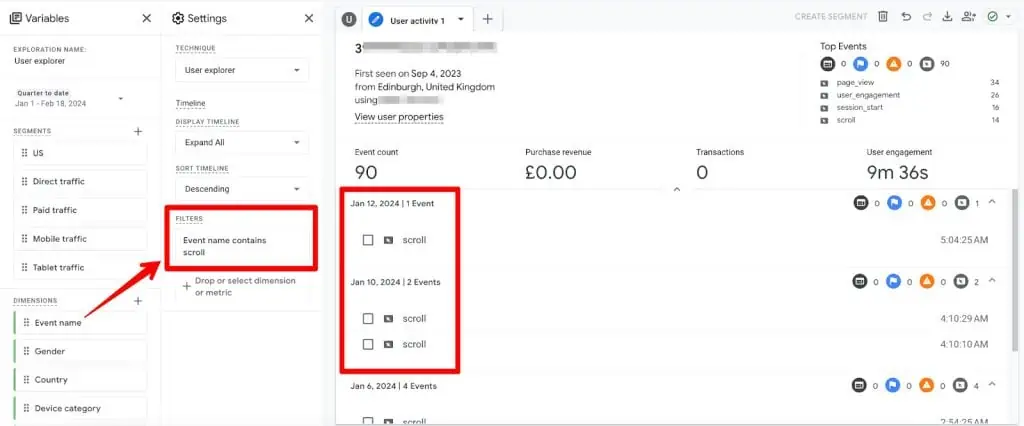
Understandably, the same filter can be used to filter out any specific event that you don’t want to see in the report.
If you find an interesting event and want to do further slicing and dicing, then you can check on the event to create a segment from the top right corner. The option is greyed out if you haven’t selected any events.

💡 Top Tip: Learn more about Segments in Google Analytics 4 by checking out our in-depth guide.
Unlike other GA4 reports, the user activity report is so unique that you can delete a user from the reporting data. This can be from the top right corner where you see the trash can icon.

The next screen is a Warning prompt that mentions that the user will be deleted within 24 hours and completely removed from analytics servers within 63 days.

If you’ve exported user data already, then obviously that won’t be deleted. Otherwise, you would have to delete it from there, as well.
🚨 Note: Before you choose to delete any user data, you must clarify why you want to do it because you cannot undo this change.
Limitations of the User Explorer in GA4
User Explorer in GA4 is good for knowing what individual users are doing on your site and getting more context in terms of what events they trigger. But, it’s not good when it comes to the following things:
- You cannot target these individual users or create audiences out of them from the User Explorer report.
- Since PII is not allowed by Google to be collected, it’s not possible to tie any client IDs to specific users. In general, GA4 cannot be used like any CRM tool.
- User Explorer in GA4 was launched on 12th May 2021, so you won’t see any data before that. It might not be a big problem considering you would generally need more recent data or if your property was created recently, so obviously you won’t have any data before that.
- Not all metrics are available to apply at all users’ levels.
- You cannot add more than two dimensions for all users’ reports.
However, these limitations won’t stop you from getting some important information from this report, like the events a user triggers along with parameters and other details in a session.
Summary
So, we’ve learned all about User Explorer in GA4 including how it can play an important part in looking at user actions, troubleshooting, retargeting, customer retention, and CRO efforts.
To learn where we can find this report in GA4, we looked at the Explore template gallery. We then discovered how to customize the user explorer report to get the most out of it.
Our final stop was to look at the limitations of this report which shouldn’t be a major cause of concern or something that deters you from using it.
But to get more context, you need to track important events vs the automatically collected or some enhanced measurement events, along with custom parameters that you can see for a user.
If you’re firing up GA4 to answer some user-specific questions, the User Explorer report should be one of the first places to explore.
Want to learn more about GA4 reports and explorations? Here is a Google Analytics 4 Reports Guide.
Have you used User Explorer in GA4 yet? How do you make the most of it? Let us know it all in the comments below.


")
In the user explorer report, if you drill down into a particular user where you can see the timeline of events, is it possible to see the page path on those page_view events? All I see is that there was a page_view but not where it occured. Having this info would be super helpfult when reviewing a users actions on the site. I could add page path as a custom parameter in the config tag if absolutely necessary but was curious if it was available in some way through the existing page path dimensions built into ga4?
I’m asking the same question! Did you find a solution for this? Being able to track individual user sessions pre or post-conversion would be very helpful.
Hi both, to answer your question. If you add them as custom definitions (not page path but generally page location, page title, etc. are recommended to be added anyway) then you can click on the individual events and see the values for associated parameters on the right side.
The first screenshot is where they are added, whereas 2nd screenshot is for a property with no custom definitions registered.
First screenshot.
Second screenshot.
Hope this helps!
How can we add those page_location and page_title in GA4? This article was very helpful
Hi Reza, glad you found it helpful! If you add them as custom dimensions in GA4 then you can use them in your reports. Generally, they are available in other explorations but not in the User Explorer from what I’ve observed in a property with no custom definitions added. You can read our post on How to Set up GA4 Custom Dimensions to learn more about them.