
Last Modified on June 6, 2024
Do you want to present data from multiple sources in a single report?
Looker Studio (ex Google Data Studio) is a free dashboarding software used for converting data into informative reports.
This tool allows you to combine all your tracking data and synthesize them into a customized data report that you can share with your clients and colleagues.
This guide will show you how to blend data in Looker Studio.
Here is an overview of what we’ll cover:
- What is Data Blending in Looker Studio?
- Why is Data Blending Important?
- Setting Up a Table Without Data Blending
- Blending Meta Ads and Google Analytics Data
- Adding Metrics to Your Table
What is Data Blending in Looker Studio?
Data blending in Looker Studio is the process of merging data from multiple sources into one dataset that can be analyzed and presented in a single report.
If you wanted to have data from Meta Ads or Google Analytics in one table or one visualization, you can simply connect those data sources to Looker Studio and create a blend.
Why is Data Blending Important?
Previously, individuals and businesses that needed to compare data from different sources had to manually export raw files from each platform. Only after combining them in a spreadsheet like Google Sheets or Excel could the data be imported to Looker Studio.
This process provided a lot of flexibility, but it was also time-consuming, and inefficient. Every time newer data needs to be presented or compared, the manual export and combination process had to be repeated.
With data blending, you can directly import data from various data sources using Looker Studio connectors.
This saves time and allows for deeper insights into the data.
There are connectors available for Google products like Google Ads, Google Analytics, and Google Sheets. For other platforms, there are partner connectors that allow you to connect to many different data sources like Bing, Meta, and LinkedIn.
Setting Up a Table Without Data Blending
Let’s start our journey of learning how to blend data in Looker Studio by creating a new report.
1. On your Looker Studio homepage, click on the + button.
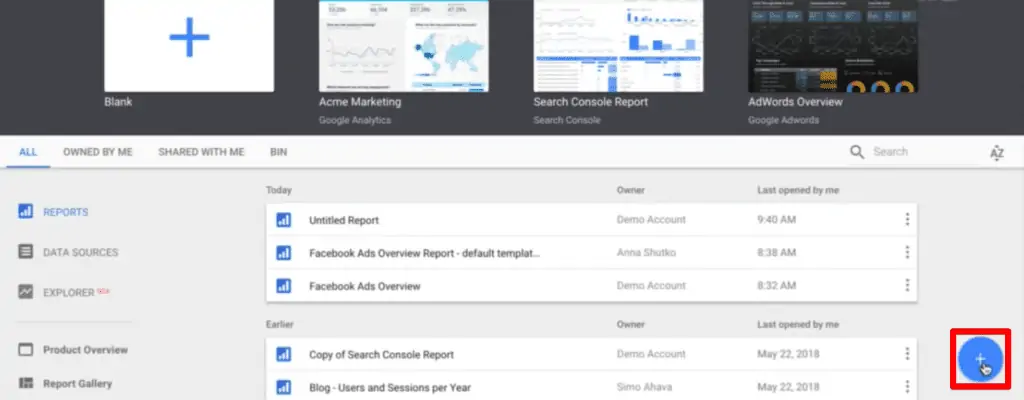
A list of the connected Google data sources is available on the right side of the page.

🚨 Note: If you haven’t connected your data sources to Looker Studio yet, follow the steps outlined in our Looker Studio connectors guide.
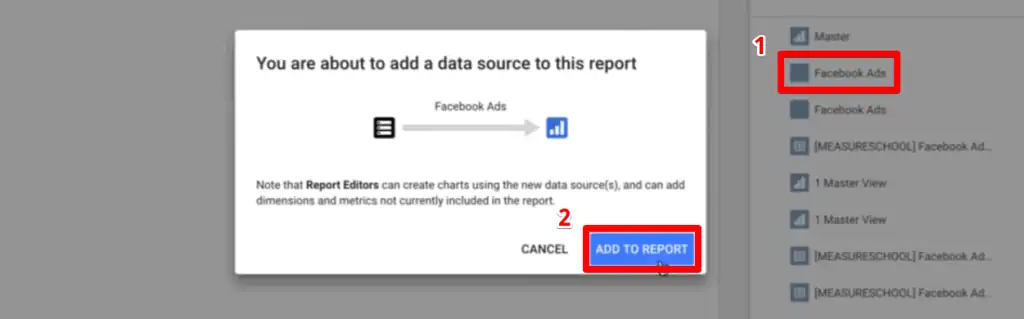
Next, we’ll choose our primary data source for the entire report. We can add other data sources later, but the first one we choose will be the default data source for our charts, tables, and controls. Let’s start with Facebook (now Meta) Ads.
2. Select Facebook Ads, then click Add to Report.
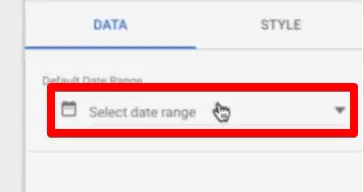
3. Next, create a data picker by selecting the Date range button, then create a box.

4. In our data range properties, click on Select date range.
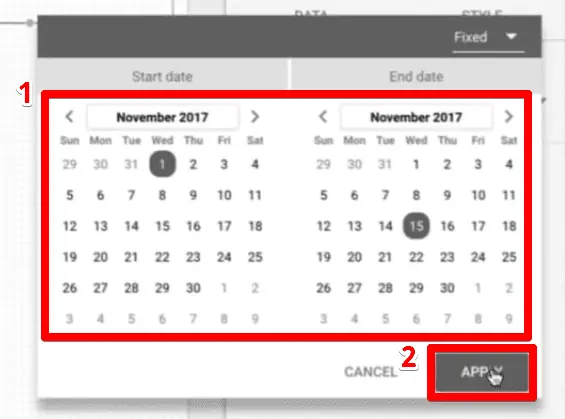
5. Select the dates you want to work with, then click Apply.
🚨 Note: If you are new to Looker Studio, read our guide on Looker Studio charts to learn about the different chart types and their properties. This will help you better navigate and understand the Looker Studio interface.
6. Next, let’s create a table to present our data.
7. Click on the Table icon, then select the area where you would like to put this table.
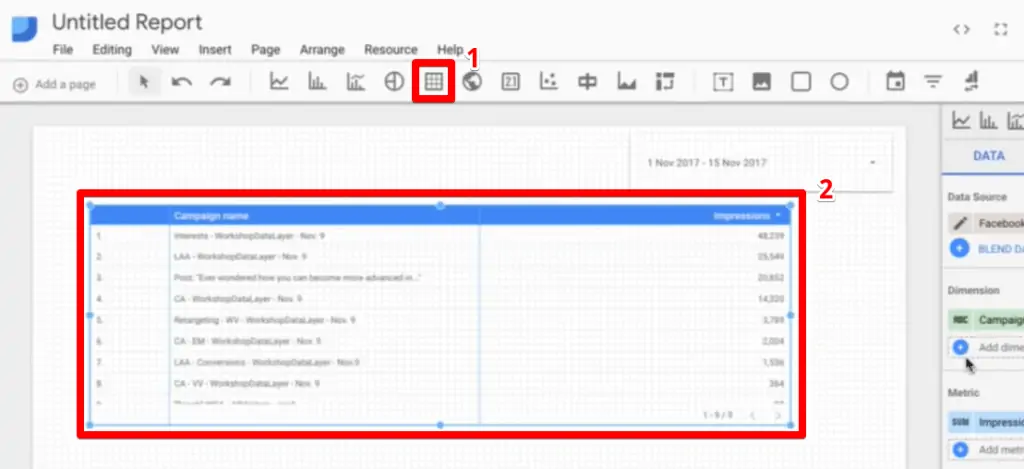
Instead of the campaign name, we want to group our data by date. We also want to find out how many clicks we had on our ad campaign. Therefore, we need to change the dimensions and add a metric to the table properties.
8. Remove the Campaign name dimension by clicking on the ✖ button, then click Add dimension here.

9. Click on Time → Date.

Next, we want to show the actual clicks that we had on our campaigns.
10. Click on Add metric here.

11. Click on Clicks → Link clicks.

Next, we also want to know how many conversions we have for our ad campaign.
If you have enabled Meta Pixel conversion tracking, you know that the Facebook Conversion API gives a lot of data to look into. You may need to check how you have tagged the conversion to know which metric to select.
For this example, the conversion we want is listed as a custom conversion.
12. Click on Website (Facebook Pixel) → Website custom conversions.
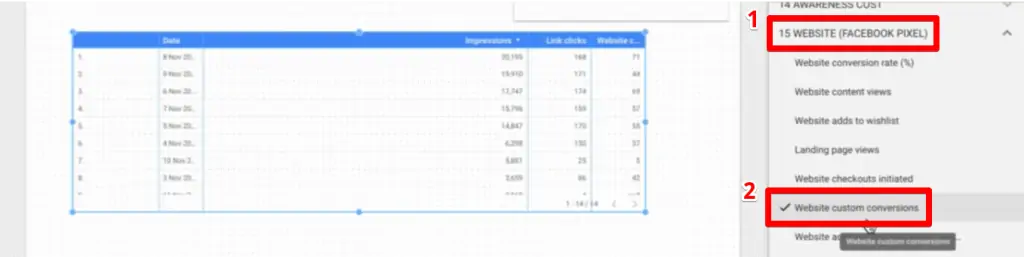
This shows the number of conversions Meta records from the Meta Pixel. How does this value differ from the one recorded by Google Analytics?
Blending Meta Ads and Google Analytics Data
Let’s discuss why these two platforms record different values for the same variable.
Meta counts the number of people that go to your website and does a conversion that you want to track. If there was any contact point with Meta, this conversion will be attributed to the ad.
For example, a user viewed an ad for your product but did not click. They later visit your website through organic search and make a purchase. Meta will attribute this conversion to the ad the user saw despite having no direct interaction with your ads.
Meanwhile, Google Analytics uses the last-click attribution model where it attributes all credit to the last source or marketing touchpoint the user clicked on or engaged with.
In the earlier example, Google Analytics will not be able to capture the conversion because it has attributed all credit to the organic search.
Since Meta and Google Analytics have different attribution models, expect to have different recorded data from these two tools. Let’s now compare these two values.
Blending Your Data Sources
Let’s create our blend.
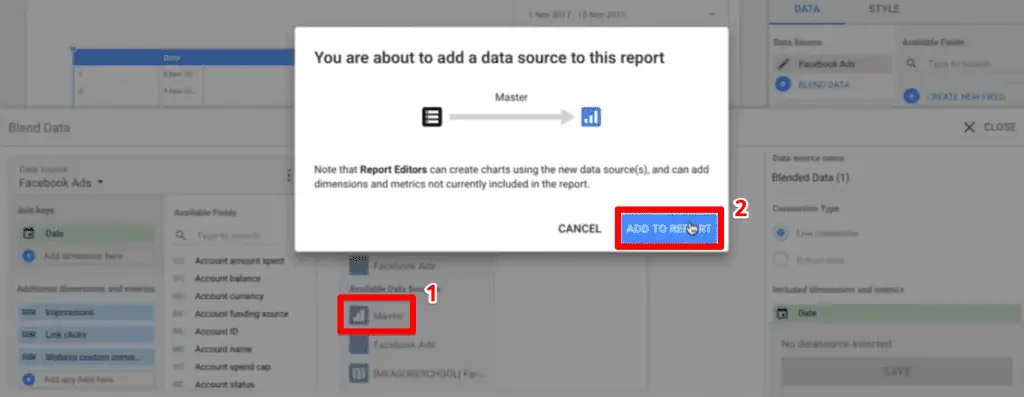
1. Click on Blend Data. This opens a new menu. Next, click on Add Another Data Source.

🚨 Note: As of February 2022, the terminology for the data sources column in the blend is changed to Table. With this, the add another data source option is changed to join another table.
2. Select your Google Analytics account, then click Add to Report.
Choosing a Join Condition
3. Next, to join the data with each other, you need to specify the join condition (previously join key). The join condition determines which rows in a pair of tables are considered to be matching.
In our case, the date dimension would suffice for the join condition. It is present in both Meta Ads and Google Analytics and would match up correctly.
If you want to use the source/medium or the landing page dimension as the join condition, the UTM parameters in your Meta Ads should be tagged correctly. This ensures that the data from these data sources can be aligned correctly.
Adding Metrics to Your Table
Now, let’s add a metric from our Google Analytics data source.
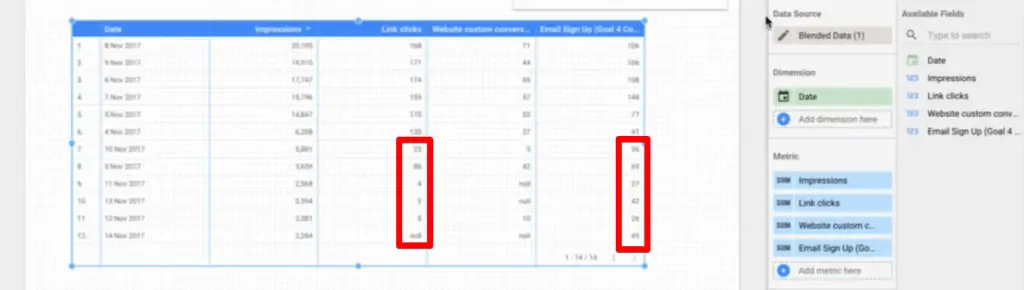
1. Select the equivalent variable of the conversion inputted earlier. In this case, we will select the email sign-up goal completion.
2. Search for your variable in the available fields. Click and drag this to the Additional dimensions and metrics section, then click Save.

Looking at the values in our table, there are dates where the number of email sign-ups is greater than the number of link clicks. Some rows even have a much higher difference than what we would expect – less than 5 link clicks having 40+ conversions.
When you pull data from a second data source, the values are not automatically filtered based on the primary data source.
Our Google Analytics account may have obtained email sign-ups from other sources than Meta. The currently displayed values in our table are the total goal completions from various sources.
Therefore, we need to implement a filter.
3. Click on the brush icon beside our blend.

4. Click on Add a Filter from our Google Analytics table.
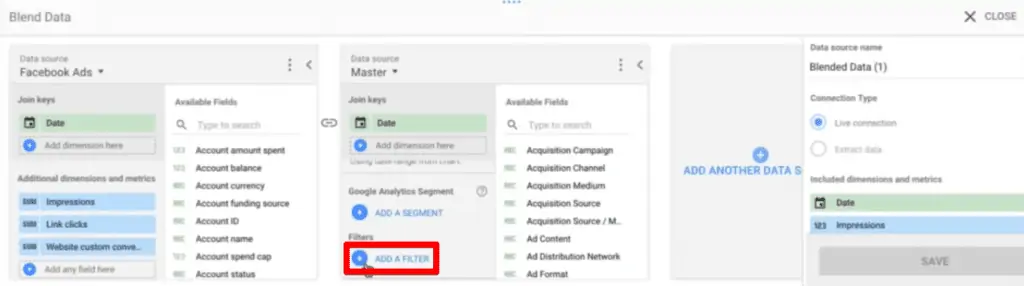
5. Create a name for the filter, which is specified to Include Source/Medium Contains facebook.com. Finally, click Save.

6. Next, click Save, then Close.
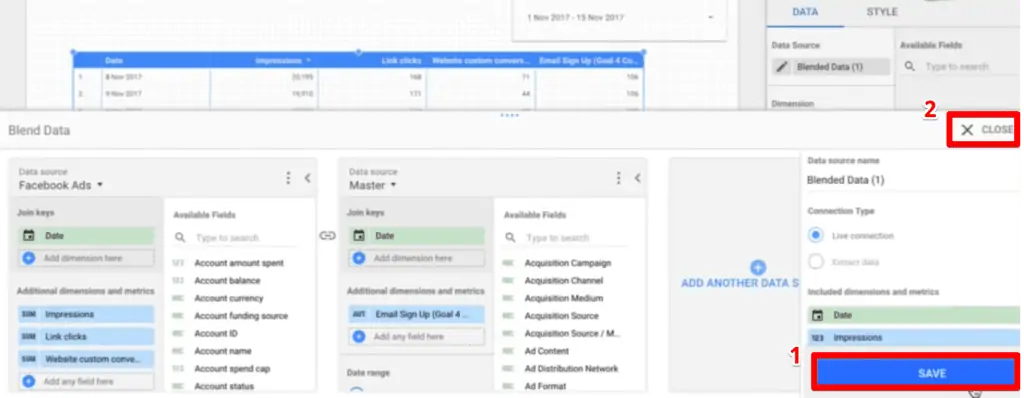
Our email sign-up data should now be filtered down.
Custom Metrics with Blended Data
Now, we want to know the conversion rates between link clicks and website conversions.
Since neither of our tools is set up to calculate the conversion rate, we need to make a custom metric or a calculated field.
The process of creating a calculated field for blends is similar to the one for a native data source. Follow the steps outlined in our Looker Studio calculated fields guide to create the conversion rate. Simply divide the conversions by link clicks.
Note that there are some key differences.
Custom metrics in a native data source require the data source editor rights, can be included in other calculated fields, and can be used in other reports and charts. All these do not apply to custom metrics for blends, as they are specific to the chart.
If you have created a table where your dimensions are the source/medium or the landing page, our guide on the conversion rate in Looker Studio for two metrics may be more helpful.
Keep in mind that although we have blended two data sources in one chart, only the metrics specified can be used in creating a calculated field.
The list of all metrics in the blend can be seen in the Available Fields at the right.

If you want to create other custom metrics in your blend using other data from your data sources, you have to go back to the blend properties and import those additional metrics.
FAQ
What is data blending in Looker Studio?
Data blending in Looker Studio refers to the process of merging data from multiple sources into one dataset that can be analyzed and presented in a single report.
How can I blend Meta Ads and Google Analytics data in Looker Studio?
To blend Meta Ads and Google Analytics data, you need to click on “Blend Data” in Looker Studio and add another data source (in this case, Google Analytics) to the blend. Specify a join condition, such as the date dimension, to match the rows in the tables. This allows you to combine and analyze data from both sources in a single report.
Why is data blending important?
Data blending is important because it allows individuals and businesses to compare and analyze data from different sources without the need for manual export and combination processes. It saves time, provides flexibility, and allows for deeper insights into the data.
Summary
That’s how to blend data in Looker Studio. We have discussed how to create a table, import another data source, and add metrics to the blend.
Upgrade your reports by checking out our guides on how to make your Looker Studio dashboards interactive and the best custom report types from the Looker Studio community visualizations.
Which platforms will you blend data from? What metrics will you compare using blended data? Let us know in the comments below!


")