
Last Modified on December 25, 2024
You can gain profound insights by combining Google Analytics 4 and Looker Studio. Part of the Google Marketing Platform, these two free analytics powerhouses work easily together.
This combination fulfills the dual need for straightforward access to the facts of your website and app performance and the ability to present it compellingly.
This empowers busy decision-makers to make informed data-driven choices without getting bogged down in technical details.
What we’ll cover:
- What Is the Difference Between Google Analytics 4 and Looker Studio?
- Can You Use Looker Studio With GA4?
- How Do I Connect Google Analytics 4 and Looker Studio?
- Do I Get Data From GA4 UI or Explorations?
- Can You Make Dashboards in GA4?
Let’s dive in!
What Is the Difference Between Google Analytics 4 and Looker Studio?
Although Google Analytics 4 and Looker Studio share some functionalities, they cater to distinct needs.
Google Analytics tracks activity on your website and apps. It’s a measurement tool, answering “what” questions like “How long do new users stay on my landing page?”
Setting it up requires technical knowledge, like installing a tracking code (gtag.js) on your website. Thankfully, tools like Google Tag Manager can simplify this process.
Google Analytics 4 (GA4) shows reports in tables and charts, along with advanced analysis features called Explorations. These tools help you monitor traffic, understand user behavior, and investigate your results.
Looker Studio, on the other hand, is a Business Intelligence (BI) tool known for its visualization capabilities. You can recreate many GA4 reports and analyses in Looker Studio. But the real benefit lies in its customization.
Looker Studio empowers you to tell a story with your data. You can perform calculations, manipulate text, design charts, and apply colors and styles.
This allows you to present data in an engaging and easy-to-understand format, even allowing viewers to interact with it.
These explanations highlight the core differences, but there’s more to explore with both tools.
GA4 excels at providing quick performance answers. While it’s more visually appealing than its predecessor (Universal Analytics), the information can be challenging to interpret, even for experienced users who need time to adjust to the new interface.
Looker Studio, on the other hand, focuses on making data comprehension easier. This is particularly helpful for decision-making, persuasion, explaining complex situations, securing budgets, and facilitating data exploration more intuitively.
Another key difference lies in data integration. While both are Google products, Looker Studio comes with partner connectors to connect to hundreds of platforms outside the Google ecosystem. This means you’re not limited to GA4 data.
You can pull information from a wide range of sources, from Google Sheets to Amazon.
Can You Use Looker Studio With GA4?
Not only can you use Looker Studio with GA4, but you should get a clear vision of your business and enrich how you present your data.
You can use Looker Studio with GA4 via a connector, which as the name implies, connects Looker Studio to your GA4 account where you can select the property you’d like to visualize. Both tools complement one another.
🚨 Note: If you notice any discrepancies between GA4 and Looker Studio reports, check out our guide on how to fix discrepancies between GA4 and Looker Studio.
How Do I Connect Google Analytics 4 and Looker Studio?
There are multiple ways to connect Google Analytics 4 and Looker Studio. They are:
- A Looker Studio connector (easiest method)
- Google Sheets
- Exporting GA4 data
- Google Sheets Add-on
Using A Looker Studio Connector
Looker Studio offers two types of connectors: free and paid.
The most common connector is the free Analytics connector provided by Google. We’ll walk you through using it in this section. The steps you learn here will apply to all connectors, including those from third-party partners.
🚨 Note: While the Analytics connector is sufficient for many users, it has limitations such as quota limits.
Another connector option is BigQuery. This solves data retention issues (BigQuery allows analysis of historical data beyond 14 months) and enables complex queries for larger datasets.
However, BigQuery introduces new complexities: cost management (queries can use more resources and require careful monitoring) and technical expertise.
To address these limitations, consider paid connectors from third parties. These often have additional functionalities, like caching your GA4 data to build reports without hitting quota limits.
Steps to connect GA4 to Looker studio using the GA4 connector by Google:
- Using your email (the one with the right credentials), sign in or go to https://lookerstudio.google.com/.
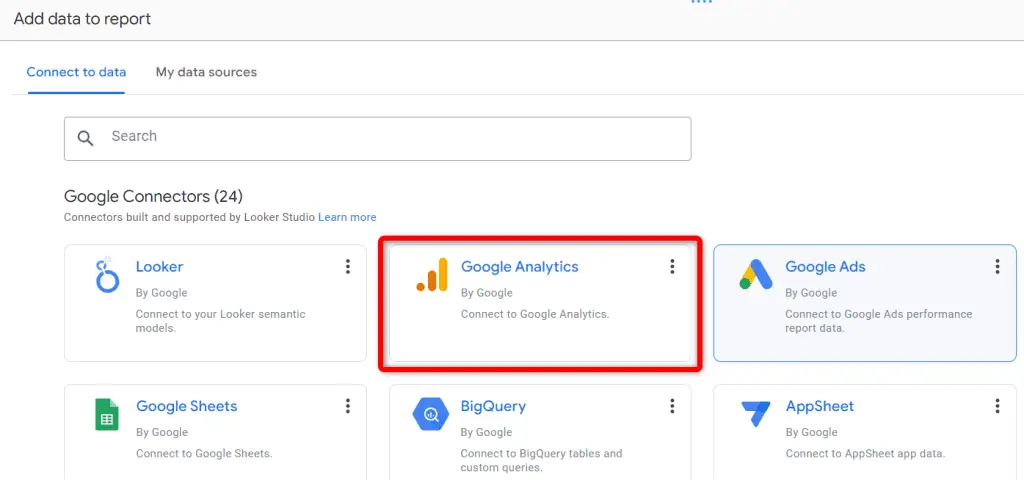
- Click the Create or the Blank report card.
- Select the Google Analytics connector.
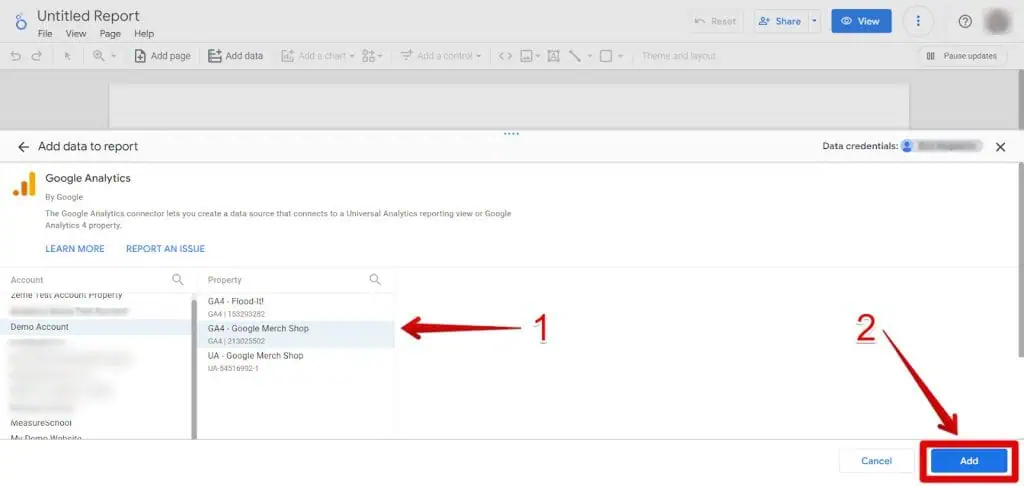
- Select your account and property.
- Click Add.
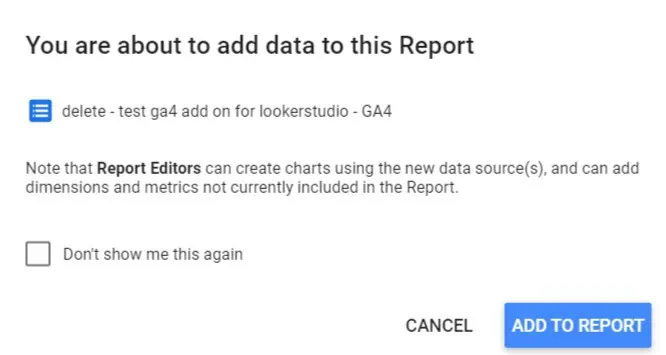
- Click Add To Report.
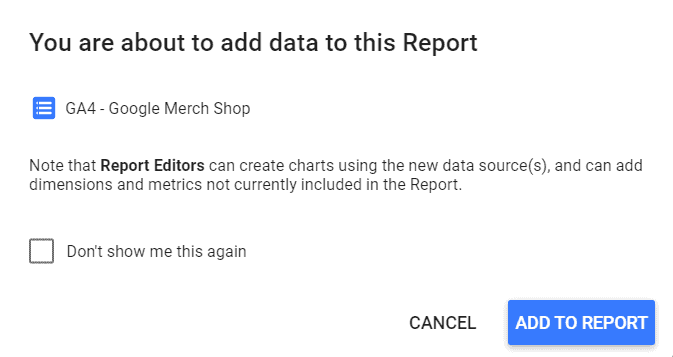
Wait a few seconds, and your GA4 data will become available.
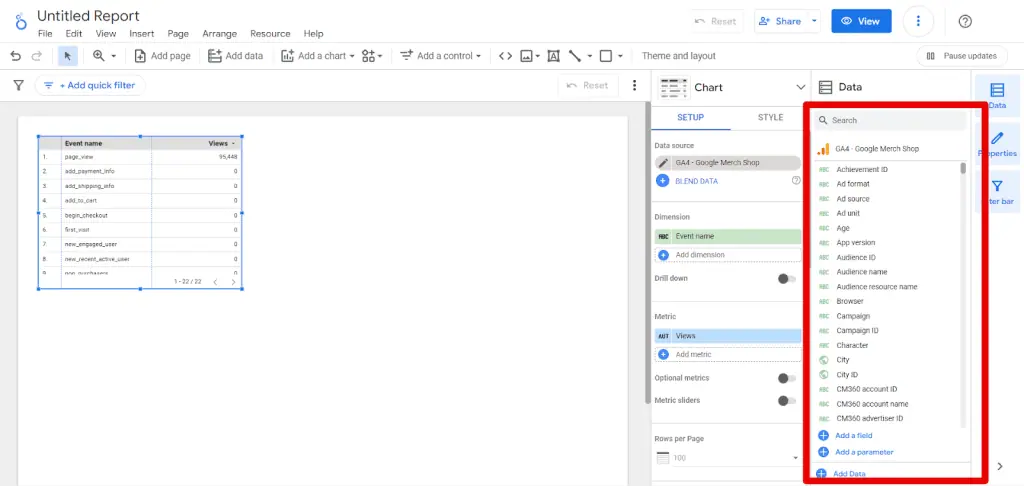
With your GA4 data source connected, head over to the Data panel, where you can leverage the available dimensions and metrics to build customized charts and reports.
Drag and drop dimensions (e.g., device type, landing page) and metrics (e.g., sessions, conversions) to build charts.
Google Sheets
Looker Studio is a powerful visualization tool, but it wasn’t designed for data storage. This can lead to slow loading times for reports and issues like reaching API quota limits with GA4.
Google Sheets offers a clever solution by acting as a bridge between Google Analytics 4 and Looker Studio. Instead of directly connecting Looker Studio to GA4, you can use Google Sheets as an intermediary.
This way, you select and store the specific GA4 data you need in Google Sheets periodically. Then, you use Google Sheets as the data source for your Looker Studio reports. This approach has several benefits:
- Unlimited Usage: You can use the data in your Google Sheet reports without worrying about exceeding any GA4 API quotas. This is because you’re not directly querying GA4 – you’re using the pre-populated data in your Sheet.
- Faster Report Creation: Unless you’re working with massive datasets (approaching 100,000 rows), this method significantly speeds up report creation thanks to the pre-stored data in Google Sheets.

How to Export GA4 Data to Google Sheets
Here are ways to export GA4 data to Google Sheets:
- Export a report
- Export a standard report
- Export Explorations
- Google Sheets Add-ons
- Free add-ons
- Paid-add ons
Export a report
🚨Note: Google Analytics exports up to 5,000 rows when you download a report as a CSV.
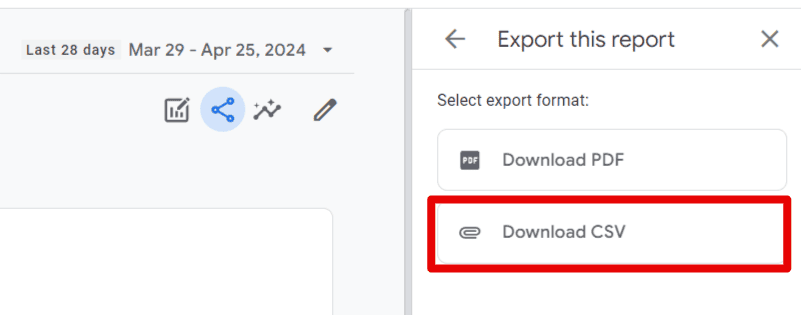
Export Standard Reports
- In GA4, click the share icon.
- Click Download file.
- Click Download CSV.
🚨 Note: You can upload your CSV file to Looker Studio using the File Upload connector. However, we prefer using Google Sheets since other partner tools offer the Google Sheets option.
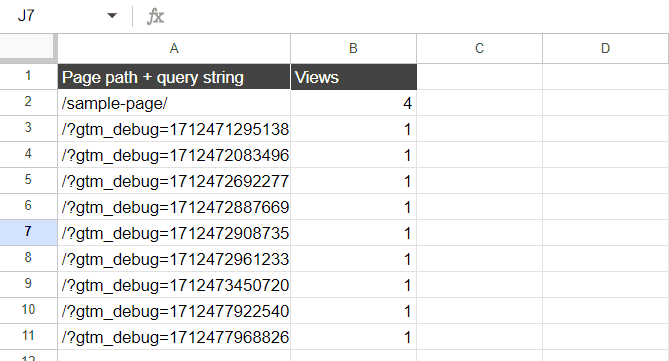
Import your CSV file into Google Sheets and format it. This is a key step for Looker Studio to recognize your data. Ensure only keep your columns header and rows without the total row in between. Here’s an example:
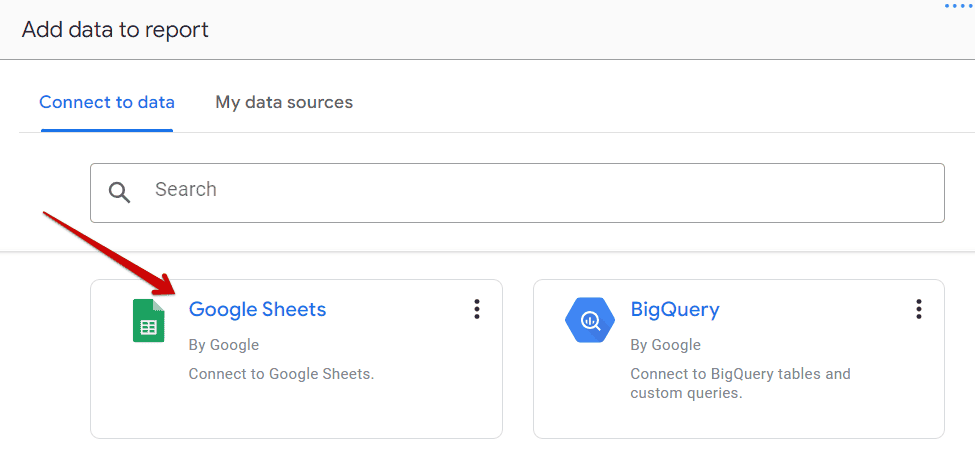
Then, go to Looker Studio and use the Google Sheets Connector.

- Select the right worksheet and spreadsheet (your sheet in Google Sheets).
- Click Add.

Click Add To Report (you may have to wait a few seconds).
Export Explorations
- In your Exploration, click Export data.
- Select Google Sheets.
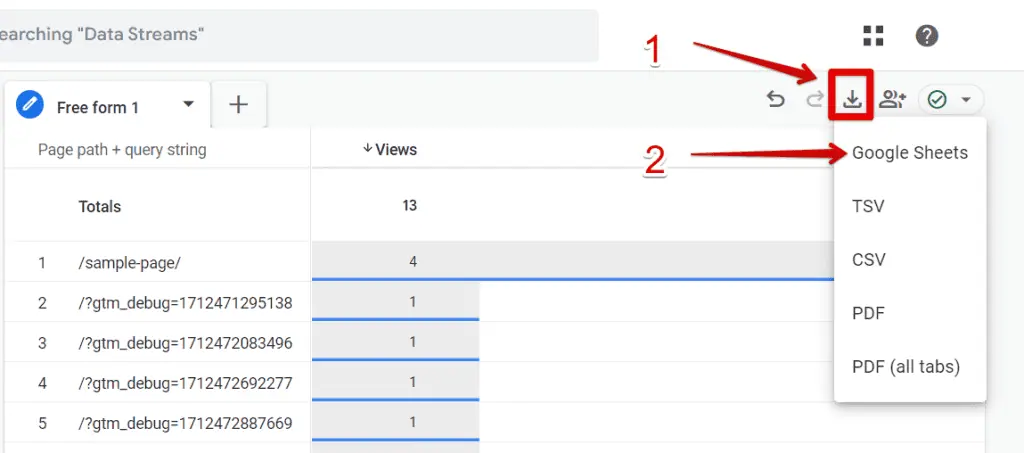
- In the new window, click Import the data.

In Google Sheets, format your data (see the previous section on how to do this). In Looker Studio, use the Google Sheets Connector.
Google Sheets Add-ons
🚨Note: The method to access your add-ons is the same for both free and paid options.
Free add-ons
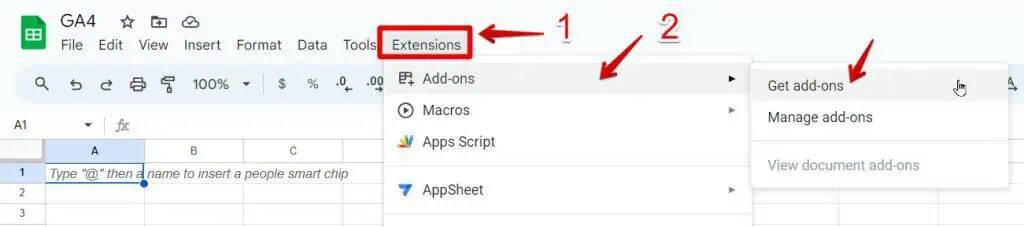
Open a blank sheet in Google Sheets.
- In the top menu bar, click Extensions.
- In the dropdown menu, Select Add-ons.
- Select Get add-ons.
- Select an Add-on.
- Select an add-on.

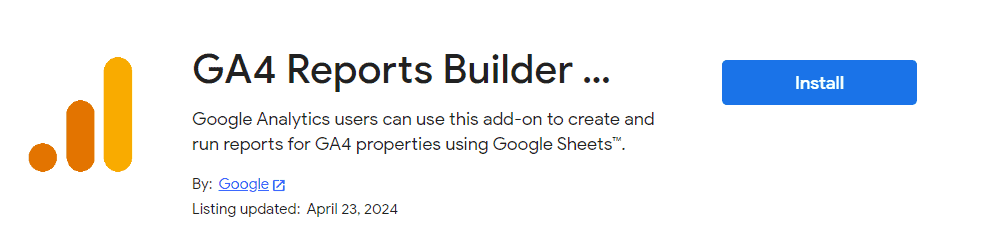
We’ll be using the free GA4 Reports Builder for Google Analytics add-on.
- Click Install.
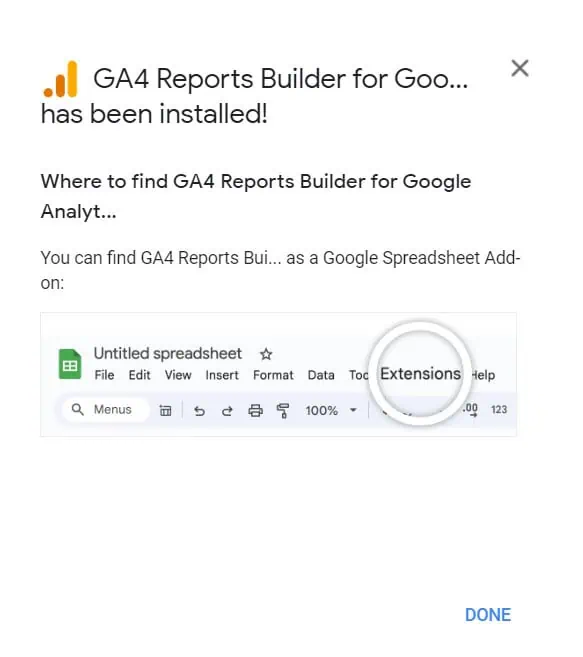
- Choose your Gmail account.
- Click Done.
Paid add-ons
Paid add-ons often provide more features and ease of use than free versions.
For example, free add-ons may lack automated features like data refreshes, requiring manual updates in Google Sheets.
However, as add-on features evolve, you can monitor improvements in free and paid options, as they can grow more advanced.
An example of an affordable add-on is the Two Minutes Reports for Google Sheets.
🚨Note: If you don’t see the option to run your report immediately, don’t worry! Simply refresh the page, and it should appear.
Do I Get Data From GA4 UI or Explorations?
While Looker Studio allows you to visualize your GA4 data, it currently only supports core reporting data. This means you won’t be able to directly access data from Explorations, GA4’s advanced analysis feature.
The GA4 connector relies on the Google Analytics Data API (GA4). This API exposes specific dimensions (categories) and metrics (values) that Looker Studio can use for reports.
You can find a detailed list of these supported dimensions and metrics in the API schema documentation.
Can You Make Dashboards in GA4?
Yes, you can personalize these dashboards for a familiar experience by arranging and editing them just like your standard reports.
However, these dashboards will focus more on rearranging existing reports and lack Looker Studio’s advanced features.
This means you won’t be able to combine data from multiple sources, use interactive filtering, or apply conditional formatting like color-coding performance metrics, etc.
Think of them as familiar report layouts but without the deeper customization options of Looker Studio.
Use this guide to learn how to customize your Google Analytics 4 reports.
Summary
Combining Google Analytics 4 and Looker Studio enhances your data analysis capabilities.
GA4 tracks website and app performance with detailed reports, while Looker Studio excels in data visualization, allowing for engaging, interactive dashboards.
Together, these tools offer comprehensive insights: GA4 provides the raw data, and Looker Studio transforms it into visually appealing reports. Looker Studio also connects to various data sources beyond Google, enhancing its utility.
Despite the benefits, connecting them can pose challenges like quota limits, and we’ve learned multiple ways to solve them.
With all these best practices, you can deepen your skills using our guide teaching all you need to know to get started with Looker Studio.
How have you been using Google Analytics 4 and Looker Studio? Let us know in the comments below.


")