Last Modified on March 25, 2024
In this article, we are going to show you how to calculate the conversion rate of two Google Analytics events using Looker Studio (ex Google Data Studio).
This technique to calculate conversion rates is super handy when you want to find out which step your customers are in when they drop out of your sales funnel.

Subscribe & Master the Basics with our FREE Looker Studio Course
There are a few ways you can investigate this, but in this tutorial, we’ll use Looker Studio to get the conversion rate between two metrics.
An overview of what we’ll cover:
- Set Up Your Report, Data Source, and Table
- Define Which Two Events to Find the Conversion Rate For
- The Problem: Calculating Conversion Rate in Looker Studio
- The Solution: Calculating Conversion Rate in Looker Studio
- The Sky’s the Limit: Go Crazy with Conversion Rate Analysis in Looker Studio
Let’s dive in.
Set Up Your Report, Data Source, and Table
If you don’t already have Looker Studio, you can make an account for free.
Our first step is to create a new report and connect it to our data source.
In this tutorial, I’ll be using the Google Analytics test data source, which is publicly available here.
🚨 Note: You can also use Looker Studio Connectors which are a great way to pull data from third-party data sources.
Of course, you can select your own data source if you already have your own conversions that you want to investigate.

Let’s take a look at the events in this data set.
For this tutorial, we want to see the Event Category, Event Action, and Event Label for all of our data.
These will help us identify what kinds of events we want to investigate.
We’ll click and drag each of these fields into our Dimension category.

For our Metric, let’s select Total Events.
Now our table will show us how many times certain events were tracked.
With this table, we can look for events that might give us useful information about conversion success rates.

💡 Top Tip: You can double click on any of these edges to quickly adjust the width of these columns of any table in Looker Studio.
Define Which Two Events to Find the Conversion Rate For
Now, let’s view our report and look at what kinds of events we have.
Most of them seem to be Quickview Clicks, but right now, we’re interested in the events Enhanced Ecommerce Add to Cart and Enhanced Ecommerce Product Click.

Why is focus on these two events for our tutorial?
Consider this: how many people who clicked on a product ended up adding that product to their cart?
Now, we could get a general idea of this by simply removing the dimensions for Event Label and Event Category.
We would be left with a table showing us raw numbers of how many Total Events we have for Product Click and how many we got for Add to Cart.
But this doesn’t help us very much when making business decisions.
Raw numbers are hard to visualize and calculate. Rather, it would be really helpful to know the conversion rate between these two steps that our customers take.
Say that only 1 in 20 (5%) of people who click on your product add that product to their cart. Wouldn’t you want to know that? I sure would!
So we want to calculate the ratio between the number of times visitors added a product to their cart and the number of product clicks.
This will effectively give us Product Add to Cart conversion rates.
Let’s head back into edit mode and learn how to define this kind of calculated metric in Looker Studio.
🚨 Note: Adding tooltip annotations to your Looker Studio reports adds extra information and provides context to viewers.
The Problem: Calculating Conversion Rate in Looker Studio
So normally when we want to create a calculated metric, we can click on the metric in the sidebar and create a field.
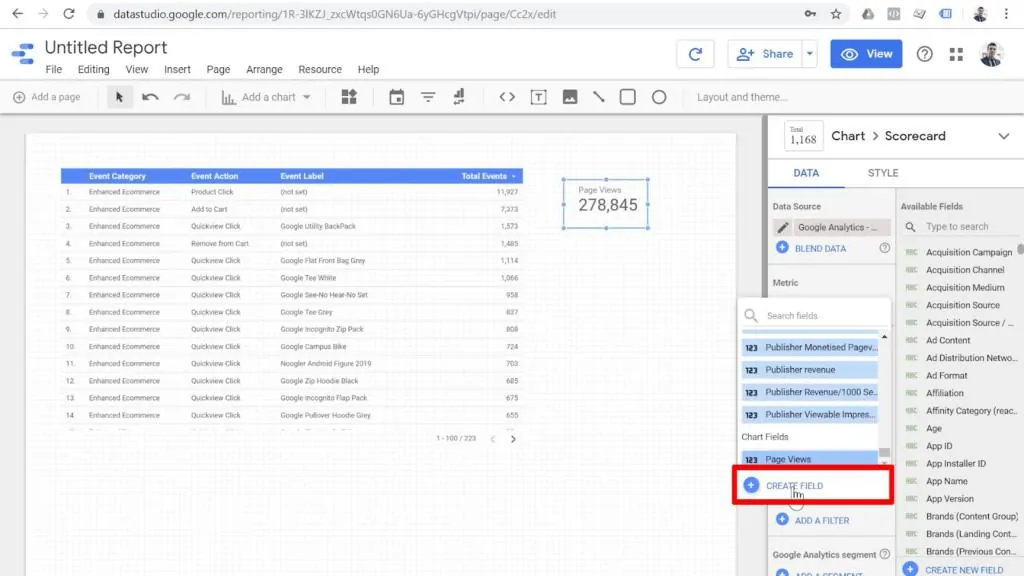
We can give our new field a descriptive name, like Product Click to ATC Conversion Rate.
For our conversion rate, we need a formula that tells us how many Add to Cart events we get per hundred Product Clicks.

But in this case, we can’t use a normal formula. This is because a normal formula involves arithmetic between two whole fields.
We can add two metrics together, or divide one metric by another, but we can’t do formulas with a subset of each metric.
For example, the metric that we are looking at right now is Total Events.
We can put Total Events in the formula, but we can’t divide it by anything else to give us useful information.
We can divide Total Events by Total Events (and get an answer of 1), but we can’t divide Total Events of one event type by Total Events of a different event type.
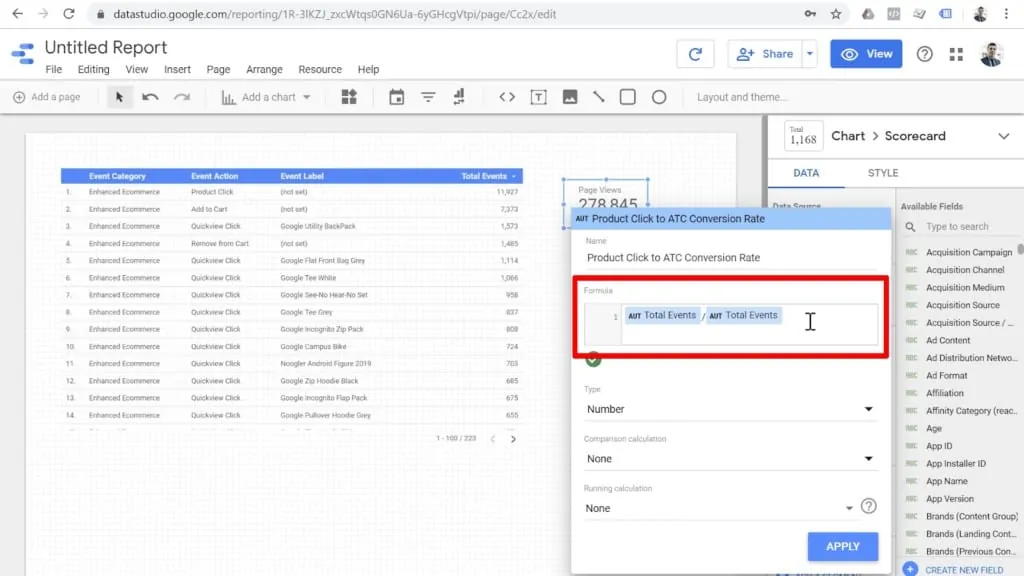
So we cannot use subsets of a single metric in our calculations.
We cannot specify for one group of events and divide it by some other group of events.
There is currently no way to directly tell Looker Studio’s formula bar that we want to do math with subsets of data.
Bummer—so what can we do?
The Solution: Calculating Conversion Rate in Looker Studio
Let’s check out this trick that allows you to calculate data subsets to get a conversion rate in Looker Studio.
1. Filter for a Specific Type of Metric You Want
First, we need to create a scorecard for our main metric, which is total events.

Next, let’s add the Total Events field as our Metric.
If we add a summary row to this table, we will see that the numbers match between our scorecard and the table.
So this is the total number of events recorded in this Google Analytics account at the time of this report.

But how can we get the number of total product click events?
To do this, we need to use a filter. In the Data tab for the scorecard, click Add a Filter.
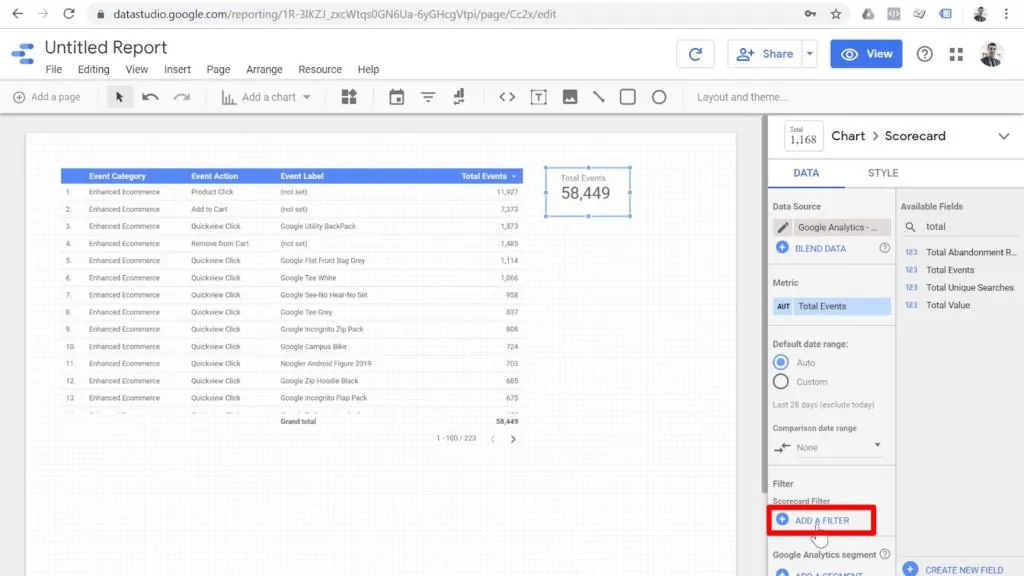
I recommend naming filters according to the exact criteria for that filter.
That way, when I’m looking at the list of filters in my Looker Studio reports later on, I will immediately know what this filter is doing.
In this case, we’ll name our filter Event Action = Product Click and configure it as Include > Event Action > Equals to (=) > Product Click.

This will filter the scorecard and show me the number of product clicks. Now, rather than total events, this scorecard is a filtered version of the total events.
Since we’ve used the filter, we need to edit our metric and rename it Product Clicks so that it is consistent with the data it represents.
Click the pencil icon next to the metric to rename it.
This will change the name of the metric just on our report and not on the data source level, which is perfect for our purposes.

Next, we’ll use Ctrl+C and Ctrl+V to copy and paste this scorecard. For our duplicated scorecard, let’s apply a different filter.

Let’s name our new filter Event Action = Add to Cart. Predictably, we’ll configure it as Include > Event Action > Equals to (=) > Add to Cart.
This is the event action that I want.mAnd we want to include event actions that are equal to Add to Cart.

We also need to edit and rename the new scorecard to reflect the data it represents.
Do this the same way we renamed the Product Clicks scorecard, but this time name it Add to Cart.
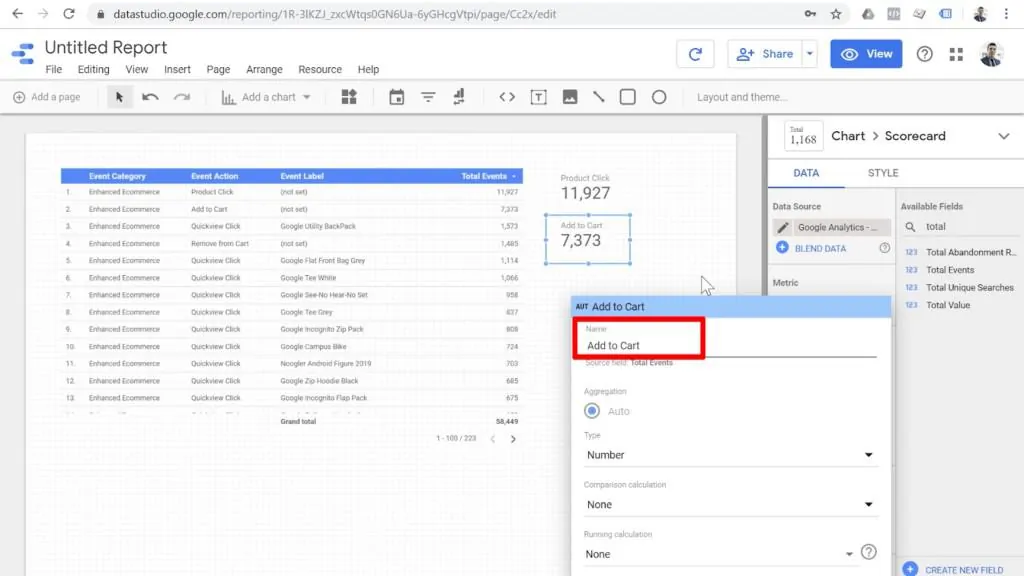
Now we should have two filtered scorecards: one for the number of product click events, and one for the number of add to cart events.
2. Blend Your Data Sources
Now here’s the trick. Once you’ve configured your metrics and filters so that you’re getting the numbers that you want, we still need a space to calculate our conversion rate.
This step develops the space for that formula.
Select both scorecards at once. You can do this with Shift+click or Ctrl+click, or by clicking and dragging over the both scorecards.
With both scorecards selected, right-click and select Blend data.
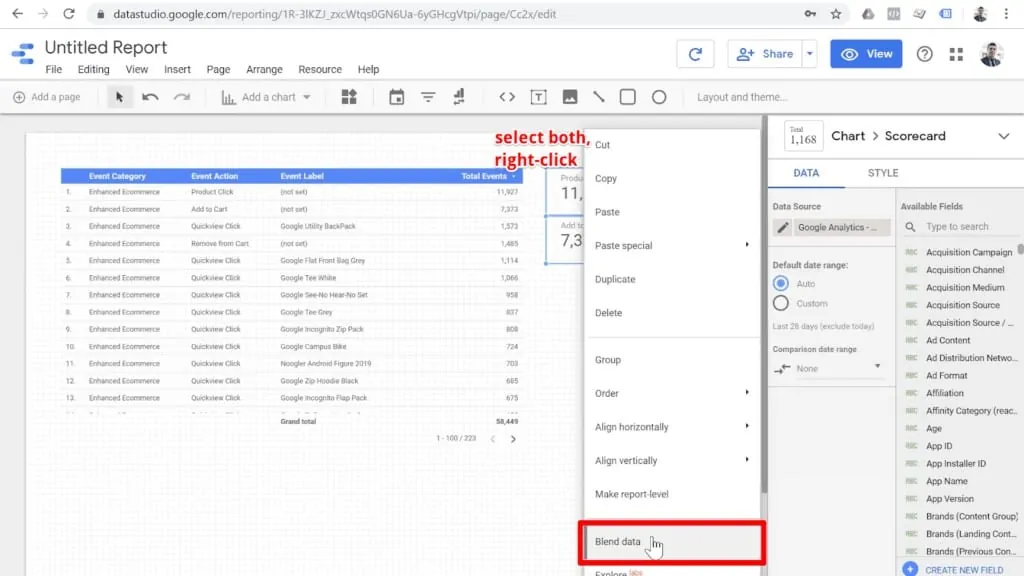
A new scorecard appears!

It will look very similar to the original two scorecards, but here’s the difference: if you check either of the first two scorecards, you’ll see that they are connected to Google Analytics – Google Merchandise Store as their data source.

Our newest scorecard, however, is connected to a source called Blended Data (1).

What is this blended data? It’s a combination of the two contributing data sources.
In this case, the two data sources are the actual scorecards Product Clicks and Add to Cart.
If you look at Available Fields in the sidebar, you will notice that the only two available metrics are the number of product clicks and the number of add to cart events.
3. Create Custom Field with Your Blended Data Source
Now we can finally use our data subsets to calculate a conversion rate between the two events.
Click on the metric for your blended data scorecard, then click Create Field.

Here, we can write a formula that will calculate our conversion rate. Let’s name this field CR: Product Click > Add to Cart (“CR” stands for “conversion rate”).
Now we can divide our Add to Cart events by our Product Click events. Set the Type dropdown option to Percent so that our outcome is a ratio, then click Apply.

In response, Looker Studio will ask you to choose an aggregation.
For percentages, I usually choose Average, since a sum aggregation might add percentages incorrectly if you’re reporting with a table that has a summary row.

And there it is: our conversion rate. It gives us the number of product clicks that lead to add to cart events, which it achieves by calculating between subsets of events that match our filter.
We can double-check this by manually dividing the numbers for Add to Cart and Product Click from our table to make sure that we have configured our scorecard and formula correctly.
We can now use this new conversion rate metric in all kinds of data reports and visualizations.

The Sky’s the Limit: Go Crazy with Conversion Rate Analysis in Looker Studio
You can use this same technique to blend and combine up to five different metrics.
In other words, any blended data source in Looker Studio can contain up to five different data sources. This creates a whole lot of possibilities for you.
For example, let’s say we also have events for product impression, product checkout, product remove from cart, and product purchases.
If you have all five of these metrics together in a single blended data source, then we can divide them together and come up with calculated metrics like product click-through rates, which would be the number of clicks divided by the number of impressions.
You could also find the checkout conversion rate by dividing the number of purchases by the number of checkout events. You could even determine checkout abandonment, which is one minus the ratio between product purchases and product checkouts.
The sky is really the limit here.
You can even apply this technique beyond events. We can use this method with sessions, goal completions, and more.
Basically, any metric in Google Analytics or any other data source can be filtered, blended, and calculated to create custom calculated metrics.
Product View Rates, Click-Through Rates, & Conversions Rates
Like with other metrics, you can use this technique on pageviews with great results.
For example, divide the number of pageviews on your cart page by the number of pageviews on other pages to see where users make purchasing decisions.
Some good divisors include your product page, category page, and homepage.
Click-through rates are another great metric to analyze using this method.
You can calculate click-through rates by blending and dividing the number of product clicks by the number of product impressions.
Full Funnel Drop-Off Optimization
Let’s say you have a funnel from the landing page, to order page, to thank you page.
You can have three different metrics of pageviews for these pages, blend them together, and calculate the conversion rate between each step.
This will give you a more complete picture of how users navigate your site.
With this analysis, you can compare the conversion rates between steps to find your strongest and weakest points in the funnel.
This technique is the bridge between basic conversion rate analysis and mastery of using conversion rates to optimize your site and maximize your business.
Also, customizing your data with Looker Studio functions for calculated fields can also be a good asset for upgrading your GDS game.
FAQ
What is the purpose of calculating conversion rates using Looker Studio?
Calculating conversion rates in Looker Studio allows you to analyze and understand the performance of your sales funnel. It helps identify the steps at which your customers drop out, providing valuable insights for optimizing your marketing strategies and improving conversion rates.
Can I use my own data source instead of the provided Google Analytics test data source?
Yes, you can connect Looker Studio to your own data source if you have existing conversions that you want to investigate.
Why is calculating the conversion rate important for business decisions?
Calculating the conversion rate allows you to understand the effectiveness of your marketing efforts and make informed business decisions. By knowing the conversion rate between different steps in your sales funnel, you can identify bottlenecks, optimize your marketing strategies, and improve overall conversion rates.
Summary
All right, so there you have it!
This is how you can calculate the conversion rate between two Google Analytics events with Looker Studio.
Did you know about this technique? Will this change your workflow, or do you have another method that you prefer?
Let us know your favorite way to calculate conversion rates in the comments!
Ready to hone your analysis skills in Looker Studio?
Check out our free Looker Studio Course, which includes bonus tools, exclusive lessons, and ongoing support for all your Looker Studio needs!

Subscribe & Master the Basics with our FREE Looker Studio Course




Been a while since I used Data Studio and I know a few good things have been added in the last months. Because of your video, now I know the blending technic, which is super cool and handy for funnel reporting. Thanks a lot guys 🙂
Hey – thanks for this – I’m looking for a solution on top of this – to display those Blended Data Source – as for instance the ConversionRate for each day (vertically) – is there a way to get those self built blended data souces into the charts + tables? Thanks a lot!
Really hard to read what you’re writing.
Thank you for this post. It is exactly what I had looked for. Excellent job
Sebastian
Awesome, just what I was looking for. (and found you in my first google search)
Thank you – this was extremely helpful!