
Last Modified on January 30, 2025
How can you tell a story by looking at your Analytics numbers? What data should you analyze first?
It is important not to get overwhelmed with your data. To be able to tell a holistic story by looking at your reports, it is crucial to ask the correct questions.
The ability to succeed with your collected data means identifying the key analysis points and not getting lost in the maze of numerous metrics and dimensions.
Moreover, it is important to learn to understand how your business realities are reflected in Analytics numbers.
In this post, we will cover 11 Google Analytics 4 metrics that should be the pillars of your comprehensive data analysis.
What is a metric?
A metric is a quantitative measurement represented as a sum or ratio. In other words, a metric is a set of numbers in Analytics giving you information about your webpage.
In this way, you can clearly outline the strengths and weaknesses of your business and identify the aspects to be improved. If you know how to read a report based on these numbers, you can bring your business to the next level.
Google Analytics 4 offers so many metrics to be tracked, but how can you focus on the most relevant ones?
We have outlined an overview of the Google Analytics 4 metrics that can help you provide valuable insight into your business performance:
- Users
- Sessions
- Engagement Rate
- Average Engagement Time
- Views
- Event Count
- Conversions
- Conversion Rate
- Lifetime Value
- Total Revenue
- Advertiser Ads Clicks
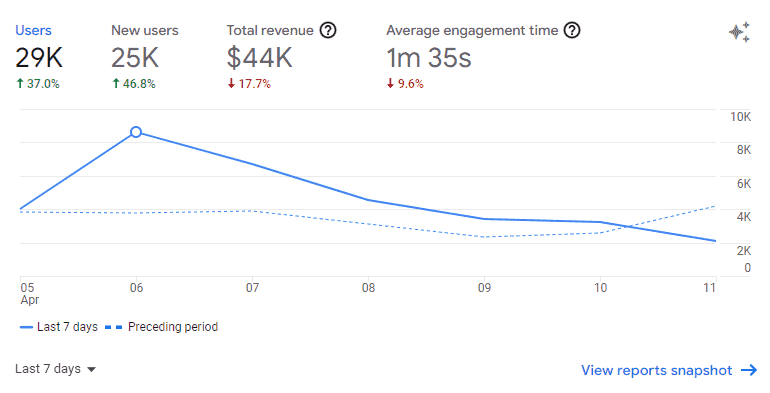
1. Users
The Google Analytics 4 users metric is a key metric allowing you to understand your target audience. It displays the total number of unique users who interacted with your webpage.
By analyzing this metric, you can find out how your customers are engaging with your webpage.
It can also help you understand if your content is interactive enough and if your business shows some positive dynamics in terms of user growth.
Actionable question: Is my content attracting more users?
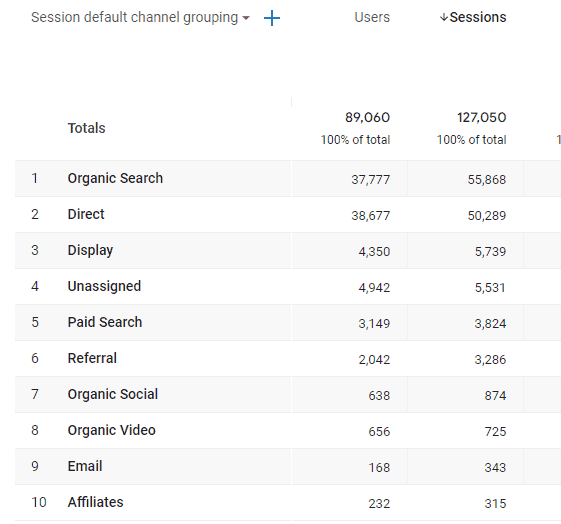
2. Sessions
This fundamental metric is showing you the number of sessions that began on your webpage or application.
Although the session-scope concept of Universal Analytics is not present in GA4, sessions still represent one of the key metrics in the reports.
Moreover, the metric itself has been considerably improved in comparison with UA, as new sessions are not initiated in GA4 if the same user comes from a different traffic source or keeps browsing your webpage at midnight.
Therefore, GA4 should reflect a more precise count of your webpage visitors.
The GA4 sessions metric is crucial for your thorough analysis, as it helps you determine how much traffic is generated and spot some trends in your users’ behavior.
Actionable question: How can I increase my traffic?
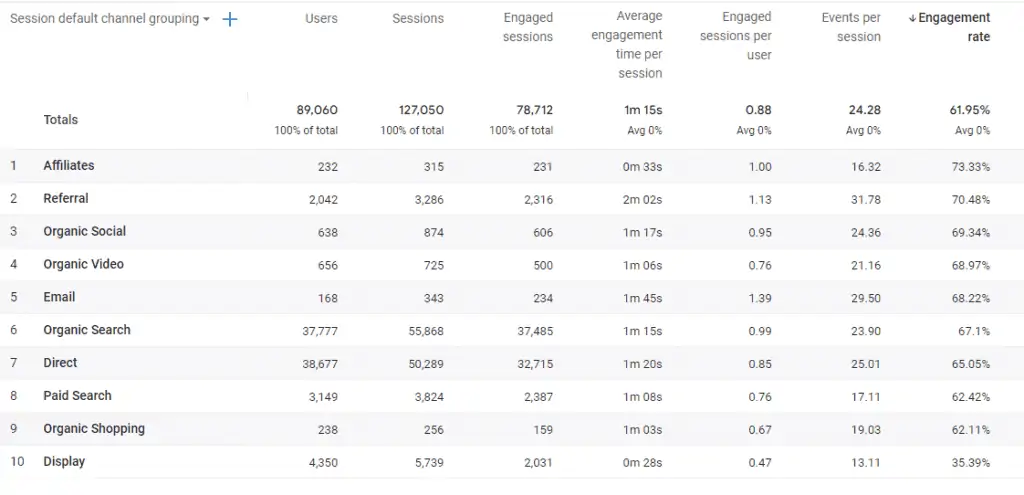
3. Engagement Rate
This is a new GA4 metric enabling you to identify how your customers are interacting with your content. It is also important to understand what an engaged session is in GA4.
A session is considered to be engaged if one of the following conditions is met:
- It lasted longer than 10 seconds;
- It resulted in 1 or more conversion events;
- It resulted in 2 or more page/screen views.
There is no doubt, that the new GA4 equivalent of the UA bounce rate is more efficient, as it gives us more information about true interaction with the webpage rather than users simply exiting your website.
The GA4 engagement rate is calculated in the following way: Engaged sessions divided by Sessions.
Engagement rate is a powerful metric that gives you an understanding of your user experience and how it can be improved.
In this way, you can identify if your content is meeting the expectations of your users.
Actionable question: Do my users find what they are looking for? How can I optimize my content?
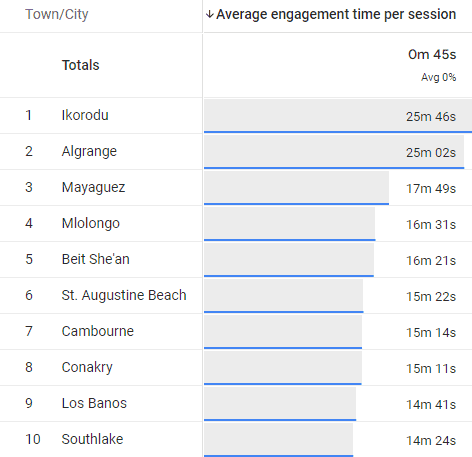
4. Average Engagement Time
This is an underlying metric showing you the average time your webpage was in the focus of your user.
The GA4 average engagement time is calculated as a sum of user engagement durations per active user. This number is important because it can tell you a lot about your user journey on your webpage.
The average time also depends on your business type and can vary. Therefore, it is recommended to look at this number within different timeframes.
This metric can help you evaluate different aspects of your webpage, including loading speed, the existence of errors, and interface user-friendliness, which constitute the decisive factors in active user engagement.
Thus, decreased engagement can give you some hints about webpage aspects to be improved.
Actionable question: What makes your website visitors leave earlier?
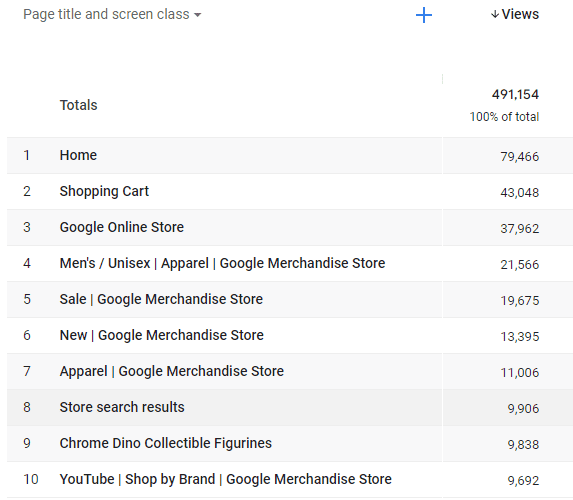
5. Views
This is another important engagement metric that shows the number of times a webpage or an app screen was viewed by your users.
By evaluating the GA4 views metric, you can come up with a viable SEO strategy. Moreover, views can help you identify how your webpage is performing and how website changes might be impacting your user behavior.
🚨 Note: When it comes to measuring SEO performance, we recommend these 10 reports in Google Analytics 4.
Actionable question: Are you offering a good user experience on your webpage?
6. Event Count
The GA4 event count denotes the number of times your users triggered a certain event. Uncovering the details of your user journey will allow you to understand your customers on a more profound level.
By providing such illuminating insights, you can acquire a wonderful skill – an outstanding ability to understand your users and thus serve their needs in a better way.
This would be a big win indeed, wouldn’t it?
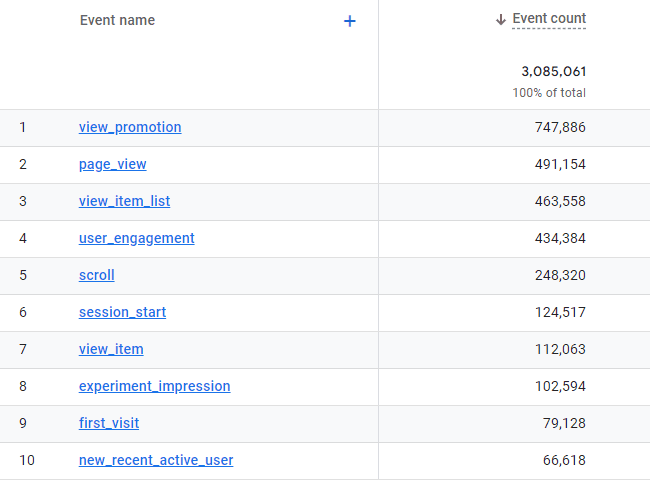
Actionable question: What are your top events?
7. Conversions
The GA4 conversions metric shows you the number of times a user triggered an event valuable to your business on your webpage.
Conversion data is an essential part of reports on your business performance. By tracking the key actions of your users, you can identify the optimal ways to improve your return on investment.
Not only does this metric show the level of your user engagement but it also points to your webpage user-friendliness, the effectiveness of your marketing campaigns, and established trends of your customers’ behavior.
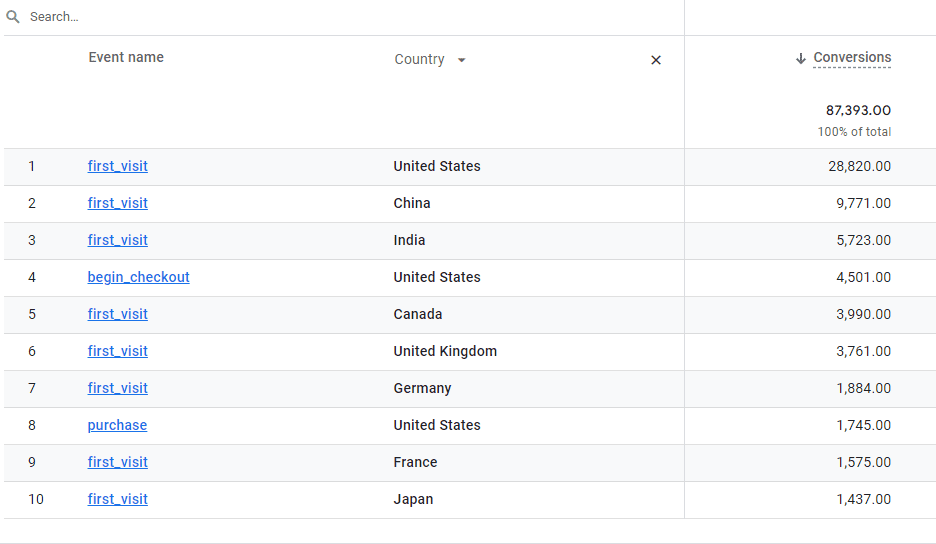
Actionable question: How can I optimize my conversion rate?
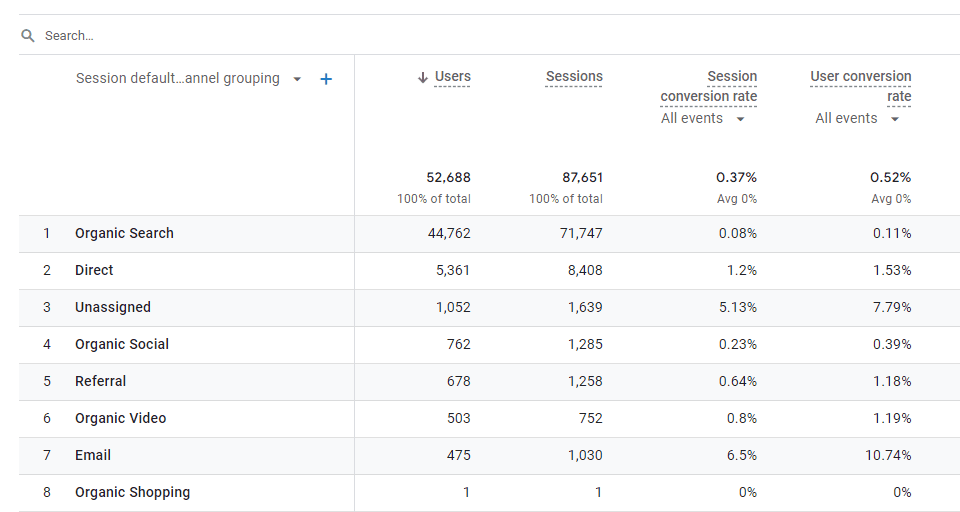
8. Conversion Rate
There is no doubt, that it is crucial to know the number of conversions but you should also consider another essential metric for your analysis which is conversion rate (CR).
It can help you provide insight into the performance of your campaigns or identify the channels that are performing better or worse.
When it comes to GA4, there are 2 types of conversion rates: User Conversion Rate and Session Conversion Rate.
In a nutshell, User CR is a percentage of converted users whereas session CR is a percentage of sessions in which any conversion event happened. Therefore, it is normal to have a higher user CR than session CR in your reports.
This metric lays the foundation of your marketing efforts, especially if you are running an eCommerce store.
Actionable question: Which traffic sources have top performance for your business?
9. Lifetime Value
This metric helps you understand how valuable your users are to your business based on lifetime performance.
You can use this metric in combination with acquisition sources to identify the most effective allocation of your marketing resources to get those users.
By analyzing the GA4 lifetime value, you can also determine which methods bring you high-level users. It also helps you determine how much money you should invest to acquire a new user.
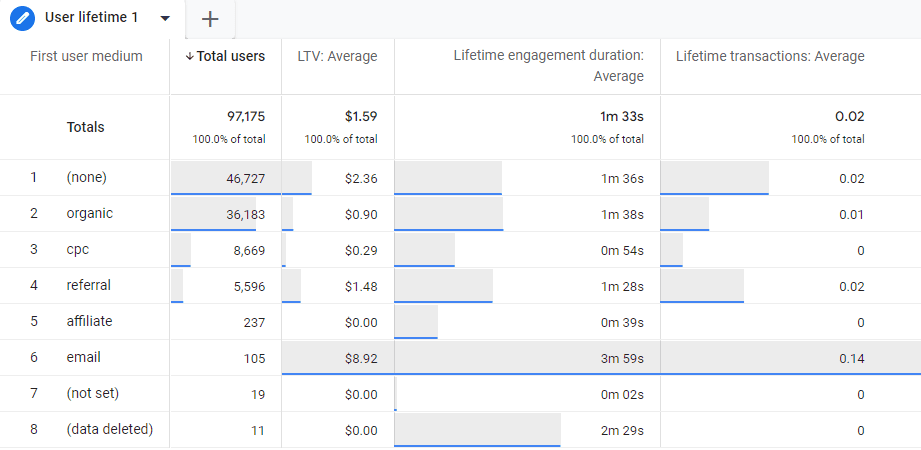
Actionable question: How valuable are my users based on lifetime performance?
10. Total Revenue
The GA4 total revenue metric shows the sum of revenue from purchases, subscriptions, and advertising. It helps you evaluate your business performance against your outlined objectives.
By looking at these numbers, the company can monitor its sales dynamics and make adjustments if necessary.
In addition, the total revenue metric can help you track your sales progress over time and make you think of feasible solutions for generating more revenue.
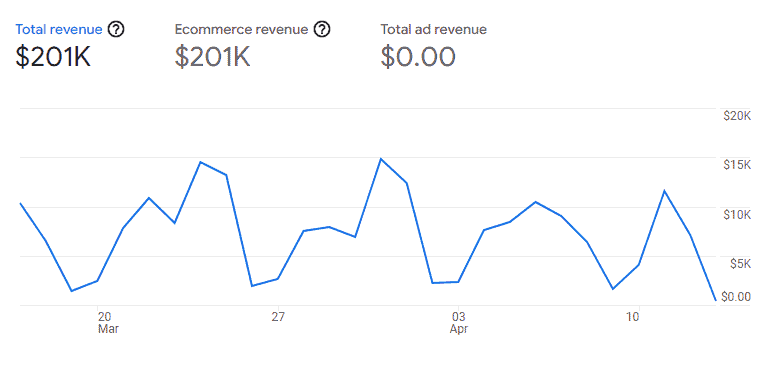
Actionable question: How can I encourage my users to buy more?
11. Advertiser Ads Clicks
This metric is important if you are running your ads campaigns. It shows you the total number of times users clicked on your ad.
The GA4 advertiser ads clicks metric is available in your reports if you have linked your GA4 to the ads platform.
Actionable question: Are my campaigns generating enough clicks?
Summary
There is no doubt that GA4 is a powerful tool that allows you to create custom metrics to understand your webpage performance. You can create comparisons and build segments to look at your data from different angles.
Such a potent combination of standard and custom metrics along with AI-powered predictions can help you dig deeper, understand your customers, and thus boost your marketing strategies.
🚨 Note: If you want to ensure your account is set up correctly, check out our handy GA4 audit guide.
To sum up, analyzing your business performance should always begin with identifying the key metrics for your reports.
Undoubtedly, each business encompasses its unique aspects and KPIs which should be taken into consideration when one selects metrics for analysis. Each chosen metric should reflect a certain business objective.
If you’re just starting, be sure to check out our Google Analytics 4 tutorial for beginners.
What GA4 metrics are you frequently using in your analysis? What are the key questions you are asking to be able to tell a story with your data? Please share your experience in the comments below.


")
If you are a content provider then I would argue that you care very little about Users and should focus all of your analytics around Active Users. I would also suggest changing your definition of an Active User to someone having an Engaged Session greater than 10 seconds. If you are a Content Provider do you care about a User if they are on your site for a period of time that DOES NOT allow them to digest your material. Probably not.