
Last Modified on January 7, 2025
The term “active users” can be misleading. Often people think that an active user is the same as a real-time user, that is, a user on the site now.
This article will review what GA4 active users are, the main difference with Universal Analytics, and where to find active user reports.

Master the basics with our FREE GA4 Course for Beginners
- What are GA4 Active Users?
- Which User Does GA4 Consider Active?
- What is the Difference Between Active Users in Universal and Users in GA4?
- Active Users in GA4 Reports
🚨 Note: If you’ve confused active users with real-time users and you are looking for details on people currently active on your website or app, skip this post and read this ultimate guide to GA4 real-time reports.
Let’s dive in!
What are GA4 Active Users?
GA4 Active Users refers to the number of unique individuals who engage with your website, app, or digital platform within a specified time frame.
Google Analytics 4 automatically collects active user data, and you can get the reports based on active user data in terms of one day, 7 days, and 30 days.
It is a crucial metric that provides insights into user engagement and retention, offering marketers a comprehensive understanding of their audience’s behavior and the effectiveness of their marketing efforts.
Which User Does GA4 Consider Active?
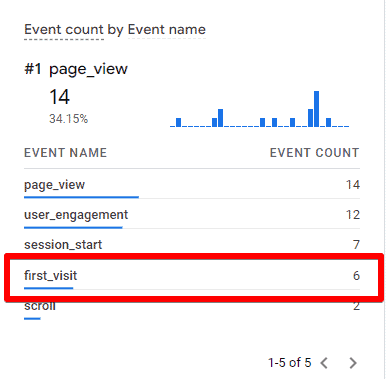
An active website user is defined as someone who has engaged in a session or triggered an automatically recorded first_visit event or engagement_time_msec parameter in Google Analytics.
To be considered an engaged session in GA4, the user must actively interact with the site or app for at least 10 seconds (by default) or the value you set in your counter settings, make at least one conversion, or view two or more pages/screens.

Thus, if the session lasts longer than a specified time, it becomes an engagement session. The time stamp condition added to Google Analytics 4 is crucial and changes a lot.
If a user is on the site for less than 10 seconds without any interaction, the session is classified as a rejection (without interaction).
If a user is on the site for more than 10 seconds but still does not perform any events, it is considered an engagement session. If you want to change the default engagement time, go to this chapter.
The first_visit refers to one of the automatically tracked events that fire immediately after a user’s first visit to your site.
You can see it after you set up Google Analytics 4 counter, activate the DebugView tool, and make your first visit to the site.
When first visiting a website, a distinct user ID or Client ID is assigned to your browser through a Google Analytics cookie and you see the first_visit event.
By linking this ID to all subsequent activities on the website such as page views, transactions, and events, GA4 can determine whether a user is new or not.
In GA4, a new user is identified by the presence of the “first_visit” attribute.
Moreover, “engagement_time_msec” refers to the amount of time (in milliseconds) that a user actively interacts with the website or mobile application as recorded by the “user_engagement” event parameter.

Google Analytics 4 registers this event when a user enters a page, interacts with it, or when navigating to another page.
The times from all interactions are then summed up and then averaged to calculate another metric, Average engagement time.

Based on these additional details, we can conclude that GA4 active users are new users with the first_visit event or a visitor who has at least one session with an interaction for the date range or has an engagement_time_msec parameter.
One more point to consider is that Google Analytics may not consider user engagement if there is no interaction in the session since the previous event.
In particular, this happens if the first_visit and session_start events are registered since there are no interactions before them. Also, the interaction time cannot be taken into account for the first event on the page (for example, page_view).
Take note! GA4 can log events without user engagement in a session, per official Google documentation.
For instance, spending 4 seconds on a page records an engagement_time_ms of 4000 milliseconds, but it doesn’t count as an engagement session.
Changing the Default Time of an Engaged Session in GA4
To be considered an engaged session by GA4, it must last 10 seconds or more. This timing is set by default. What if we want to change this metric by increasing the time to 30 seconds, for example?
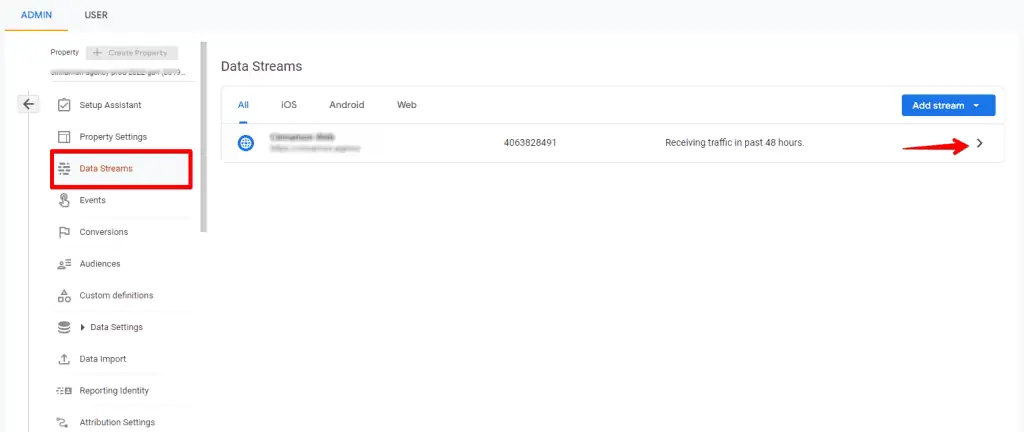
1. Go to Admin, and open your Data Stream.
2. In the opened window, click on Configure Tag settings.

3. Click to show all settings and find Adjust session timeout.

4. Adjust the time for engaged sessions and save changes.
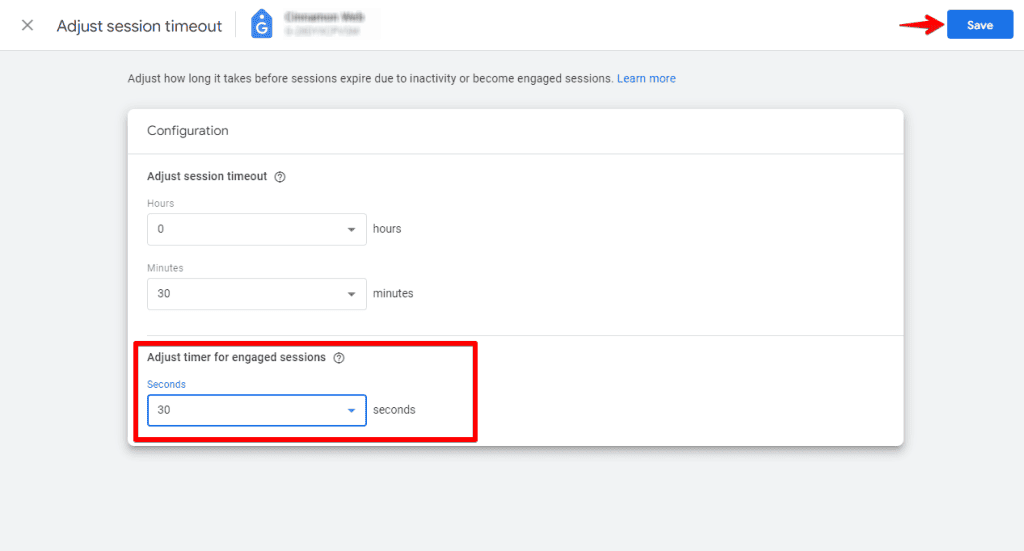
So now sessions that will last more than 30 seconds will be considered engaged.
What is the Difference Between Active Users in Universal Analytics and Users in GA4?
How do Google Analytics and Universal Analytics compare?

GA4 active users are given a central place, and this is one of the biggest differences between GA4 and Universal Analytics. While UA focuses on total users in most reports, GA4 focuses on active users.
This change means that in Google Analytics 4, the number of active users is likely to be higher than in Universal Analytics since they are automatically discovered.
So if you are still using the UA resource along with the new GA4 resource, keep that in mind.
Active Users in GA4 Reports
You can find the Active Users metric in many standard GA4 reports such as Traffic Acquisition, Pages & screens, Demographic details, Technical Data, etc. Let’s take a closer look at some of them.
Active Users in the Traffic Acquisition Report
Here you can see a metric called Users, but when you hover over the sign, you will see that it is referring to active users.

Active Users in the Engagement Report
GA4 does not have a separate report on active users. To view data on them within your apps, you can go to the Engagement section.
The reports in this section allow you to view data on audience, events, monetization, and users. To find the Engagement overview within the Games reporting collection, follow these steps:
On the navigation bar on the left, click Reports, then Engagement.

User Activities Over the Time
First, let’s take a look at the chart in the upper right corner – “User Activities Over Time.”

In this chart, you’ll see a breakdown of active users per day, 7 days, and 30 days:
- Active users per day. These are the users who visited the site on the last day, including the last day in the report range. It is a synonym for the term “active users.”
- Active users for 7 days. Those users who visited the site in the last 7 days, including the last day from the report range.
- Active users for 30 days. Those users who visited the site in the last 30 days, including the last day in the report range.
Comparing the number of active users over time helps determine the retention rate of a website and mobile apps. You can view how often the user returns to the site.
User Stickiness
Another user report worth considering is User Stickiness.
This is a new setting that was launched in GA4. User Stickiness is a measure of how often users visit a site.
The chart shows how many users visited the site on a daily, weekly, and monthly basis, and provides ratios for comparisons.

These ratios include:
- Daily active users (DAU)/Monthly active users (MAU)
- Daily active users (DAU)/Weekly Active Users (WAU)
- Weekly active users (WAU)/Monthly active users (MAU)
As in the previous roundup, user retention is key here. You can quickly see how the changes and new activities you implement affect your visitors and how loyal they are to your brand.
If you hover over the chart, you will see that the data is drawn automatically based on the date.

By analyzing this graph, you can draw the following conclusion: if you have high percentages on the coefficients mentioned above, this means that users visit your site with pleasure and return regularly.
Active Users in the Exploration Reports
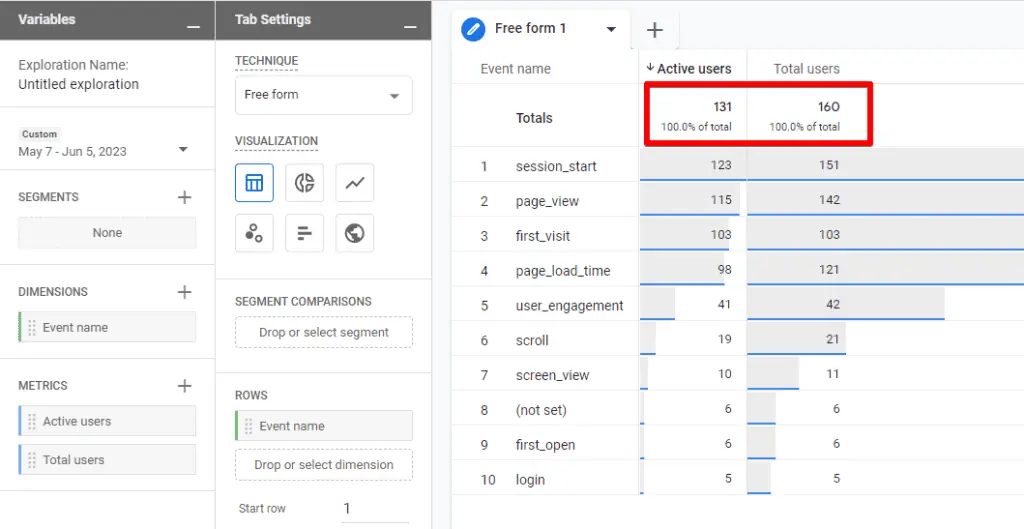
To build a graph in Exploration, we need to import from the User section a metric called Active users.

Next, we should add the Event name as a dimension and double-click to add metrics to our report.

As we described earlier, the number of active users (Active Users) is not equal to the total number of users (Total Users).
If you add these two metrics to our Exploration report, you will see different values. The total number of users will be higher than the number of active users in GA4.
Active user metrics are simple, but it is important to understand that they are not the same as real-time users. It is also critical to understand the difference between active users and the total number of users.
Active user reports help you analyze visitor behavior over time and understand how your initiatives affect user retention, as well as determine which campaigns were the most effective.
Summary
In conclusion, understanding the concept of active users in Google Analytics is vital for measuring user engagement.
We have explored the definition of active users, highlighted the differences between Active Users in Universal and Users in GA4, and provided an in-depth overview of Active Users in GA4 reports.
By unlocking the power of active users, you can optimize your strategies for traffic acquisition, engagement, and exploration.
We also recommend delving into the topic of user engagement and learning how you can set up a bounce rate that is not in GA4 by default. Read more in our article All About GA4 Bounce Rate.
Now, we’d love to hear from you: What strategies have you implemented to enhance active user engagement on your website or application? Share your insights and experiences in the comments below!
Master the basics with our FREE GA4 Course for Beginners


")
Hi, I wonder how come the active user is different to the number of total user under event “user_engagement”, thanks
simply because they are defined differently.
Hi, a active user is always a active user? so never downgrade if it keep the cookies?