
Last Modified on September 6, 2024
Annotations in GA4 allow you to create notes for specific dates.
Typically, you will use annotations for new launches, website changes, campaigns, press releases, and even management changes. They are often useful in explaining large variations in your data, such as spikes or dips (anomalies) and trends.
Unfortunately, this feature, which was available by default in GA3, is not available in Google Analytics 4.
It’s difficult to understand why they removed this feature. However, there are some easy workarounds that we will cover, as well as sharing some tips on how to leverage them.
This little addition can save you hours of investigative work, so don’t take it lightly.
Here’s what we’re going to cover:
- Google Analytics Annotations Examples
- Are There Annotations in GA4?
- How Do I See Annotations in Google Analytics?
- Website Plugins
- Browser Extensions
- Annotations with Google Sheets
- Looker Studio Annotations
- How to Export or Download Google Analytics Annotations
Let’s dive in!
Google Analytics Annotations Examples
Here are examples of when to use annotations:
- Any changes that can impact your analytics (e.g., a new tracking method, adding a user to your GTM container, etc.)
- Campaign launches (PPC, email, etc.)
- Offline advertising (TV, radio)
- Management changes
- Website changes (design, new plugins, etc.)
- Events (sales events, holidays, Christmas, etc.)
Here’s a typical example I recently encountered. A construction company migrated from GA3 to GA4 using the GA4 Setup Assistant to automatically create a property.
The issue, as is often the case with migrations, was the significant differences in traffic and conversions between Universal Analytics and GA4. What was there to do?
We initially looked into the common leads for such cases, including tracking problems, and indeed, we found a case of double tracking. However, despite identifying this, the differences remained substantial.
After a deeper investigation, we noticed that the traffic volume anomalies preceded the migration to GA4. We checked UA and observed that the anomalies originated from a country not targeted by the company, and its language was not accounted for on the multilingual site.
It was clear that we were dealing with bots since the engagement metrics were null. Additionally, during the same period, the site’s online shop, which was on a subdomain, had been removed, resulting in broken links (404 pages) that needed fixing.
The moral of the story – notes about these changes would have reduced the investigative work and allowed us to focus on improving user experience and conversions.
Are There Annotations in GA4?
GA4 lacks a built-in feature for adding annotations. However, we’ll discuss some solutions, including:
- Website plugins
- Extensions
- Google Sheets
- Looker Studio
How do I See Annotations in Google Analytics?
Currently, the only way to view your annotations directly within GA4 is by using an extension such as the Automated Google Analytics Annotations GA4-UA.
If you’re using a plugin, you’ll likely be able to view your notes within the GA4 reports replicated within your CMS. Once you’ve downloaded either the plugin or the extension, simply click the notes icon.
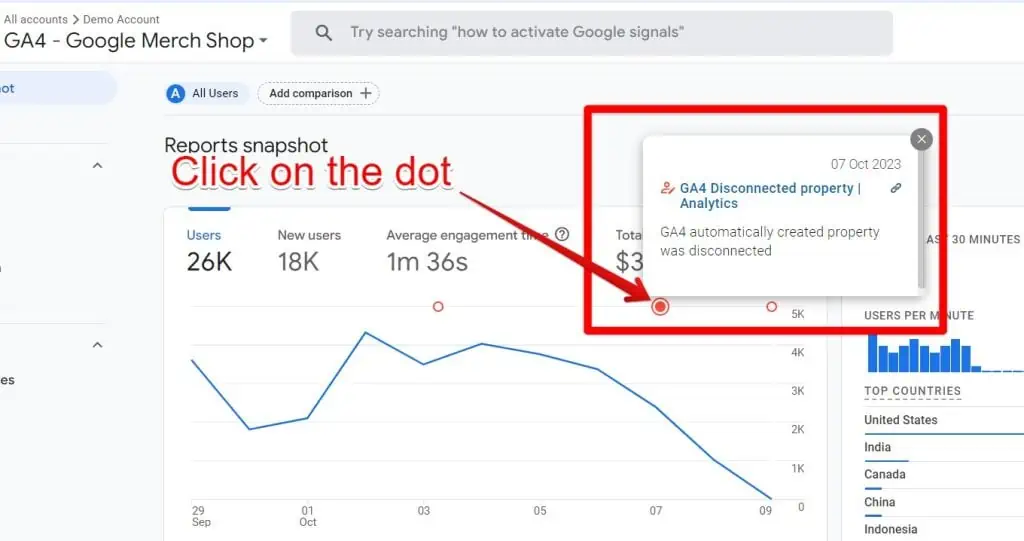
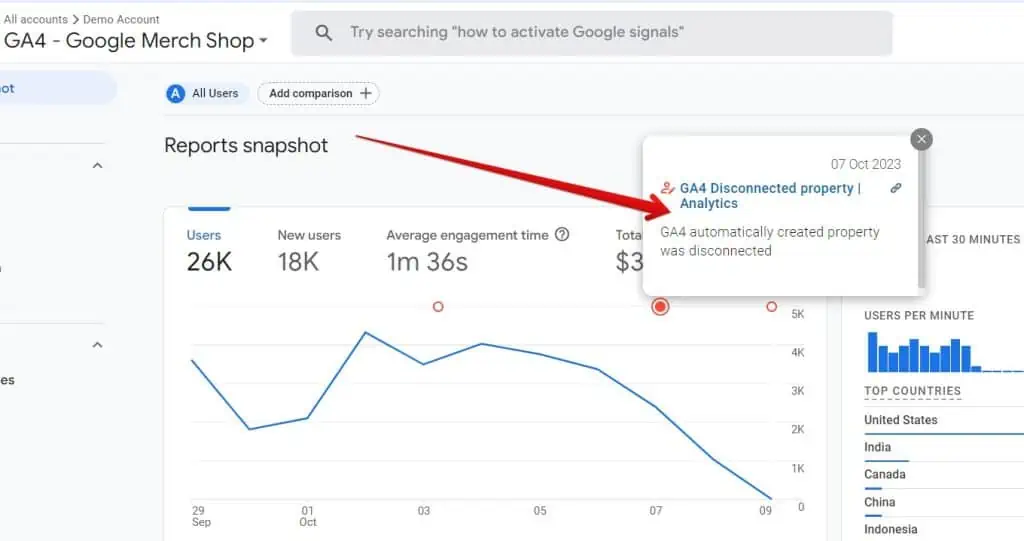
For example, to see annotations in Google Analytics using the Crystal Ball extension, go to one of your charts in GA4 and select one of the red dots at the top of the chart. An info box will appear displaying your annotations.
Let’s look at each option step by step.
Website Plugins
Because many users have set up Google Analytics through a plugin within their CMS, it makes sense to consider starting with a plugin if you don’t plan to change this setup. Using a plugin offers several advantages over other methods.
First, it’s easy to set up, and depending on the plugin version, you may have additional features to gain more insights into your traffic changes.
For instance, the “Site Notes” pro feature in the MonsterInsights plugin enables you to add images and create unlimited custom categories that you can easily organize and filter.
Therefore, it’s a good idea to look for a similar plugin compatible with your CMS.
🚨 Note: Contrary to what blog articles may suggest, the MonsterInsights plugin doesn’t enable direct visibility of your annotations within GA4. However, you can view them within the GA4 MonsterInsights reports.
Browser Extensions
The extension is the most popular solution for adding annotations in GA4. What sets it apart from other solutions is the possibility of viewing annotations within GA4, as you can see here:
You can download the Automated Google Analytics Annotations GA4-UA extension by Crystal Ball to add annotations in GA4. The following page explains the basic setup and usage of the extension.
The extension also has integration capabilities with other platforms such as Google Tag Manager and allows you to organize your notes in an online account that you can then sort by category.
The extension makes it possible to name your event (not to be confused with the GA4 event), create categories, and add links and a description of your event according to your date selection, as below.
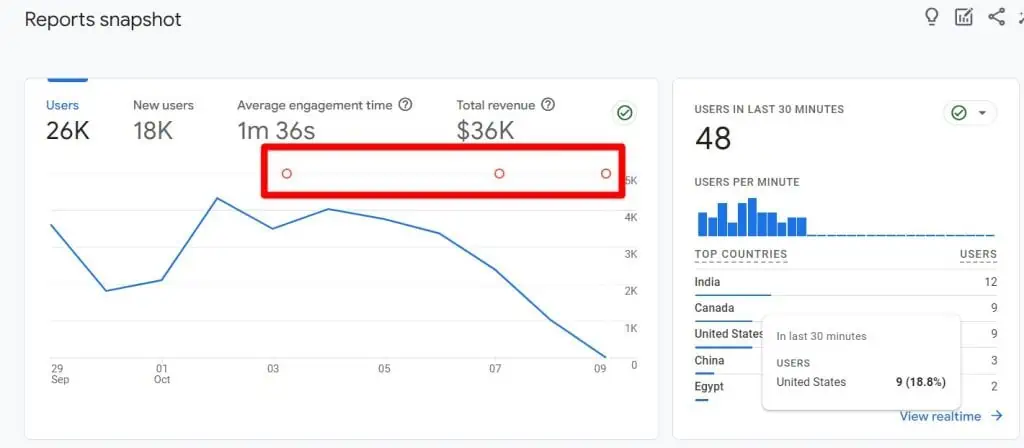
To know if the extension is working, you will see a small empty red circle in your chart (works also in the GA4 demoshop).
However, to use it, you should be aware that your data, including passwords, credentials, security questions, or personal identification numbers (PINs), are involved.
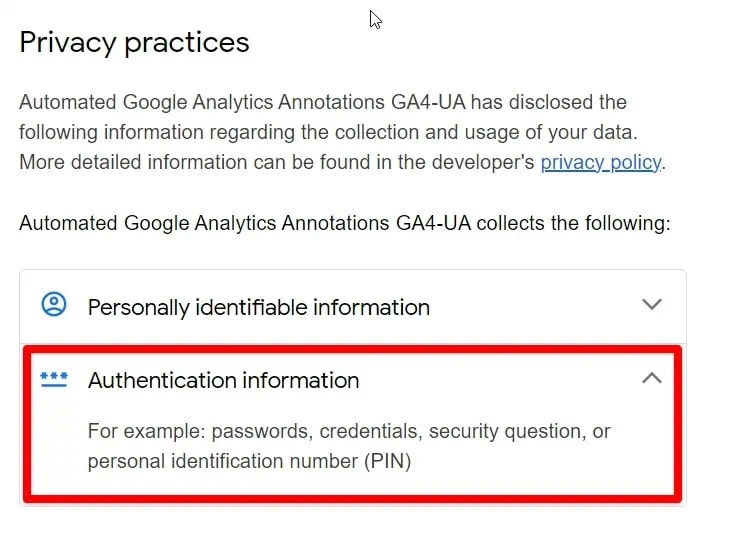
This is why we also suggest using Google Sheets. Not only do you avoid exposing your data and strategies, but you can also add more context to a spreadsheet. We discuss this in the following section:
If disclosing private information is not your concern, this extension will do the job.
Now that you’re aware of this, there are two ways to add annotations: using the extension on GA4 or the extension’s dashboard.
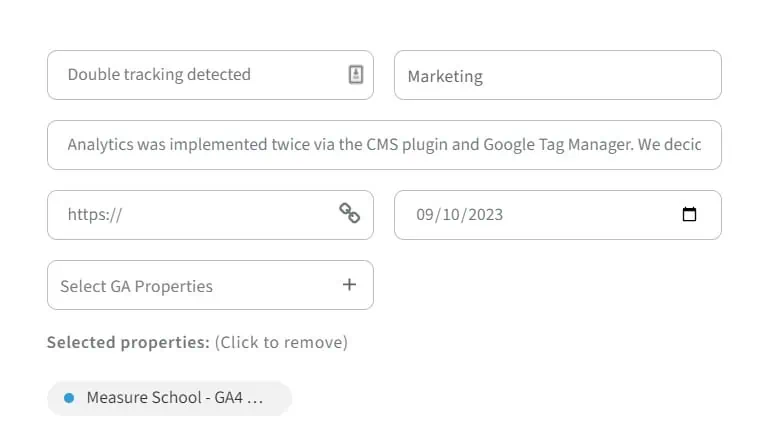
One issue with the extensions is that you can’t edit your annotations. You also may not be able to select your different extensions when installing the extension for the first time. But you easily solve both issues by using the extension’s dashboard.
To go to the dashboard, click first on the extension. Then, hover on your profile image and select Dashboard. This will direct you to your dashboard.
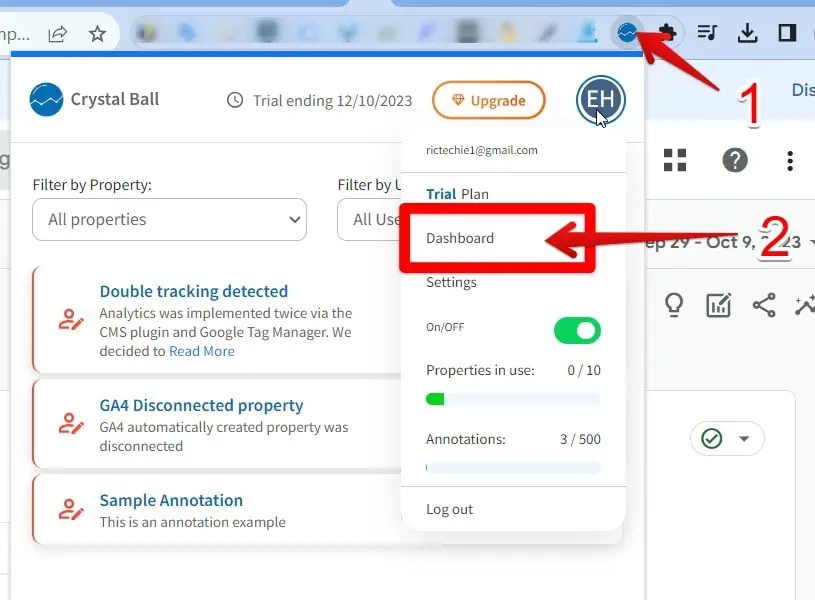
In your dashboard, you’ll see your list of annotations
Click the edit icon to edit them.

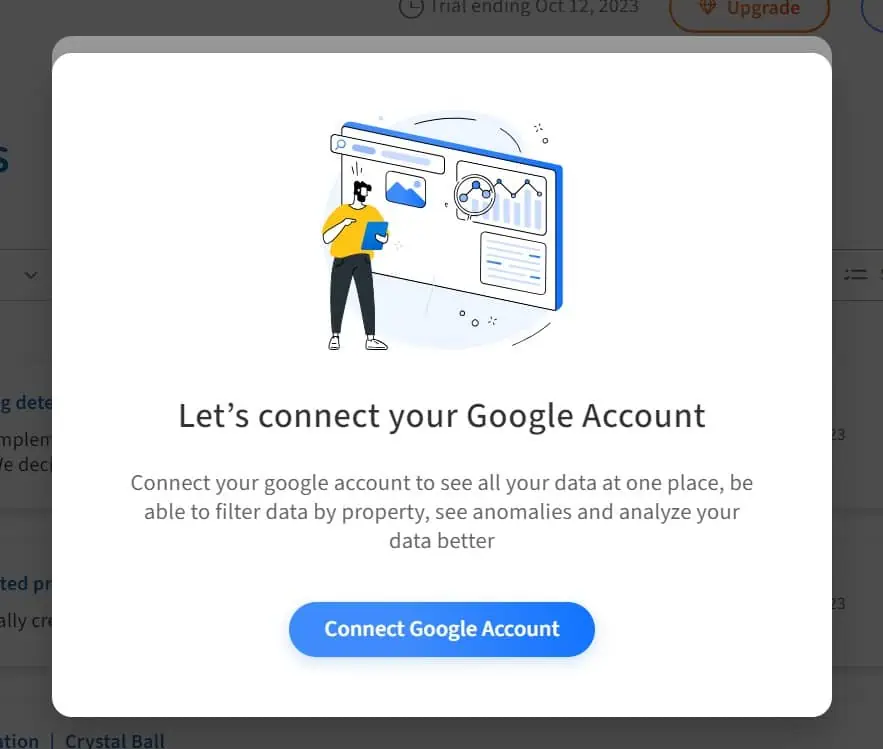
If you can’t select a specific GA4 property within your extension pinned on your browser, you can fix this by repeating the same process. After clicking on the edit icon, a window will pop up.
Click on the Select GA Properties field.

You will then be prompted to connect to your Google Account. Click on the Connect Google Account button.
Then choose your Google account.
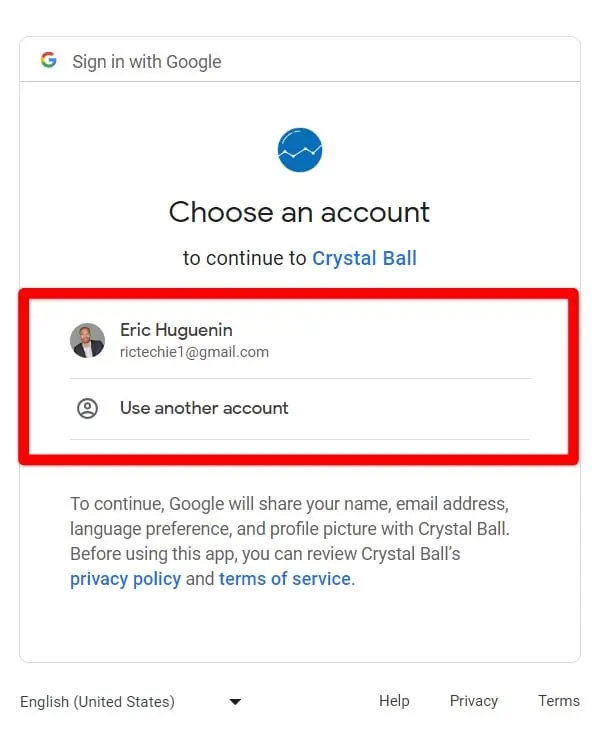
Crystal Ball will ask you for additional permission (that you can change later on). These, however, are optional and I’ll just select the one related to Google Analytics data. After your selection, click on Continue.
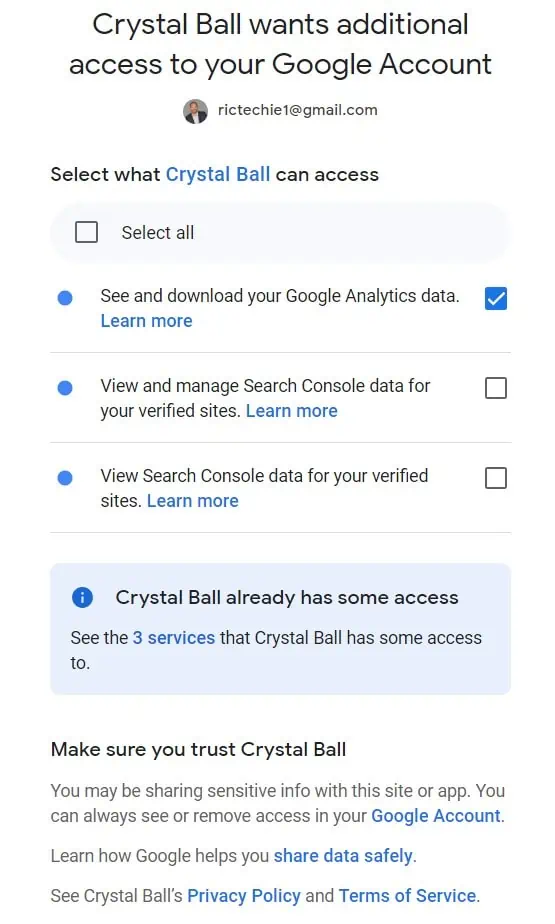
Once this is done, your properties will be available in your dashboard and your browser’s extension from now on.

Annotations with Google Sheets
For me, this is the best choice. Using a spreadsheet lets you make your annotations more informative. In a spreadsheet, you can give more details and clearly explain what happened.
For example, instead of writing words, you can add links to specific resources. You can also put in screenshots to show what changed on a website’s landing page or different versions of a test, and so on. This helps keep good records.
Of course, this means you have to do a bit more manual work, but it’s worth the extra time to add these important details.
Here’s an example of how I use GA4 annotations in Google Sheets, where everything is sorted out by dates, categories, and notes.
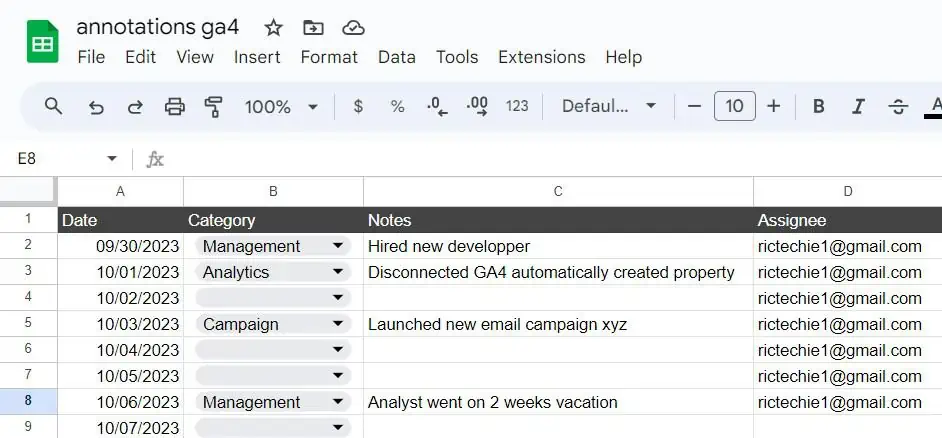
Nothing fancy, just clear, neat, and useful.
Looker Studio Annotations
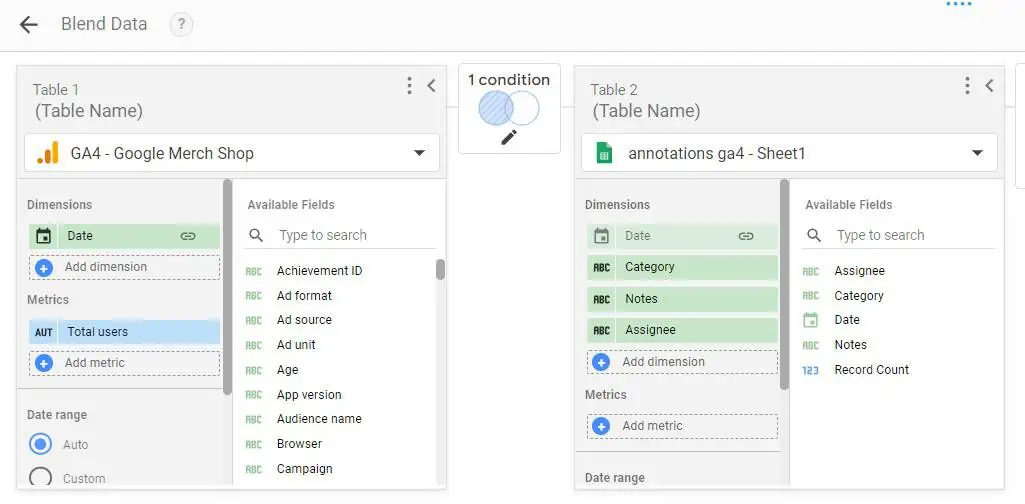
Another way to add GA4 annotations is by using Looker Studio. What we’ll do here is use data blending to combine two data sources: GA4 data and our annotations in Google Sheets.
This isn’t a Looker Studio tutorial, so if you’re interested in learning more about Looker Studio (a free data visualization tool from Google), you can learn Looker Studio basics.
Essentially, after connecting to your GA4 property and adding your Google Sheets data into Looker Studio, blend those two data sources. You can use the same example that we showed you earlier for Google Sheets.
Then, add a time series chart to your canvas using the blended data source.
The blending setup in Looker Studio can look like this:
Back to your canvas, add your Notes column data from Google Sheets as a metric. Since you have added notes to the metrics of the first chart, you’ll need first to change its aggregation type.
Select the time series chart, then click on the edit icon and change the aggregation from Count Distinct to Distinct:
For the same chart, head over to the Style panel, change the 2nd time series from Line to bar, and set its axis to the right axis:

Lastly, add a table chart using the same blended data source. Don’t forget to enable cross-filtering in the time series chart, so you can filter the data.
🚨 Note: Make sure to include a date column in Google Sheets for this to work.
This will be your final result:
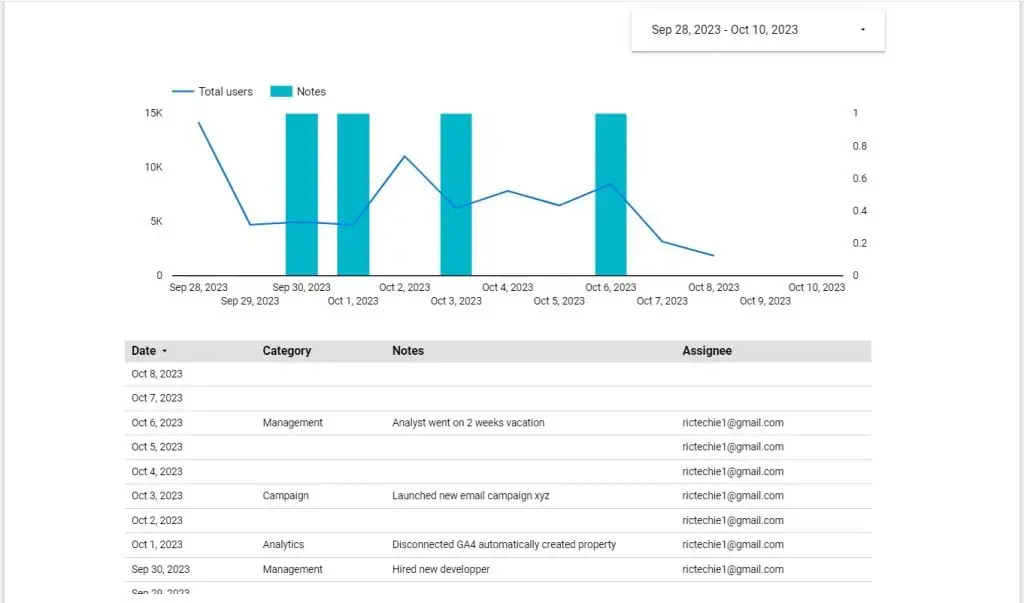
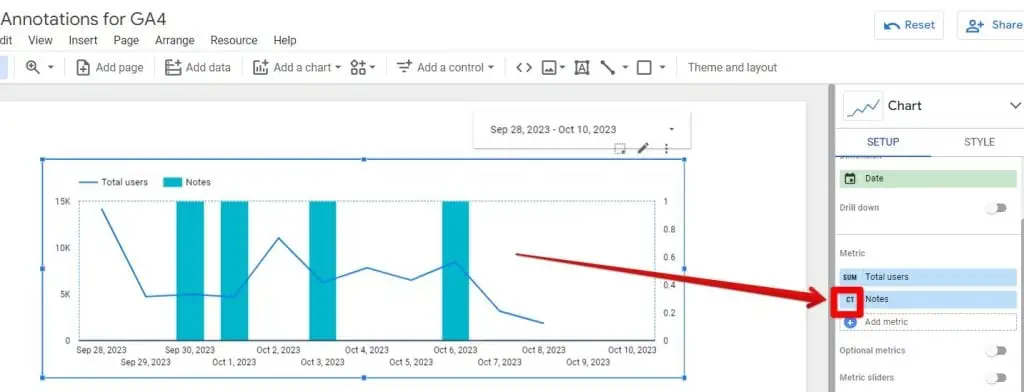
The advantage of Looker Studio is the ability to easily identify when a note was taken, by observing the bars, graph, or the table below the chart.
For instance, you can notice a spike in users on October 6, and simultaneously, there is a corresponding column bar (indicating a note) for the same day.
By selecting the bar, you can efficiently filter the table to read the details of the annotation (notice the table chart being reduced to one row).

🚨 Note: Always check the numbers in your blended charts. If they aren’t accurate, we suggest checking our guide to data blending.
How to Export or Download Google Analytics Annotations
If you’re using the pro version of MonsterInsights, you will have the option to export or download your annotations. However, this could vary with your plugin, so it’s a good idea to check.
When using the Crystal Ball extension, these options seem to be missing.
With Looker Studio, your annotations are already in the Google Sheets data source. This is another reason why we recommend using Google Sheets (or using it alongside your browser extension).
Summary
Adding notes in an analytical platform such as GA4 is a useful solution to keep track of our activities and solve the mysteries behind significant spikes in our data. As we have observed, there are several ways to do this.
Firstly, use a plugin if you have installed GA4 with a plugin to stay organized. Then, you have the option of a browser extension if you want to see your notes appear in GA4. However, consider data privacy before blindly adding third-party tools.
Next, you have the options of Looker Studio and Google Sheets.
A few final tips. Sometimes having annotations can solve part of the puzzle, so it’s essential, especially for your marketing campaigns, to tag your campaign URLs and know how to track website traffic sources.
Also, remember that to make the most of your annotations, it must become a constant practice, not just for major events.
Have you tried to add annotations in GA4? Which method are you going to try out? If you’re aware of any tools or alternative methods to accomplish this, please share your insights.


")