
Last Modified on October 23, 2024
Results that seem meaningful but are distorted by your company’s internal users are akin to dummy data. This internal traffic needs to be filtered out so you can get accurate numbers from your external audience.
It is easy to exclude internal traffic in GA4 by filtering out IP addresses. However, different methods exist depending on your company’s size and its organizational structure, including roles and geographic location.

Master the basics with our FREE GA4 Course for Beginners
Remember, that traffic exclusion based on IP can also be unstable.
The smaller the team, the easier your solution. On the other hand, solutions can become more complex with more internal members or clients. We will examine various methods for excluding internal traffic and address the common issues associated with them.
What we’re going to cover in a nutshell:
- Difference Between Developer Traffic and Internal Traffic
- How Do I Exclude Internal Traffic in GA4?
- How Do I Exclude Developer Traffic in GA4?
- Other Ways to Exclude Internal Traffic in GA4
- FAQ
Let’s get started!
Difference Between Developer Traffic and Internal Traffic
What Is Internal Traffic?
Internal traffic consists of users within your organization, such as you, your employees, contractors, or clients who access the website from their work or personal devices.
You must include your IP address as the value for a parameter called traffic_type. This parameter is then added to your GA4 events. After you activate the filter, Google Analytics 4 checks incoming traffic based on these conditions.
If it finds an event that matches the traffic_type parameter you’ve set for your filter, it will exclude traffic from your device(s). Once you activate the exclusion filter, the data from this traffic will not show up in your reports at all, not even in the GA4 DebugView.
But the question now is, if you can’t see your traffic, how can you test your GA4 events? By using developer traffic.
What Is Developer Traffic?
Developer traffic is traffic coming from developers or anyone who needs to test and troubleshoot issues in the DebugView, without their activities showing up in GA4 reports.
How Do I Exclude Internal Traffic in GA4?
To exclude internal traffic in GA4, you will filter IP addresses, either individually or by ranges for larger organizations.
There are two steps:
- Define Your Internal Traffic
- Activate Your Filter – which will apply the changes to your GA4 reports
Let’s see what this looks like in practice.
Define Your Internal Traffic
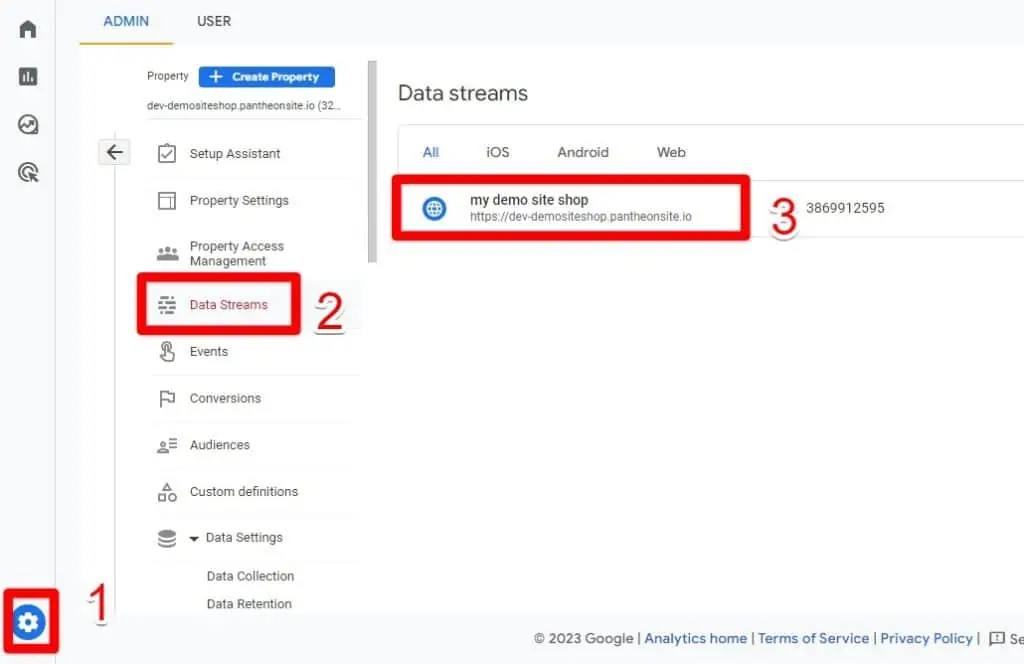
1. First, go to Admin. Click Data Stream and select your data stream.
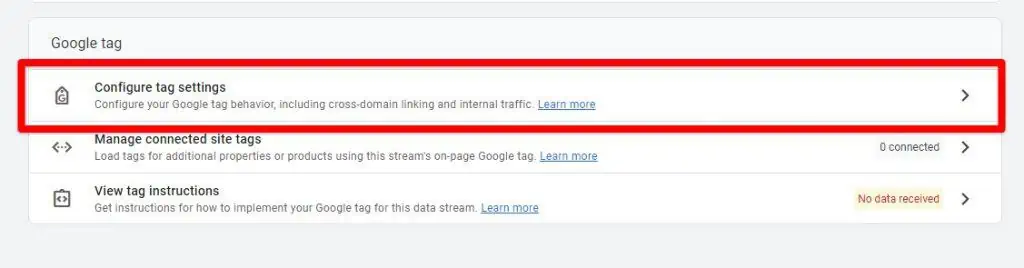
2. Next, click Configure tag settings.
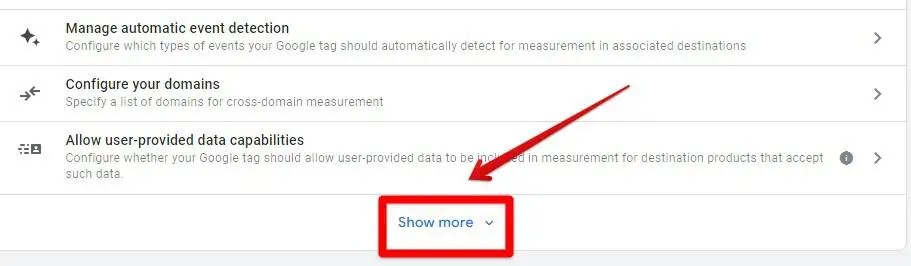
3. Click Show More.
4. More settings options will be available. Select Define Internal Traffic.
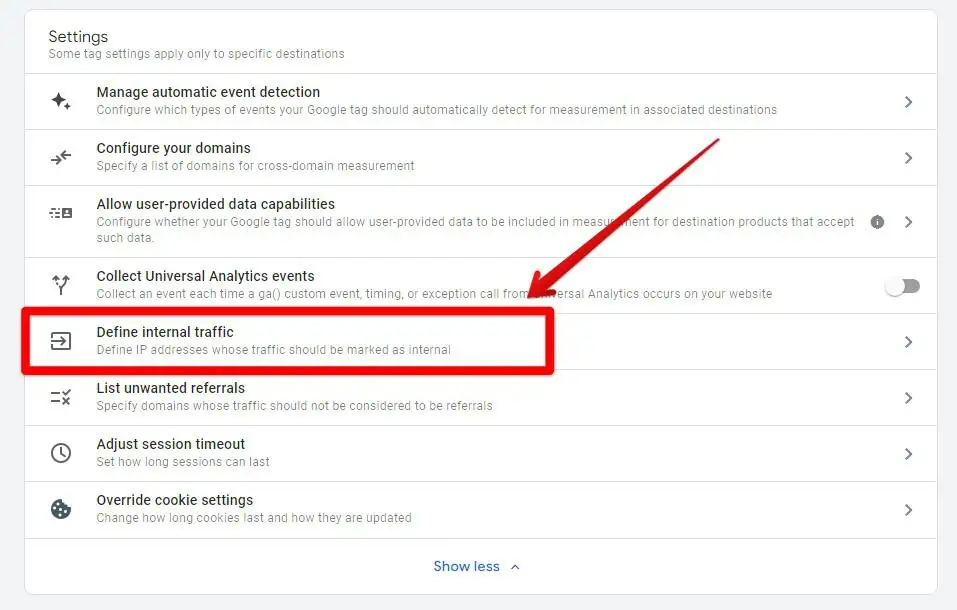
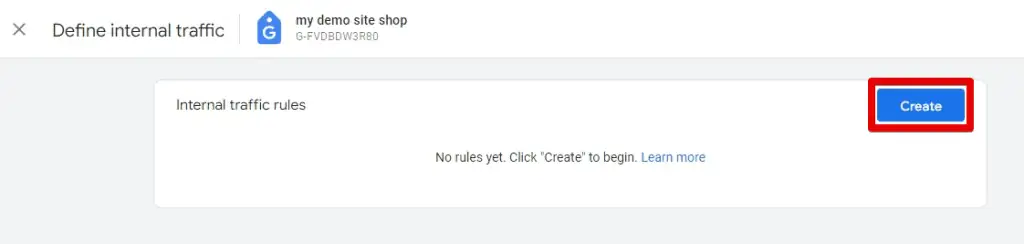
Now, you will be presented with the option to define your internal traffic and create your internal traffic rules.
5. Click on the Create button.
You can use IPV4 or IPV6 addresses. You can also use CIDR for ranges of IP addresses. Feel free to ask someone in your IT department if you need help with this.
The following gives you an idea of a personal setup.
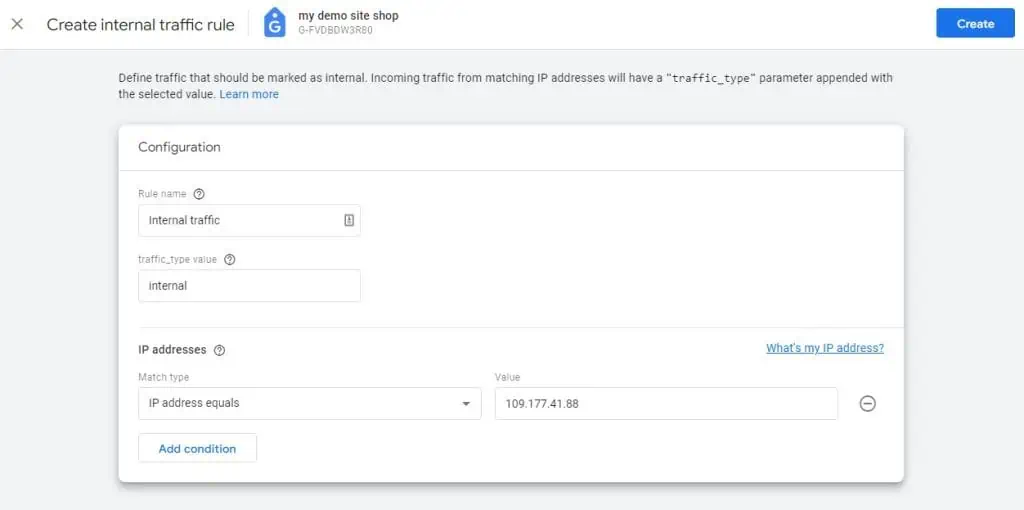
Let’s look at the configuration settings:
Rule name
Defining a rule name helps you understand at a glance what the rule does or who it applies to, which can be particularly useful when managing multiple filters or rules in your analytics setup.
If you need to differentiate between various branches within your company, you can assign names to your rules like “Corporate Headquarters,” “Local Branch,” or “Remote Office.”
traffic_type value
The “traffic_type” is a parameter with the default value set as “internal.” This parameter will be added to your events. However, you have the flexibility to change it to suit your needs. Often, it’s practical to use your geographic location for this parameter.
For example, if one branch is responsible for managing the Middle East and North Africa (MENA), you could use something like “mena_headquarters” or “office_tokyo” to specify the source of the traffic.
In many instances, the default value of “internal” is self-explanatory and serves the purpose well.
Match type
Match type gives you different choices to say how you want to identify your IP addresses. If the condition is true while you’re on your website, your IP address won’t show up in your reports. You can use Regex here. Just remember to turn on your filter after you’ve set it up.
If you don’t know your IP address, you can click on the What’s my IP address? link that will direct you to a Google search showing your IP address (you may see IPV6 and therefore have to choose a website from the result, to find your IPV4 address).
Value
Simply paste your IP address into the ‘Value’ field. Your IP address (or addresses) is the information you should enter here.
🚨 Note: It’s impossible to filter out app users’ internal traffic. Also, once you’ve applied a filter, remember that the changes are permanent. This means that once a filter is activated, the data you’re excluding won’t be available in Google Analytics 4 or BigQuery.
Right now, your filter is not active and is set by default as a test filter. You can verify this by:
- Using the DebugView.
- Using Comparisons in your Realtime Report.
🚨 Note: Often, it may appear that your test filter doesn’t work. Be patient. Usually after around 15 to 20 minutes, your test filter data will show up, or generate a few PageViews again.
Let’s cover each briefly.
Using the DebugView Report
Go to Admin → DebugView. You’ll find DebugView under the Property column.
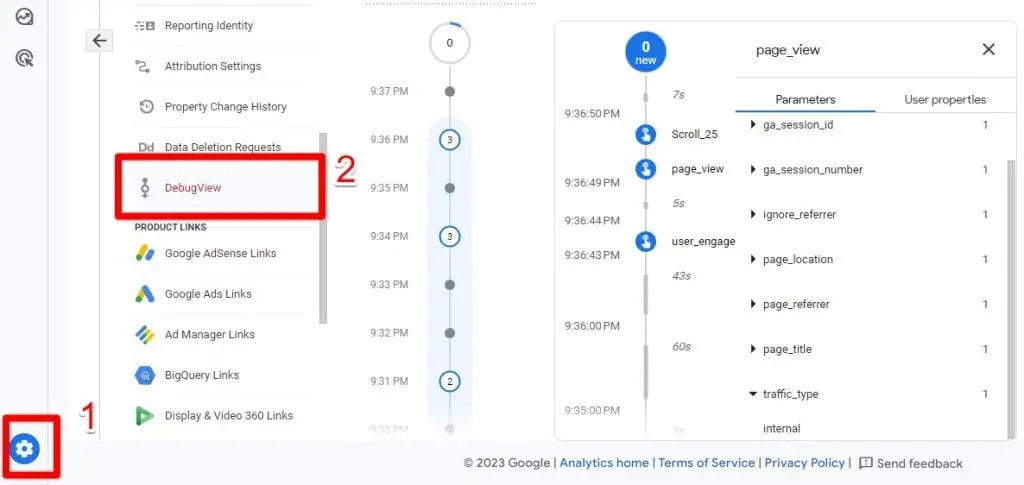
In the DebugView, check for an incoming event like page_view or another event like Scroll. We’ll check the page_view event.
Look for the traffic_type parameter under Parameters. You’ll see the value of Internal.
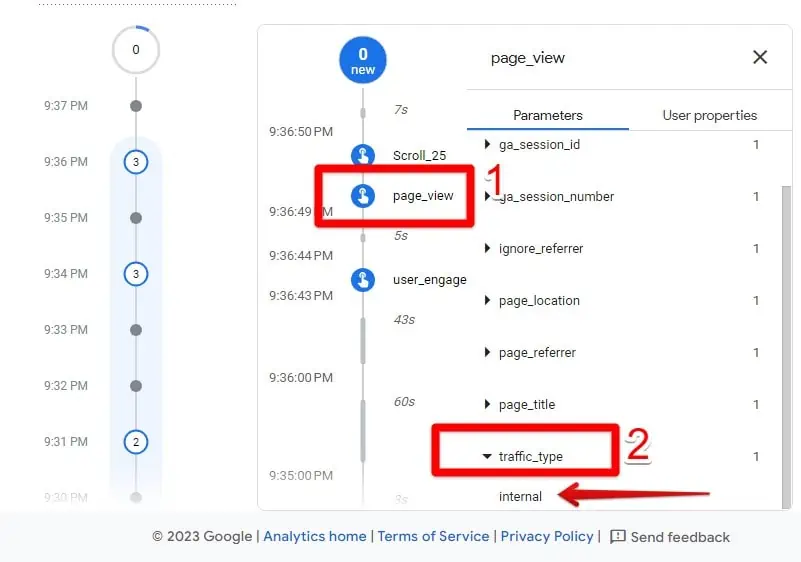
Again, this doesn’t mean your filter is working. It only means that GA4 recognizes your traffic as internal based on your IP. If the filter was working, you wouldn’t see the traffic_type parameter.
Using Comparisons in Your Realtime Report
Go to Reports → Realtime. Then, click Add Comparison.
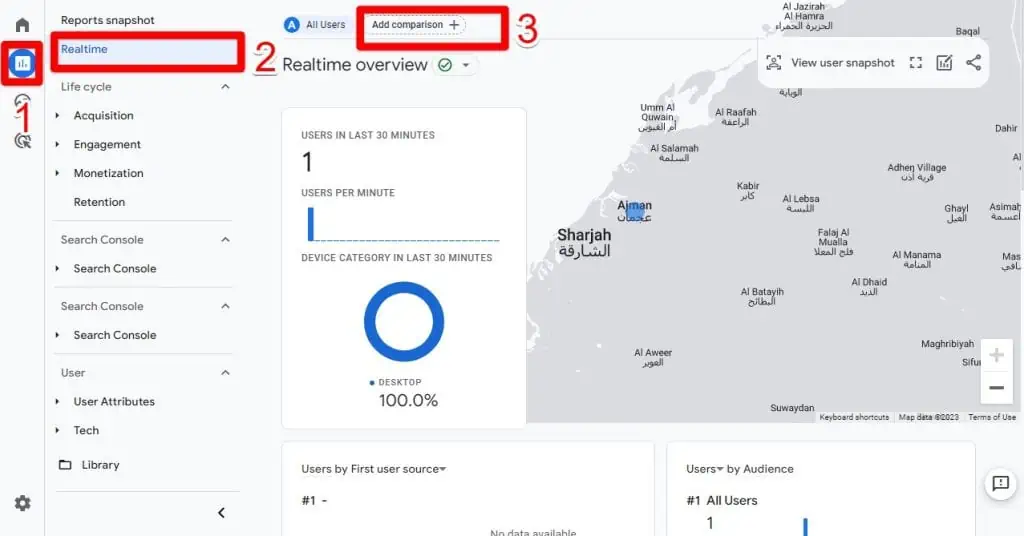
In the Build comparison tool, follow these guidelines:
- Dimension name – Select the Test data filter name. You’ll find it easily under General, or by typing it in the search bar.
- Match type – Use contains the descriptive name of your internal traffic. This is case-sensitive! To make sure it matches exactly, you can go to Admin → Data Filters and check the name.
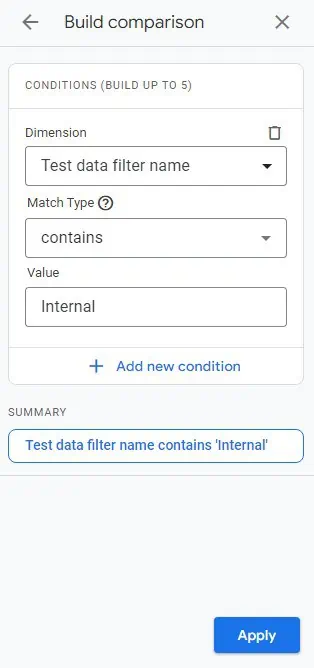
Click Apply. You’ll have the following results:
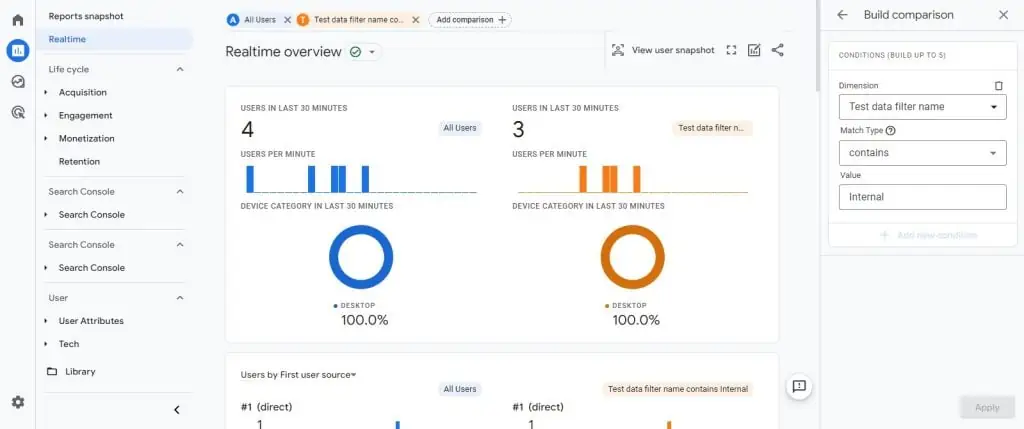
The orange-colored data is the one coming from the test filter.
Activate your Filter
Currently, your filter is still not up and running, because it is set with a testing status by default.
As we showed in the previous step, if you were to access your site now, you would notice your internal traffic in the DebugView, the Realtime report, and other GA4 reports.
You’ll spot it easily because it will display all the values we configured in the first step when we defined the internal traffic.
To activate your filter, go to Admin → Data Filters. Select the Internal Traffic filter.
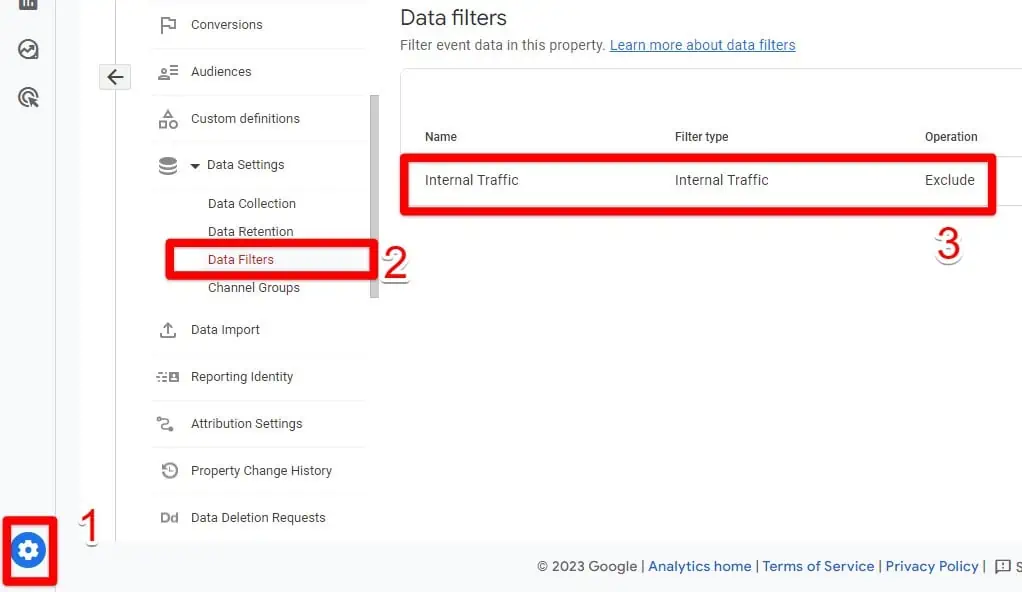
Change its status to Activate.
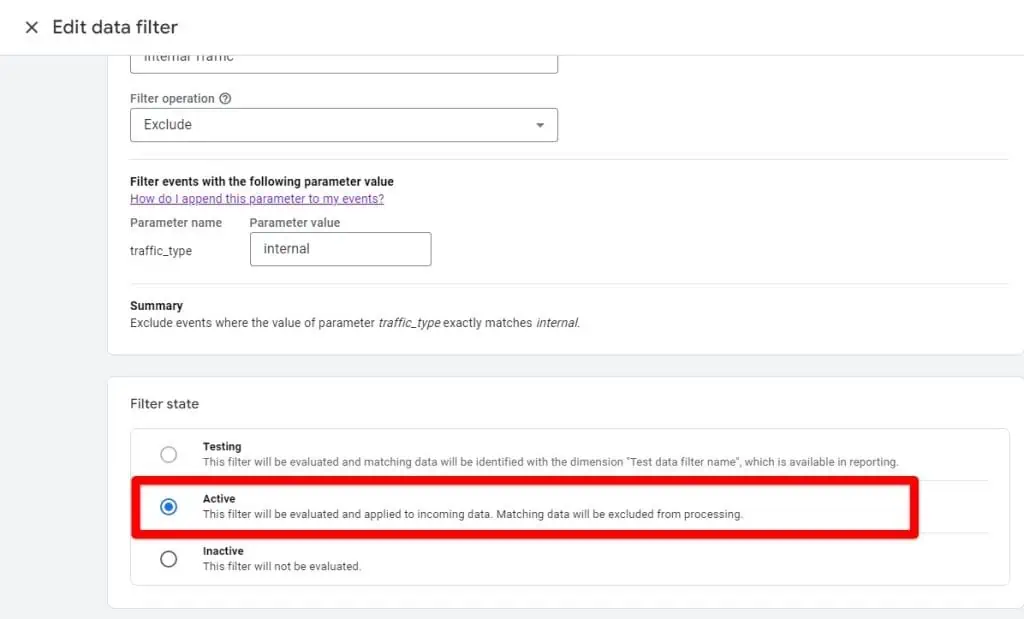
Click Save.
🚨 Note: Changes are irreversible, therefore you can’t change the status back to Testing. The only option you’ll have from now on is to keep it Active or Inactive.
How Do I Exclude Developer Traffic in GA4?
Contrary to the filter we built earlier, developer traffic allows you to be visible in the DebugView. This way, you or your developers can still view your traffic in the DebugView to run tests and troubleshoot issues without inflating your reports.
To achieve this, we will use Google Tag Manager and a Lookup Table Variable, which is one of the Top 10 Google Tag Manager Variables you should know.
What are we going to achieve here?
Using GTM, we can change the value of the traffic_type parameter. This way, if we are using GTM’s Debug Mode, our traffic will be identified as Developer traffic in GA4. Otherwise, GA4 will consider it Internal traffic.
Here are the steps:
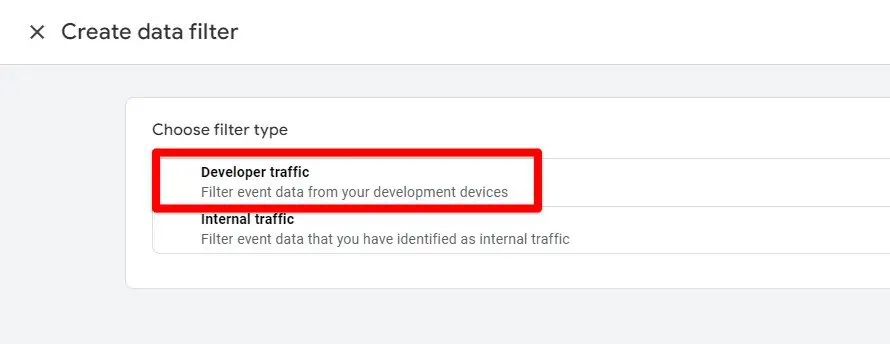
Go to Admin → Data Settings → Data Filters. Click Create filter.

In Choose filter type, select Developer traffic.
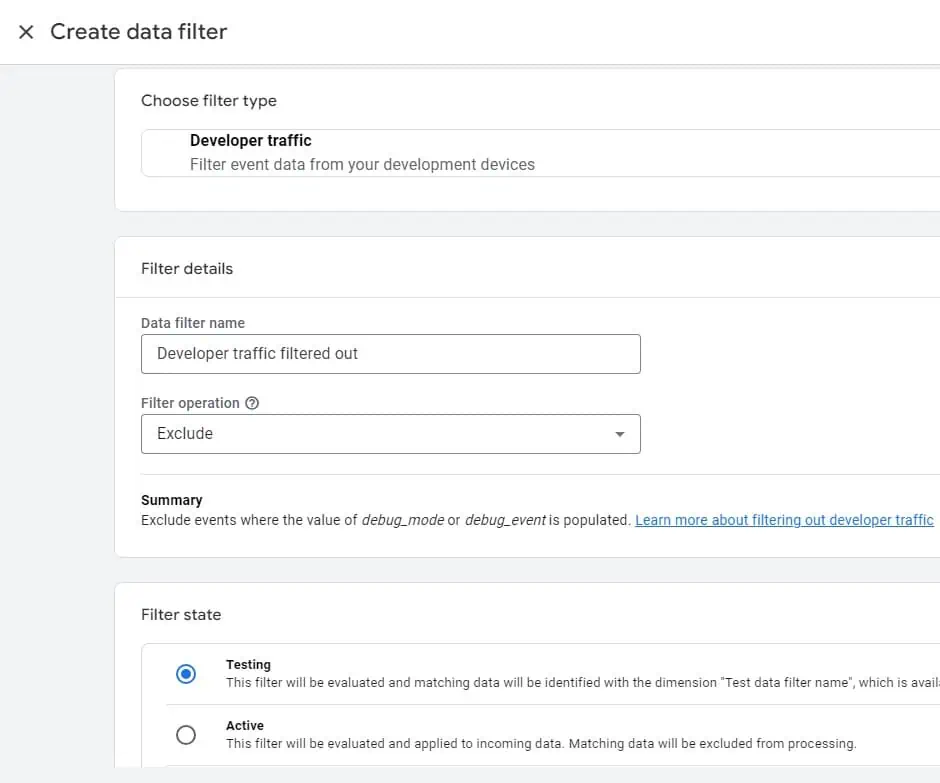
Then, you can fill in your developer filter details.
For the Filter name, write something descriptive. For Filter operation, keep Exclude. For now, keep Testing for the Filter state. Click on the Create button.
In Tag Manager, you can follow this configuration.
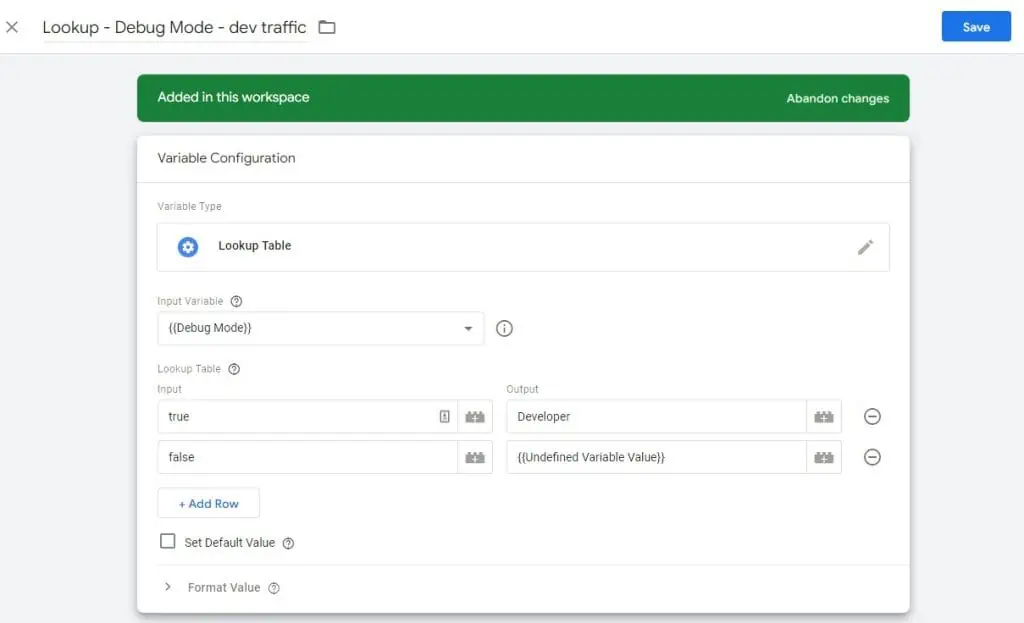
Input Variable
To click the Input Variable field, do New Variable → Variable Configuration → Debug Mode. Name it as you wish. I named it Debug Mode.
Lookup Table Input
Click the + Add Row button and add two rows. For the first row, write true in Input and Developer for the Output. In the second row, write false in Input.
For the Output, follow these steps: Click the variable icon → + to add a new variable → Variable Configuration → Undefined Value. Use a meaningful naming convention. I named it Undefined Variable Value. Click Save.
Now, you’ll have to add these to your Google Tag or your old GA4 configuration tag with the Google Tag type.
Here’s what we have added to our setup:
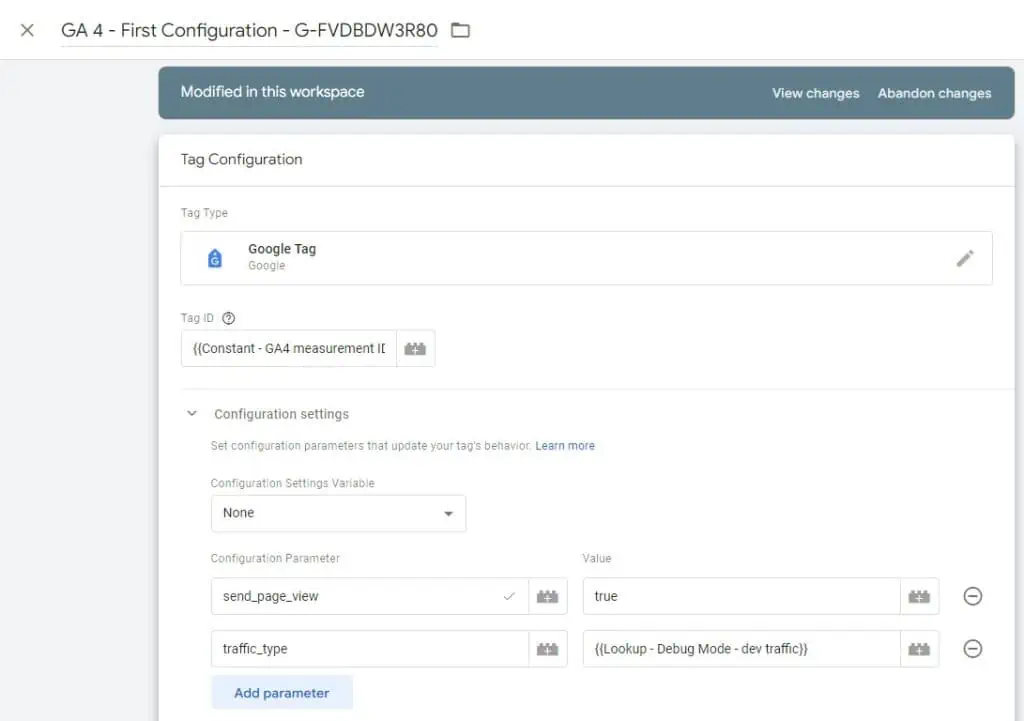
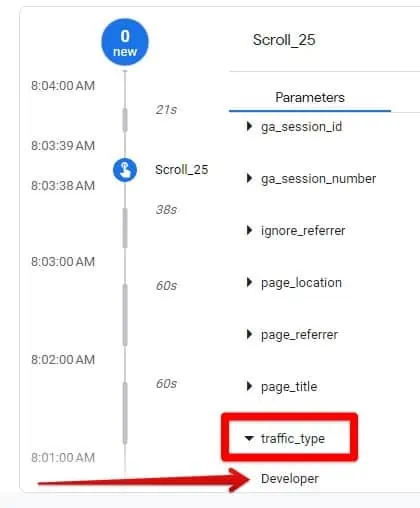
If you use your GTM Preview Mode, the traffic_type parameter in GA4 in the DebugView should have Developer as its value.
Your filters at this point still don’t work and need to be activated.
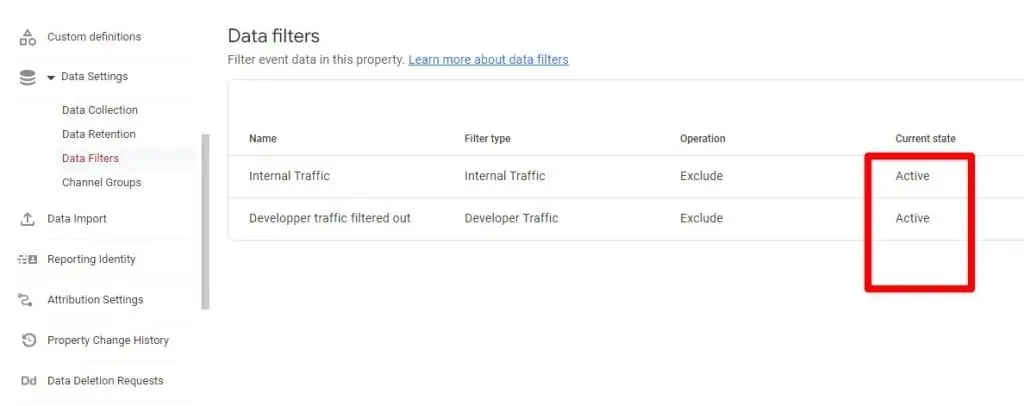
Go back to Admin → Data Settings → Data Filters. Set the Internal Traffic filter and the Developer filter we created previously to Active.
Run a final test without Preview mode in GTM and check if your traffic_type is set as internal. Do the same using Preview mode and check if the traffic_type value is the developer.
Other Ways to Exclude Internal Traffic in GA4
To exclude internal traffic from your Google Analytics data, consider how your organization defines internal traffic or what data could be used to define it. For example, using service providers as a way to identify internal traffic was possible in GA3.
Using this logic, you can exclude internal traffic using data layer pushes.
Other methods that do not include IP addresses include:
Extensions
There are extensions such as the Google Analytics Opt-out Add-on (by Google) which block Google Analytics from collecting any of your data. While this is a convenient option, it can be difficult to adopt company-wide.
Additionally, it can interfere with your tracking implementation, so you will need to constantly turn it on and off.
Demographic Exclusion
This is a more drastic approach but can work if your employees work in specific regions that do not belong to your target market. For example, you could exclude traffic from countries where you do not have a presence.
Onsite Self-identification
A great article online by Bojan Basrak details how to exclude internal traffic without using IP addresses. This method is a good option for companies with a remote workforce.
There is even an email template you can use to send to all employees to help in adopting this method.
Research other articles online
Some people have come up with very creative ways to exclude internal traffic, and a simple Google search could be the solution to your problem.
FAQ
GA4 Internal Traffic Filter Not Working
Here are some reasons why your GA4 internal traffic filter isn’t working, and some tips to help resolve the issue.
Patience
I know it can be annoying, but GA4 takes time to process this data. After generating a few pageviews, you might start seeing your internal traffic in reports within 1 to 3 minutes.
But it can also take up to 15 to 20 minutes and you may have to repeat this process a couple of times.
Switch to IPv6
Changing from IPv4 to IPv6 can sometimes be beneficial. Apply the previous steps after altering the definition of your internal traffic.
IP addresses can be unstable. For example, when checking what’s your IP address, you may find that your IPV6 is detectable and not your IPV4. IPV4 sometimes shows up and sometimes it doesn’t.
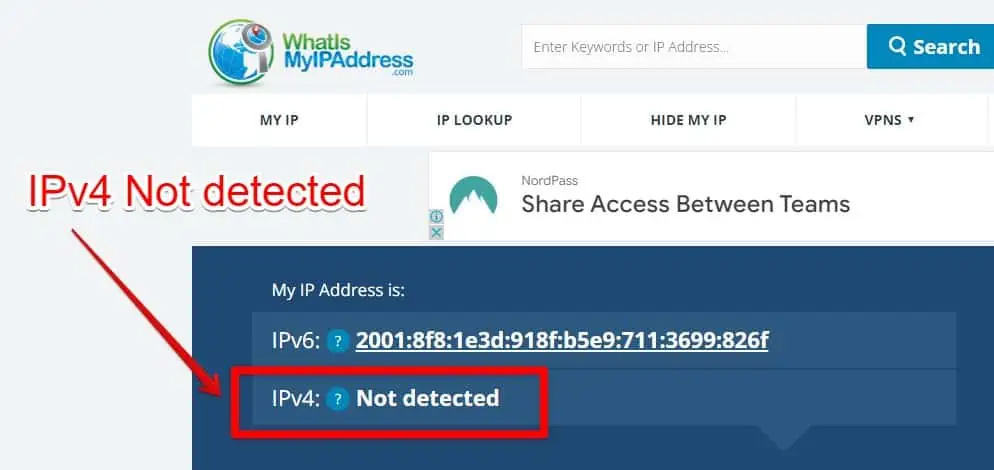
Go back to change your IPv4 to IPv6 and refresh your Google Analytics page.
Filter Not Activated
Make sure to double-check that your filter is activated in GA4. By default, GA4 initially treats internal traffic as a test filter. To activate it, follow these steps: Go to the Admin section, navigate to Data settings, and then select Data filters.
Refresh DebugView
DebugView can be a bit buggy at times. Try the following:
- Refresh your GA4 page where DebugView is active to resolve the issue.
- Ensure that you disable browser extensions that might interfere with DebugView.
- Ensure that the Google Analytics Debugger extension is turned on, as it helps DebugView function properly.
Proxies
Be cautious with proxy services or VPNs. Google Tag Manager’s server container allows you to proxy a Google Tag Manager web container, and this can lead to issues.
In such cases, you may need to create an IP exclusion filter within the GTM server-side container to prevent outgoing requests from internal traffic.
Click on the Create and Save Buttons
This is obvious, but we can always forget and click away too quickly. Make sure to save the filters you create.
Does GA4 Anonymize IP Addresses?
IP anonymization also known as masking is not needed because GA4 doesn’t store or log IP addresses.
Does GA4 Collect IP Addresses?
No. But to be clear, by collecting we mean that the data is not stored permanently. You could argue that the data is still collected temporarily, but this happens in a temporary memory.
During that process, GA4 can make conclusions for geo-location data that are not precise, so they won’t have your exact location. After the derivation, the IP addresses are discarded. In short, IP addresses are not stored or logged.
How to Exclude Countries in GA4
A solution to exclude internal traffic is to exclude regions where your company has no presence. This is a drastic solution, so be mindful before making this decision.
You can exclude traffic from specific countries in GA4 using these 3 methods:
- Data Filters
- Filters
- Comparisons
Data Filters
This is essentially what we covered in this post. Except this time, use the IP addresses of the countries you want to exclude.
Filters
Filters in GA4 allow you to view your data in a specific way. It can hide the data you don’t want to see. They don’t permanently modify your data and are temporary. You won’t find them in the Overview reports.
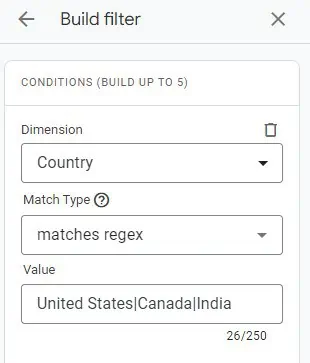
Here’s an example that uses Regex. Check our GA4 RegEx Tutorial for Beginners if needed.
First, go to any of your standard reports (except for overview reports). Under the report title click Click Add filter +.
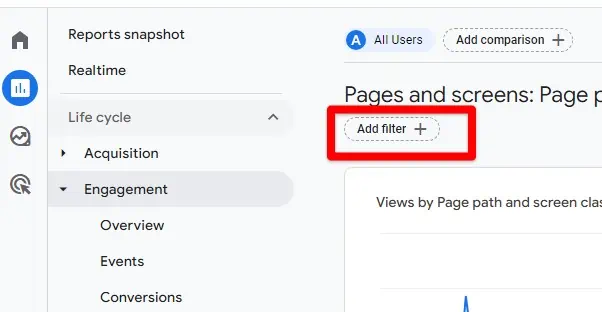
You can use the following for inspiration. I’m using the matches regex for the Match type. The regex is the United States|Canada|India.
Click Apply.
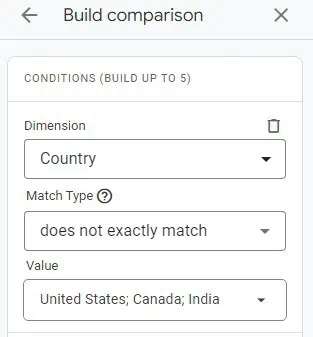
Comparisons
They are somewhat similar to filters except that you can use them to compare data and you can use them in Overview reports. Unlike Filters, they don’t hide data but separate it. You’ll have to change the Match Type to does not exactly match.
Summary
We’ve looked at how to exclude internal traffic. We’ve also covered how to view your internal traffic for testing purposes in DebugView without polluting your GA4 reports.
Excluding internal traffic in GA4 is straightforward, but it can also present some issues that may require different solutions.
For example, there are often problems with excluding IP addresses because they can be unstable or time-consuming to test. DebugView can also have delays and bugs.
On this topic, I strongly encourage you to read our concise article on the Overview of GA4 DebugView, which not only addresses the issues mentioned but also provides insights into various other challenges and the appropriate methods for dealing with them.
We’ve also presented a unique expert solution for filtering out internal traffic without using IP addresses. Just remember that whichever approach you choose, data leakage may not be completely avoidable.
Have you set up internal traffic exclusion in GA4 or found a better way to exclude internal traffic? Please share your findings with us!
Master the basics with our FREE GA4 Course for Beginners


")
Hei could you please tell me how did you do so Tag Manager allowed you to use {{Lookup – Debug Mode – dev traffic}}? Because if I try to do it I get this error: Unknown variable “Lookup – Debug Mode – dev traffic” found in a tag. Edit the tag and remove the reference to the unknown variable. | Unknown variable name.
Hi Petricia,
Typos are often the reason for this message. For example, if you typed the curly brackets {{ }} and then your variable name, a simple white space can prevent you from using the preview mode. In your case, the issue is in the Tag (if you followed the post, it should be your GA4 config tag). Try going into the tag and see if it is written correctly.
Hi Eric.
Thanks for your article.
Despite all those higly valuable information and numerous tries… I’m currently stuck on a related issue ;
In the Exploration reports, I’m simply try to create a segment that would use the Test data filter name dimension ;
But for a reason I don’t understand, it’s not available there ; It’s available in the Reports for Comparison segments, but not in Explore.
Have you tried that ?
Did you experience the same thing ?
Thanks for considering my question
best rgds
Hi Laurent,
I did not experience the same thing you did.
In Explorations, the dimension Test data filter name is available as you can see here:
When you click the + sign to add a dimension and then type “Test data filter name.” But I’m sure you already know this.
However, there can be compatibility issues and naming issues.
The Test filter name dimension is not compatible with many ad costs, cohorts, and organic search metrics.
Secondly, it’s easier to see the Test data filter name data in explorations if you use it as a filter. For example, Test data filter name > contains > Internal traffic (or however you named it).
Remember that the filter is case-sensitive. For example, writing “internal Traffic” (lowercase “i”) will be invalid. And if you have a completely different name, then make sure to use that.
Hello,
Thank you for the thorough article. Something I’m struggling with, is that I simply cannot see “traffic_type” as on of the parameters of for e.g. a page_view.
traffic_type is just not there. Not even a blank value, the parameter as a whole does not appear in the list e.g.
Any idea’s on how to solve? Thanks already.
Best regards,
Stefan
Hi Stefan,
If everything was set up correclty, then it is likely that your IP address changed. Find online what is your current IP address. Then verify that it matches the IP you had in GA4, which is in Data streams -> Configure tag settings -> Define internal traffic
Otherwise, you can always check the newtwork tab in the chrome developper tools. It’s a nice tip to see your internal traffic in the payload data. I added a screenshot to this reply.
In the screenshot, step 2 should have been step 1. And vice versa.
Hi Eric,
Thank you very much. As I discovered, the IP-adress did not change.
I seems that the filters of GA4 in my case took up to 5 days untill traffic finally got filtered, without changing anything in between.
Very strange. But for sure learned about the internal traffic! Thank you very much.
Hi Eric,
I’ve previously put a message saying thanks. For some reason, it’s not here. So thanks again. Really appreciate it that you took the effort for further explanation.
Hi Stefan.
Thank you very much for your comment, it’s greatly appreciated. Also, I think your experience could really benefit others. I certainly learned from it too. I’ll see if we can add it to the post if that’s alright with you. Take care.
I have followed all these steps, but the next day IP addresses automatically change, so all internal traffic events track in my Ga4 reports. Can you please explain how to dynamic IP address in my internal traffic in GA4?