
Last Modified on June 27, 2024
Measuring marketing activities, such as tracking a button click, is often considered a task to implement.
When we spend too much time fixing tracking solutions, we risk becoming so busy that we lose sight of or fail to train our minds to see the bigger picture.

Subscribe & Get our FREE GA4 Course for Beginners
Marketing measurement is the system that allows you to structure all your different promotions and tools to understand performance and drive growth.
We will use the tools from the Google Marketing platform, but these concepts apply to any resources in your toolbox.
🚨Note: We won’t be just covering concepts. You’ll find our templates to help you become a highly professional and effective marketing measurer.
Here are the topics we’ll cover:
- Types of Marketing Measurement
- Marketing Measurement Framework
- Measurement Plan
- Analysis
- Reporting
- Data Visualization
Let’s dive in!
Types of Marketing Measurement
Digital Marketing Measurement
Here, we’ll specifically cover digital marketing measurement. Our focus is on strategies related to tools that enable tracking, tagging, and reporting of marketing activities (such as advertisements) and user behavior on websites or apps.
Marketing Measurement Framework
What is a Measurement Framework?
A marketing measurement framework is a structured approach that combines strategies and tools to measure key marketing activities.
Measurement frameworks vary in design and approach, but the key aspect is their adaptability. You’re responsible for identifying the tools that fit your needs to implement this framework effectively.
Marketing Measurement Framework Example
Here is an example of a marketing framework we use at MeasureSchool. Feel free to adapt it to your specific scenario. Just substitute our tools with those you prefer.
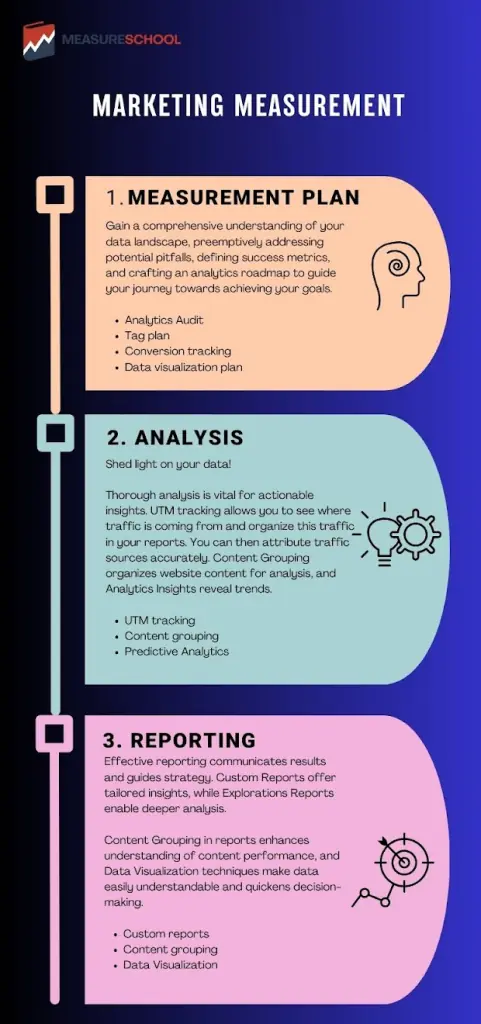
Measurement Plan
- Analytics Audit (Google Analytics & GTM)
- Tag Plan (Audit + Template)
- Conversion Tracking
- Data visualization plan
Analysis
- UTM Tracking
- Content Grouping
- Analytics Insights
Reporting
- Custom Reports
- Explorations Reports
- Custom Channel Groupings
- Data Visualization
Measurement Plan
Analytics Audit (Google Analytics & GTM)
Numerous factors complicate analytics setups, such as installing Google Analytics 4 with plugins, manual code injections, custom website issues, code conflicts, cross-domain tracking challenges, unresponsive HTTP requests, and missing events.
Admittedly, we can also forget things. That is why it is crucial to have a systematic checklist for auditing GA4 accounts to ensure we don’t overlook essential details.
🚨Note: This is the frequent process we at MeasureSchool go through: GA4 Audit – 16 Questions to Ensure Correct Account Setup
Tag Plan (Audit + Template)
After asking yourself the right questions, proceed to develop a tagging plan.
Begin with an analytical audit to understand the operational context, including the tools and their application.
Consider this scenario:
You’re granted access to a client’s Google Analytics 4 and Google Tag Manager accounts. You promptly start tagging in GTM, only to find out you’re not sending data to the correct GA4 property.
Alternatively, adjustments in GA4 show you’re dealing with an automatically-created GA4 property, which may require disconnecting from Universal Analytics and migrating conversions to GA4 correctly.
Conduct a thorough site audit, as well, to align with your client’s objectives. It may be that the website’s design may not match their goals.
For instance, if tracking qualified lead form submissions is a goal, but the form is inaccessible or hard to track, you could offer preemptive, actionable advice.
With a clear understanding of tracking necessities, you can craft a comprehensive tagging plan. Here is an example:
| Goal | GTM Tag type | GTM Trigger | GA4 Event name | param. name | param. value |
| Form submission | GA4 Event | Element visibility | generate_lead | ||
| value | {{Datalayer variable}} | ||||
| form_id | {{Click ID}} |
Conversion Tracking
A common mistake is to try tracking everything, including non-essential interactions for your business; keep it simple whenever possible.
Understand the core business activities and focus on those. If social media isn’t a key channel for you, then maybe you don’t need to bother tracking clicks on social buttons on your site for now.
Start with planning:
- How does marketing measure success?
Identify industry benchmarks if you’re unsure how to answer this question. You can use competitor analysis tools found online. Regarding benchmarks, aim realistically; comparing yourself to industry giants like NIKE without considering your scale can mislead your strategy. Instead, compare with three competitors at your level to get a realistic benchmark. This approach helps tailor your actions based on achievable results.
- What should be your next steps?
Knowing that 100 people clicked your call to action button last week is great. But is that number a sign of underperformance, normalcy, or excellence? And what action should you take for each scenario?
Often, businesses overlook the need for a basic measurement plan, thinking it is unnecessary for simple setups. Commonly, you can get away without a basic measurement plan, but small tasks can uncover broader issues.
For instance, you can discover that GA4 is missing, you have improperly configured GTM or your site blocks plugin installations. You need to invest more time to resolve these issues.
Data Visualization Plan
Why talk about data visualization when we might not even have started receiving data to visualize?
This step is too important to skip because planning your dashboards (both design and the data you want to include) helps you to:
- Save Time
You will be ready and know what to include when you create the dashboard.
- Create the Ideal Dashboard
Planning your dashboard’s layout prompts you to consult with decision-makers (or other stakeholders) and help understand the types of data they want to see.
- Decide on the Right Tool
Since we are using Google Marketing Platform tools, we prefer Looker Studio for easy integration. However, your client may use a different tool like PowerBI or Tableau.
💡 Top Tip: If you’re unfamiliar with these tools, planning your data visualization will still allow you to make excellent recommendations.
- Define Marketing Metrics Correctly
Some marketing measurement metrics and dimensions in your standard analytics reports might not be available on your data visualization platform.
You may need to download data into a spreadsheet. It will serve as the data source instead of relying on direct integration.
- Be Flexible
Adjust as you go. Changes are bound to happen, and having a flexible structure in place makes it easier to adapt. Often, the reverse happens, but that can also be time-consuming.
Taking notes during discussions with users or sketching a wireframe should be sufficient.
Analysis
Creating a definitive guide for perfect analysis is challenging. However, what’s essential for web analysis is to accurately identify your data sources and tailor reports to meet your specific needs.
Here are the ways to achieve this:
UTM Tracking
UTM parameters allow you to enrich your URLs with specific details that reveal the origins of your traffic.
They include the traffic source (e.g., YouTube, Facebook, Google), medium (CPC, email, podcast), campaign name, and ad set, offering a clear view of your marketing performance.
UTM tracking is indispensable for digital marketing. With it, you can look at your channels and evaluate which performs best based on your criteria, whether for engagement, a particular conversion, or revenue.
Consider exploring this topic further by reading about UTM Parameters in Google Analytics 4.
Content Grouping
Content grouping is a way to place content in different groups. In GA4, these would be pages that show up in the Pages and Screens report.
For example, the Measureschool blog covers subjects related to Google Analytics 4, GA4, and Google Analytics. These are all related to the same topic, so you could create a content group called GA4.
We did it here :
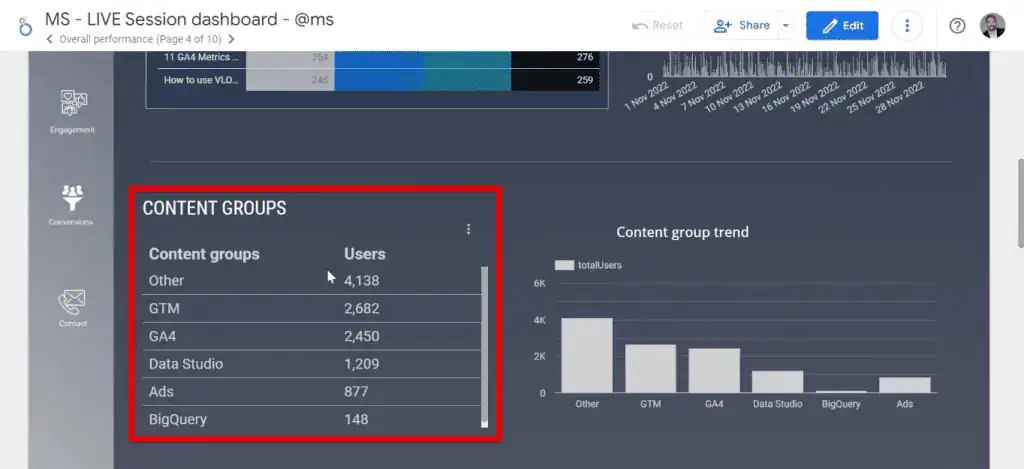
With this information, you can:
- Quickly identify topics that interest your users.
- Determine which topics to continue exploring in your writing.
- Uncover unexpected topics, noting which are successful and which are not.
In this case, the content group labeled Other has 4,138 users, suggesting there might be additional topics we haven’t considered that interest our audience. Therefore, we should investigate this area further.
You can create content groups with GTM, as well. We used Looker Studio, and our post on overcoming GA4 limitations details exactly how you can do it.
Analytics Insights
Take advantage of any methods or technology your platform uses. That is the case with GA4’s Analytics insights, which uses machine learning to detect changes in your data. Analytics Insight includes Automated Insights and Custom Insights.
Analytics Insights will provide quick and often practical information requiring immediate attention.
Automated Insights
Google can tell you when abnormal changes occur, such as sudden spikes in traffic. These automated insights also detect emerging trends.
🚨Note: Check out the GA4 trend change detection feature to find out more about the trends in your data.
Custom Insights
In addition to the default insights provided, you can have ones triggered based on your criteria and the data that matters to you and be notified by email when this happens.
Reporting
It is the last piece of the measurement marketing framework. Now that you have a plan and are organizing your incoming data, you can streamline repetitive tasks into reports and dashboards that you or your clients should monitor.
Reporting allows you to find the data you are looking for effortlessly.
Custom Reports
If you repeatedly apply filters or change the primary dimensions of your standard reports during your analyses, it is better to create custom reports instead. Sometimes, specific data isn’t accessible in the same way.
For instance, GA4 custom events might not always show in the admin section. So, you can easily create reports with Explorations where you list them.
That also makes it easier for others who want access to these reports directly without navigating the platform.
Explorations Reports
GA4 uses Explorations as a collection of advanced techniques to analyze your data. For example, you can customize your table reports, create funnels, and leverage raw data.
We recommend you look at our Top 10 GA4 Explorations for a quick overview of the best exploration types.
Custom Channel Groupings
A channel represents a traffic source to your website, such as search engines, social media, or direct visits. For example, when a user arrives at your site or app via a link in an email, it is classified as an email channel.
On the other hand, a channel group is a collection of these channels grouped based on specific rules. For instance, you can create a channel group for all social media sources or another for paid advertising.
Understanding channel groups is crucial for analysis because it allows you to categorize and organize your website’s traffic sources.
These channel groups can be customized based on your rules, providing additional flexibility in your analysis. We have a post showing step-by-step how to create GA4 custom channel groupings.
Data Visualization
To take your dashboards to the next level, incorporate features to help users easily spot problems or areas for improvement and provide clear guidance on what actions to take next.
In Looker Studio, there’s a feature called conditional formatting. It lets you modify background colors and fonts in your charts based on your data.
For example, you could make text turn red when revenue drops below the weekly average. The aim is to help decision-makers quickly make informed choices based on data.
Summary
We have explored the various ways of measuring marketing. We have also provided a marketing strategy example that anyone can adapt to their needs.
A digital marketing measurement framework will allow you to be proactive, keep your work organized, and avoid costly errors and time wastage for you and your clients.
Additionally, it will consistently demonstrate high levels of professionalism, setting you apart from other service providers that your clients will surely appreciate. With your system set up, you still need to monitor your analytics machine.
Although the framework can adapt to any tool, we often mention GA4 as the one we use.
If you are new to GA4 and want to learn more, check out our Google Analytics 4 tutorial, specifically designed to make you proficient rather than inundating you with information!
Let us know in the comments how you have approached marketing measurement.

Subscribe & Get our FREE GTM for Beginners Course...


")