
Last Modified on January 7, 2025
When diving into website analysis, we face two intriguing questions: Who are our users, and how did they find us? Google Analytics 4 helps answer these questions through two reports: User Acquisition and Traffic Acquisition.
What is the difference between GA4 User Acquisition vs Traffic Acquisition reports? What implications do they have on your data? Which should you use?

Master the basics with our FREE GA4 Course for Beginners
These reports examine your users from different perspectives. The User Acquisition report provides data for users who discovered your app or website for the first time, whereas the Traffic Acquisition report considers everyone.
On the surface, this may seem simple to understand. However, to grasp the key differences between the two, you’ll need to dive into attribution modeling and how GA4 organizes users and sessions.
Here is an overview of what we will cover:
- What is the User Acquisition Report in GA4?
- What is the Traffic Acquisition Report in GA4?
- What is a User in GA4?
- GA4 Scopes Explained
- User-Scoped Dimensions
- Session-Scoped Dimensions
🚨 Note: The concept of users applies to both reports. To make sense of these reports, you should grasp how GA4 defines users starting with the What is a User in GA4? and User-Scoped Dimensions sections on this page.
What is the User Acquisition Report in GA4?
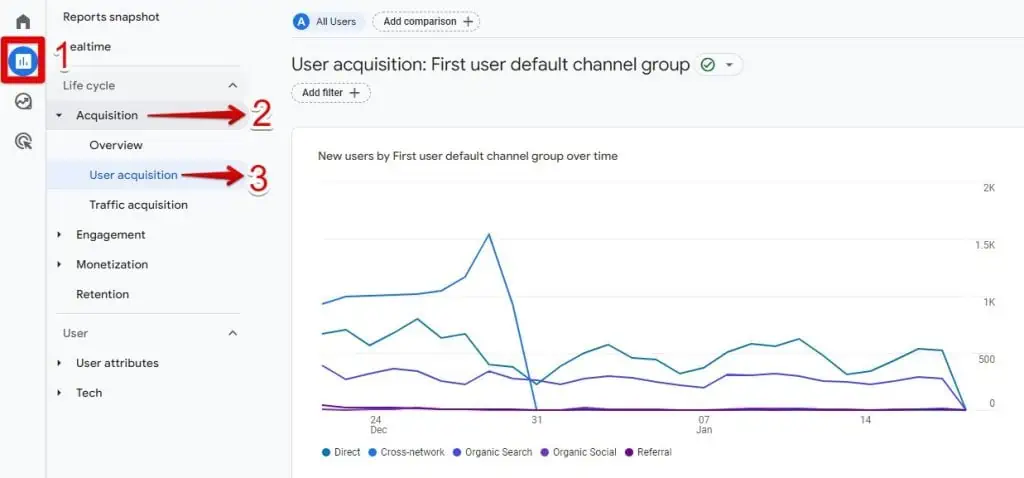
The User Acquisition Report is a GA4 report that helps you understand how new users discover your website or app for the first time.
Comparing GA4 User Acquisition vs Traffic Acquisition reports, the latter explains how users starting new sessions got there. If this sounds confusing – don’t worry, we’ll break it down.
To view the report, click Reports Reports → Acquisition → User acquisition.
What is the Traffic Acquisition Report in GA4?
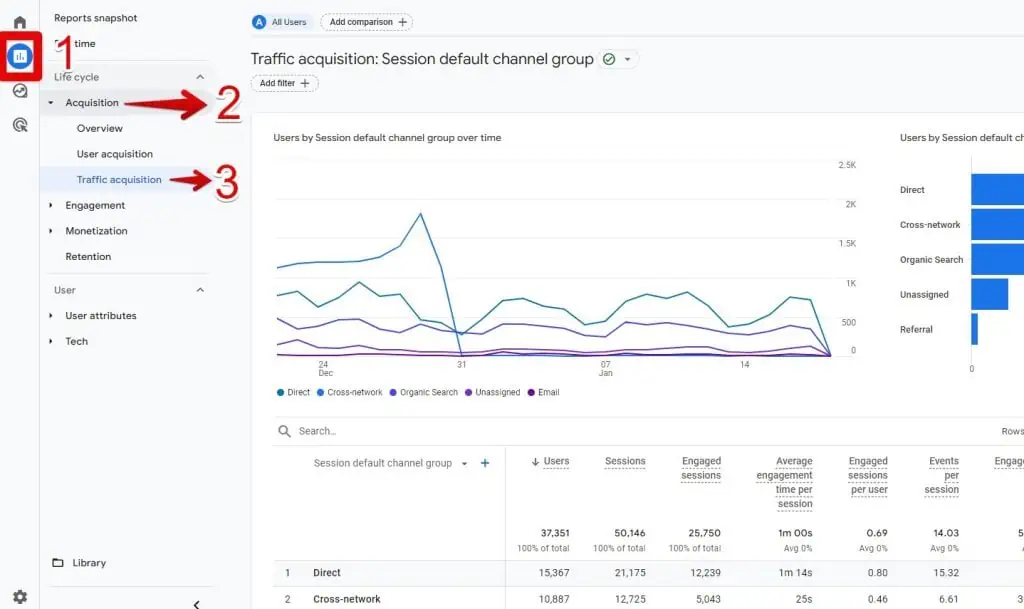
The Traffic Acquisition Report provides insights into the sources of your website and app visitors. In contrast to the User Acquisition Reports, the Traffic Acquisition Report reveals sources for both new and returning users, not just new ones.
For those familiar with the previous version, Universal Analytics, the Traffic Acquisition Reporting in GA4 closely resembles the source/medium report in Universal Analytics.
To access the report, navigate to Reports → Acquisition → Traffic acquisition.
As a marketer, you play a pivotal role in shaping this report to understand the data sources.
You can manually tag your URLs or leverage auto-tagging features in Google Ads, Display & Video 360, Search Ads 360, and publisher or inventory sources (e.g., Google Search, YouTube).
You can use the auto-tagging features from these platforms. But their integration with GA4 requires setup on your end. You can find the list of GA4 traffic-source dimensions on the Google documentation here.
Examples of How to Use the Traffic Acquisition Report
Traffic Sources for a Specific Page or App
You can identify traffic sources for a specific page or screen.
For instance, if you have a sales page across different platforms like Facebook, YouTube, and TikTok, the Traffic Acquisition Report helps pinpoint the most performant sources.
In the table, click the plus + sign.
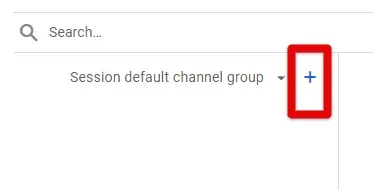
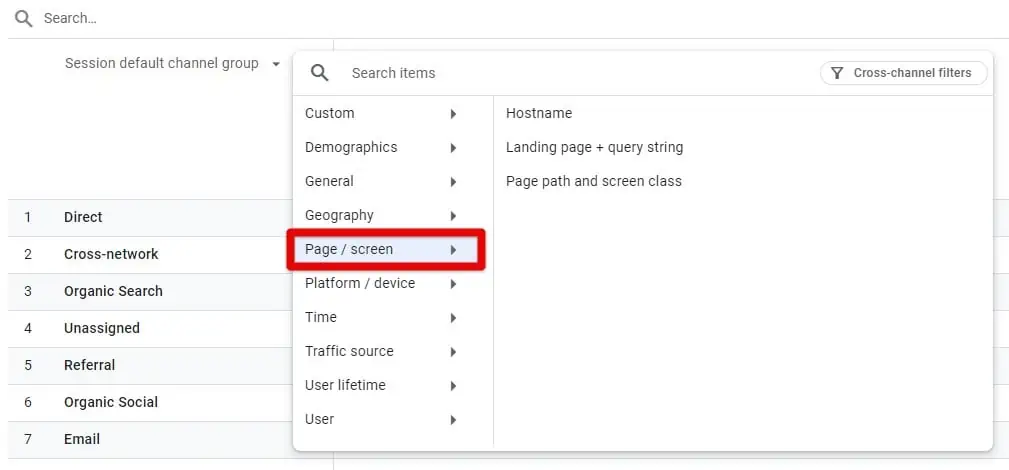
In the dialog, click Page/screen and select one of these dimensions:
- Hostname
- Landing page + query string
- Page path and screen class
Filtering the Traffic Sources Report in GA4
You can filter your report by traffic sources using the report filter. Let’s remove email from our report.
At the top of your report, click the Add filter + button.
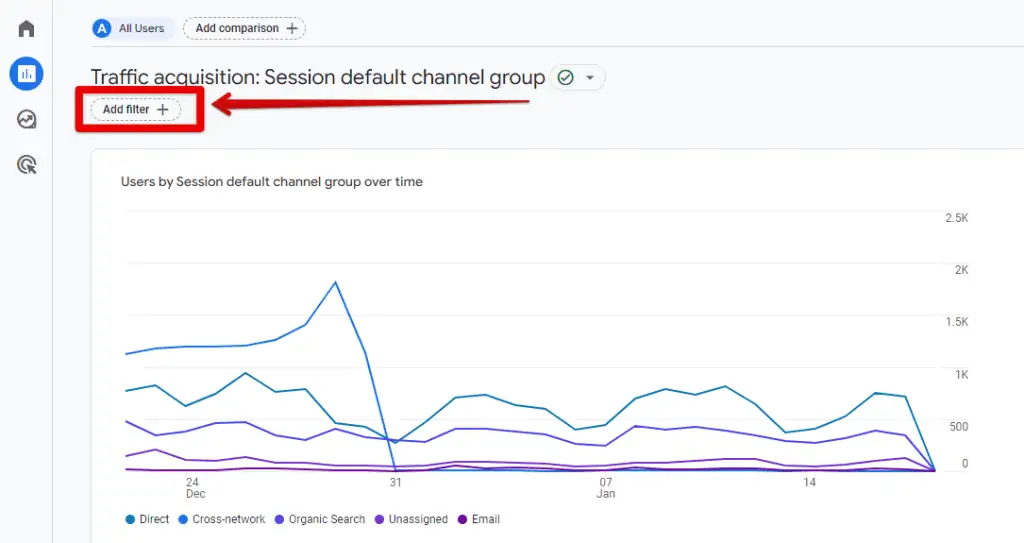
The builder dialog will appear on the right side of your screen. Follow our configuration:
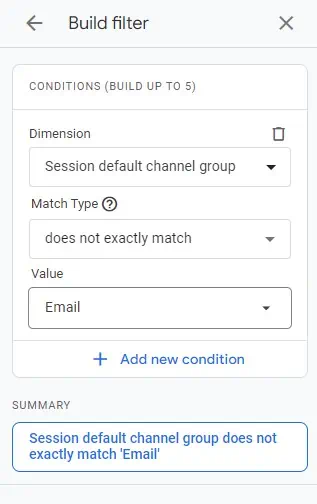
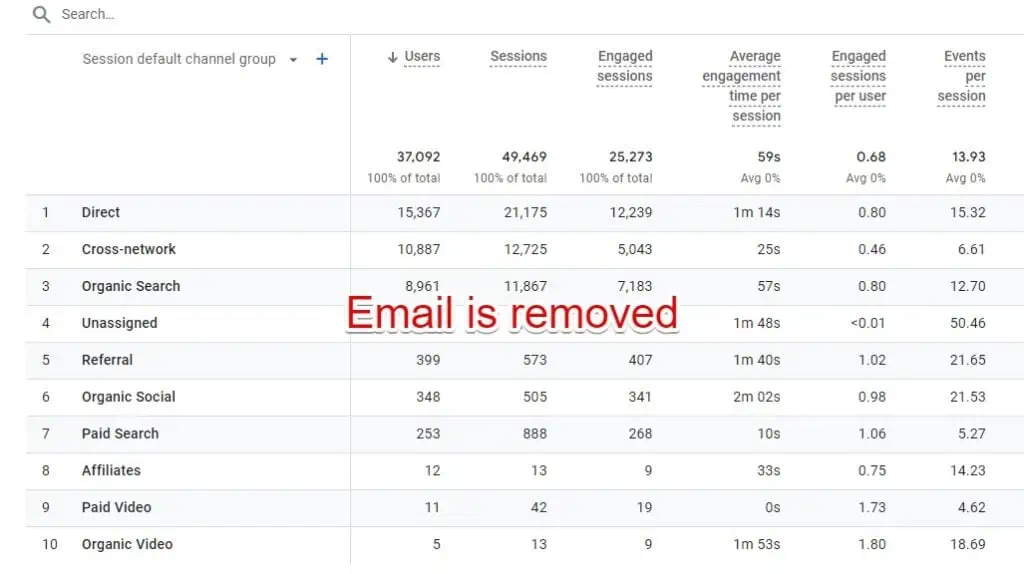
Email is removed from our report table.
What is a User in GA4?
Before diving into the report, let’s understand what users are in analytics, how analytics measures them, and how you can adjust the way users are seen in your reports.
Essentially, a user is anyone interacting with your website or app, just like you are right now.
Even though GA4 can track these interactions, technically, it doesn’t “see” users the way we do. It focuses on devices and platforms, not actual people. Consider scenarios like reading this blog on your desktop while also checking your phone.
Imagine browsing a product on your phone and buying it later on your desktop. Without seeing the person and just looking at the devices, those actions would be seen as separate users with separate sessions. However, GA4 is smarter than that.
It uses four methods (or identities) to link these sessions into one user journey, known as the Reporting Identity. These are:
- User-ID
- Google Signals
- Device ID
- Modeling
The Reporting identity ties the same user actions together. If there is data with the same identity, Google Analytics will see it as one user.
This helps to avoid counting the same user twice and provides more accurate numbers in your reports, giving you a better idea of how people interact with your business.
These identities are grouped into three options:
- Blended
- Observed
- Device-based
Go to the report identity in your GA4 property. Click Admin → Display Data → Reporting Identity. Choose how you want analytics to spot your users.
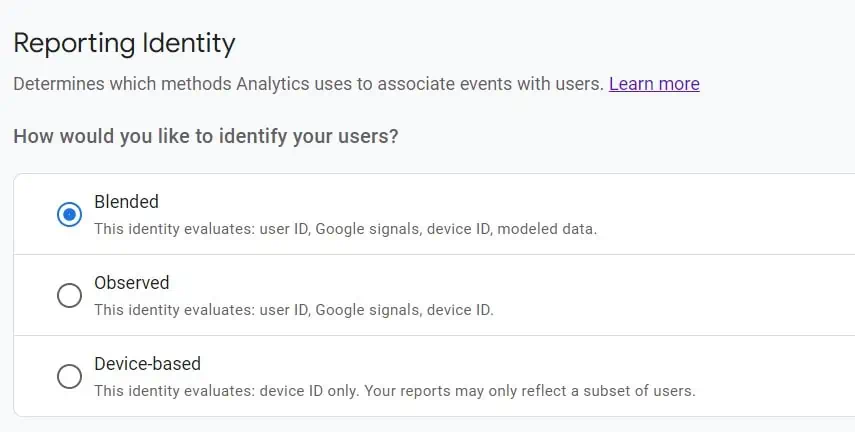
If you don’t see the Device-based option, click the Show All dropdown arrow at the bottom right.

Blended and Observed options include Google Signals and can significantly affect your data. If you notice discrepancies in your reports, consider trying the device-based option.
Don’t worry, it won’t permanently affect your data. You can always switch back and see what works best for you.
🚨 Note: Google announced that “Google Signals will be removed from the reporting identity on February 12, 2024. This change will apply to all Google Analytics 4 properties and will only impact reporting features.”
For more info, read our guide on the GA4 Reporting Identity.
GA4 Scopes Explained
Now that you understand how users are identified, the next step is to understand how they are grouped using dimensions.
A dimension is a characteristic or attribute of your data. Both the User Acquisition Report and the Traffic Acquisition Report use Traffic-source dimensions. Traffic-source dimensions provide three types of information:
- Where your traffic comes from (e.g., Google, Bing, Facebook, Instagram),
- The ways your users arrive at your site or app (the medium, e.g., organic, CPC, email),
- The type of marketing you use to drive traffic (e.g., campaign, creative format, keywords).
Traffic-source dimensions are categorized into three groups, also known as scopes:
- User group (User-scoped dimensions)
- Session group (Session-scoped dimensions)
- Event group (Event-scoped dimensions)
To differentiate between groups, GA4 uses prefixes.
User-Scoped Dimensions
GA4 adds prefixes to some dimensions, which are labels that help you identify which group your data belongs to. For User-scoped dimensions, GA4 uses the prefix, First user.
You’ll see this prefix in your Acquisition report graphs and table. For the table, click any primary dimension. In our case, it is the First User Default Channel Group.
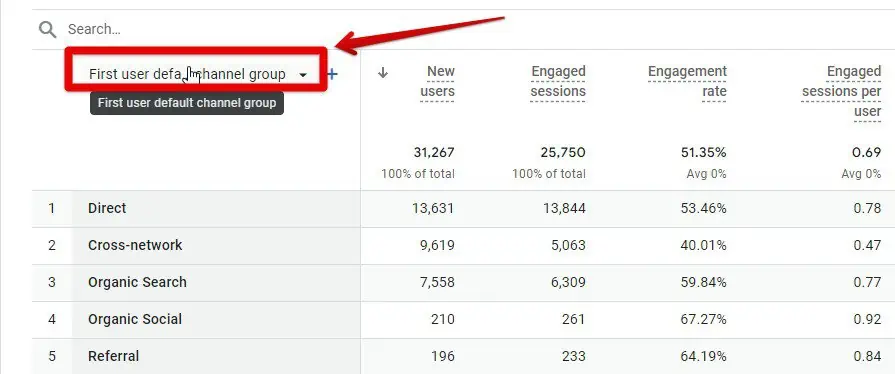
A list of channel groups with the First user traffic sources will appear:
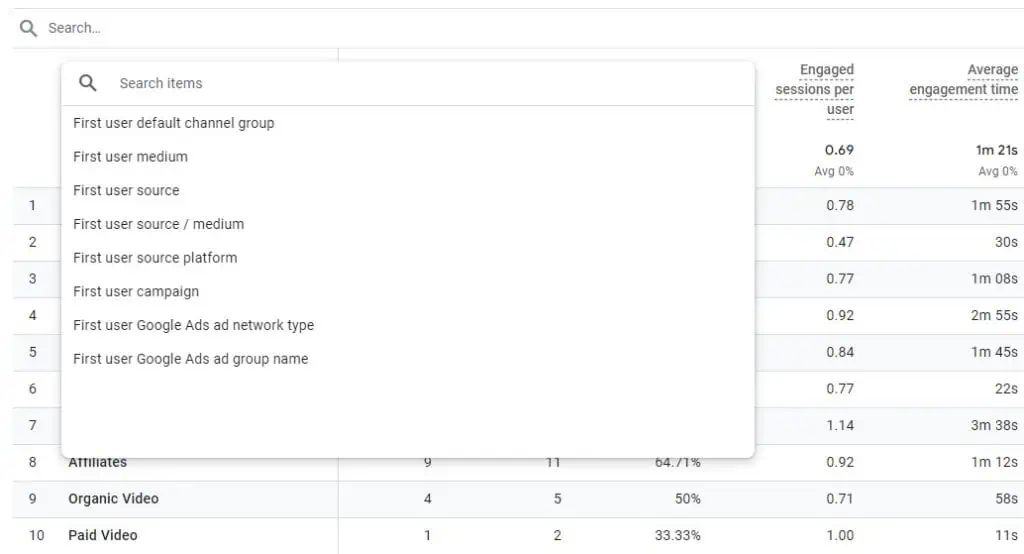
Let’s select the First user medium as an example.
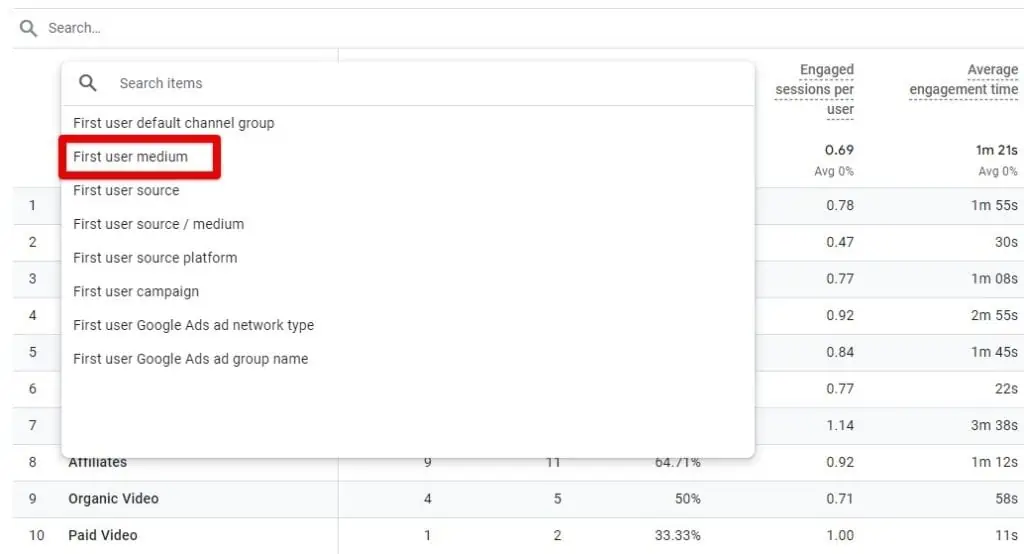
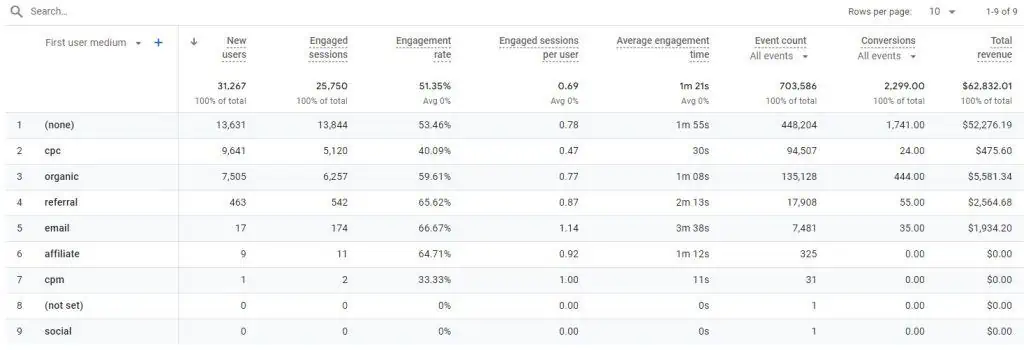
The first user medium shows the results for the types of traffic users used when they first landed on our website or app.
(None) is the primary source for bringing us the most users and revenue. However, this poses a challenge as (none) indicates that we cannot identify the origin of these crucial new users that could be vital to our business.
💡 Top Tip: To address (none) or (not set) issues, check out our comprehensive guide on How to Fix Not Set in GA4. Meanwhile, a helpful trick is to add a secondary dimension, such as Landing page + query string or Page path and screen class. This action might provide insights into the pages associated with these results and help identify the campaigns you promoted with these pages.
We can see that our social traffic is not bringing any new users to our site, as well as no revenue.
Apply the same logic to the other dimensions.
Session-Scoped Dimensions
Everything we covered earlier for user-scoped dimensions applies also to session-scoped dimensions available in the Traffic Acquisition Report, except for a few points:
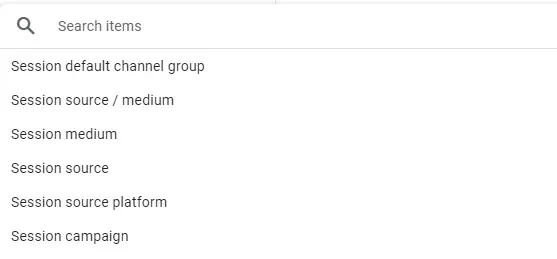
- The prefix will be Session and not First user.
- Session-scoped dimensions show you where both new and returning users are coming from when they start new sessions.
- Session-scoped dimensions get new values every time users return to your website or app.
- The Traffic Acquisition Report does not have the dimensions of Google Ads ad network type and Google Ads ad network group, as you can see here:
Our post on Understanding GA4 Scopes of Traffic-Source Dimensions covers scopes fully.
Summary
That’s it! We’ve explored the difference between GA4 User Acquisition vs Traffic Acquisition Reports. The first helps us understand how new users arrive at our site or app for the first time, while the second includes both new and returning users.
We’ve also seen how GA4 uses labels to recognize the types of traffic source dimensions to which they belong.
However, users are differentiated differently in GA4 through the Reporting Identity, which, depending on your selection, can significantly impact your numbers.
To up your skills, we recommend you learn how to set up GA4 custom dimensions.
Have you ever experienced improvements or discrepancies in these reports, and how did you resolve them? Feel free to share in the comments below!
Master the basics with our FREE GA4 Course for Beginners


")