
Last Modified on January 3, 2024
Since GA4’s launch, there has been a lot of noise about what’s new and exciting. Not just that, many also want to know what’s not available for all of us who have been quite used to all things Universal Analytics.
Whether you have a blog where people consume your content, an e-commerce business, or a corporate website, you would always hear people talking about one metric way more than the others: the bounce rate.

Master the basics with our FREE GA4 Course for Beginners
In simple words, this metric would tell you how many people are leaving your website and/or any specific page. You can then investigate further ‘why’ the bounce rate is high and do something about it.
This has changed quite a lot since people started migrating to GA4. To everyone’s surprise, there was no bounce rate in GA4 for a long time until Google recently announced that it will be adding it to GA4.
To be able to make the best use of this metric and see how it affects you, it is important to understand it completely. This is where this blog will come in handy as you will learn about the following:
- What is Bounce Rate and What’s a Good One?
- GA4 Bounce Rate Definition vs UA Definition
- Difference between Bounce Rate in GA4 and Engagement Rate
- Should You Use Bounce Rate in GA4?
- Where to find Bounce Rate in GA4?
Now, let’s dig in and learn more about this metric everyone keeps bringing up.
What is Bounce Rate and What’s a Good One?
A bounce rate is simply a metric that tells you how many people visited your website or any specific page of your website. Moreover, it also tells you how many of them left without taking any further action or were idle on your website for more than 30 minutes.
It is based on a single page’s sessions divided by all sessions on the site. These sessions are considered to have 0 seconds as there are no subsequent sessions after the first one for analytics to calculate the session length.
Now that you know what the bounce rate is, let’s discuss the important question – what is a good bounce rate? Well, it depends on your website, industry, or niche, the objective of landing people on a certain page, what device they are on, etc., as it is quite contextual.
For instance, a high bounce rate on a page that contains detailed information on some niche topic might be problematic as compared to an “about us” page.
There are still averages for different industries as well as what’s considered good, bad, or worse to benchmark against if that is what you’re looking for.
25% or below means something is wrong, 26% to 45% is considered good, 46%-56% is average, and 57% to 70% is quite high, but depending upon the context, it might be okay. Anything over 70% would indicate something is broken.
Generally, if it seems too high or too low, then be suspicious because there is something broken, and you should look into it.
GA4 Bounce Rate Definition vs UA Definition
A lot of UA terminologies can be seen in GA4 but most of the time, the way they are defined by Google is quite different. In the case of bounce rate, this stands true as well.
This means that comparing the bounce rates among both versions of Google Analytics is not a good idea as they would reveal quite contrasting numbers.
Here’s how GA4 and UA define the bounce rates:
- Universal Analytics: The percentage of website visitors who only view one page during their visit, do not trigger any events or conversions, and/or stay idle for more than 30 minutes on one page.
- Google Analytics 4: The percentage of the website visitors who did not have any engaged sessions i.e., they did not last on the website longer than 10 seconds, complete any conversion event, or viewed at least 2 pageviews.
As you can see, the same metric has two different definitions. This also means that it is important to consider the implications of what they mean when assessing your website’s performance with bounce rate (among other things).
Difference between Bounce Rate in GA4 and Engagement Rate
When it comes to measuring the performance of your website’s content, GA4 comes with another metric that might reveal more: the engagement rate.
Now, what’s the difference between the two? Well, we can interpret the engagement rate as being the inverse of the bounce rate.
Google defines a session as engaged if it meets any of the following conditions:
- Lasting longer than 10 seconds
- Completing a conversion event
- Have at least 2 pageviews or screen views
🚨 Note: If you mark unimportant events as conversions like scroll depths, then these can inflate your engagement rate as these events occur very frequently on the website.
So, the formula is engaged sessions / total sessions on the website. Being inverse of the bounce rate means that if we take out the engagement rate, then what remains can be interpreted as the bounce rate.
For instance, if the engagement rate = 28%, then the bounce rate = 100% – 28% = 72%. Now, if you’re wondering what might be a good engagement rate, then I would apply a similar logic as we applied to what is a good bounce rate above – it depends on the context.
You can find more info on the engagement rate and bounce rate in GA4 in Google’s documentation. There are four types of different engagement metrics in GA4:
- Engagement Rate (shown as a percentage)
- Engaged Sessions (shown as absolute numbers)
- Engaged Sessions per User (shown as an average of total users)
- Average Engagement Time (shown as average engaged session per user)
This leads us to our ultimate question: should you use bounce rate as a valuable metric in GA4?
Should You Use Bounce Rate in GA4?
Simple answer: yes… but bounce rate alone does not tell everything, and it’s often debated by digital marketers whether it is a useful metric on its own or not.
The reason for these conflicting views can be seen in the definition. It’s easy for any visitor to even close the website by mistake or press the back button, spend 5 seconds, and realize they had to turn off their washing machine and closed the page only to return a few minutes later.
Similarly, with engagement rate, visitors could be spending more than 10 seconds on your website on their laptops while browsing social media apps on their phones. However, that session is counted as “engaged”, but are they actively engaging with your website?
So, you can see how these metrics don’t truly tell the whole story and shouldn’t be used as the magic elixir to measure your website’s performance. They are good enough as indicators of finding any opportunities, but shouldn’t be decisive factors or end goals.
Therefore, it is important to use GA4 bounce rate in conjunction with other metrics like conversion rate, engagement rate, and any micro-conversions that are important for your website.
These metrics will give you rich, actionable insights when coupled with UX research activities like heatmaps, scroll maps, click maps, session recordings, objection polls, surveys, and user testing to find out why people find it difficult to engage with your website or not convert.
Where to find Bounce Rate in GA4?
Unlike Universal Analytics, the bounce rate is not readily available in GA4 reports (like many other reports and metrics). You would have to create a customized report to see it.
So, let’s create a customized landing page report with the GA4 bounce rate from scratch by going to the Reports → Engagement → Pages and screens.

Next, click on the pencil icon (hover: customize report) on the top right as seen below:
You will now see an option to customize the current report and save changes. Choose Save as a new report which you can then customize as you want.
You will be prompted to give your new report a name. For this post, we will be naming it Landing Pages. Next, click on Save.
You will now see a panel on the right that says Customize report. Click on Dimensions.
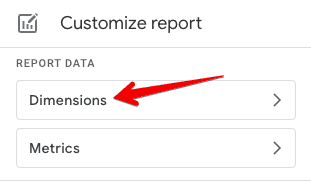
Here, click on the + Add dimension option → add Landing Page as a dimension → select Set as default.
This ensures that the Landing Page will be selected as the default dimension every time you open this report. Don’t forget to click on the blue Apply button at the bottom.

Next, you can choose what metrics you want to see in the report. Click on the +Add metric option → add Bounce rate.
You can also drag the metrics up or down and choose the metric you want to use for the default sorting by clicking on it and seeing the down arrow icon on it. Here, the default sorting metric is Views.

In the next section, you have the option to choose the two types of Charts to be shown at the top. You have limited options for the charts, which are as follows:
- Drag them around to change their positions on the report
- Choose to show or hide by clicking on the eye icon
- Select the types (Bar, Scatter, and Line)

The next part deals with the Reports Template which has only one option, i.e., to unlink from the main report from which we made a copy and save it. You can leave it as is but if you want to unlink, then simply click on the chain icon.

🚨 Note: If unlinked, this report will not receive Analytics updates and it cannot be undone.
Finally, the last part is about the Summary Cards. Here, you can create more cards as well as Edit or Delete the existing ones by clicking on the three dots.
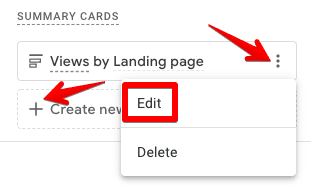
If you select Create new card option, the template starts from blank. If you Edit the existing card, then you can choose the Dimensions Dropdown, Metrics Dropdown, Visualization, Card Filter, and the Card Preview of your chosen settings on the left.

You can now see the final report with the Bounce rate as well as other metrics and settings we configured above.

You can also add this newly created customized report to the main Reports navigation section by clicking on Library.

Next, click on the Edit collection on the Life cycle card.

In Search reports, type the name of the report that we just created, i.e., Landing Pages, and drag it under the section where you want to see it.
You can create a new topic and name it whatever you like as well, but since this report resonates with Engagement, that’s where we will drag it and Save it.

The Landing Page report with bounce rate is now easily accessible under the main Reports → Engagement on the left navigation panel.

FAQ
How does GA4 define bounce rate compared to Universal Analytics (UA)?
In Universal Analytics (UA), bounce rate is defined as the percentage of website visitors who view only one page, don’t trigger any events or conversions, and stay idle for over 30 minutes.
In GA4, bounce rate is defined as the percentage of visitors who did not have any engaged sessions, meaning they did not last on the website longer than 10 seconds, complete any conversion event, or view at least 2 pageviews.
These definitions are different, and comparing bounce rates between GA4 and UA will yield contrasting numbers.
What is the difference between bounce rate and engagement rate in GA4?
The engagement rate in GA4 is the inverse of the bounce rate. It measures the percentage of sessions that meet certain conditions such as lasting longer than 10 seconds, completing a conversion event, or having at least 2 pageviews.
By subtracting the engagement rate from 100%, you can determine the bounce rate.
The engagement rate provides insights into the level of user interaction and involvement on your website.
Should bounce rate be used as a valuable metric in GA4?
Yes, bounce rate can be used as a metric in GA4, but it should not be the sole determinant of your website’s performance. Bounce rate alone may not provide a complete picture, as visitors can leave a page by mistake or engage with other activities while remaining on the website.
It is recommended to consider other metrics such as conversion rate, engagement rate, and micro-conversions in conjunction with bounce rate to gain comprehensive insights.
Additionally, conducting UX research activities can help identify reasons behind high bounce rates and improve user engagement.
Summary
Congratulations! You have made it till the end and in doing so, you have learned what bounce rate means and what is a good bounce rate (remember, it depends!).
We have also covered how the GA4 bounce rate is different from the one in UA and if you should be fixated on the bounce rate to measure your website’s performance (answer: no).
Moreover, you have also discovered the engagement rate in GA4, how both these metrics compare (opposite of each other), and how important it is to combine them along with the UX research to get the best insights!
Finally, we’ve shown you how to find the “talk of the town” metric in the digital marketing realm – bounce rate in GA4, by creating a customized report and adding it to your main reporting navigation for easy access.
While we are talking about reports in GA4, have you tried creating a funnel exploration report in GA4 yet? If not, here’s a handy guide to get you started!
Let us know in the comments below if you have been using the bounce rate in GA4 or the engagement rate. What other metrics do you use to measure your website’s performance?
Master the basics with our FREE GA4 Course for Beginners


")