
Last Modified on February 3, 2025
Google Analytics 4’s Explore section is its brainchild in many ways as it gives you great flexibility to create and analyze the data compared to UA, and its visualizations make for easy comprehension.
This can also mean a bit of a steep learning curve and navigating through different types of reports as well as moving parts to get your reporting machine going.
What type of reports do I create? Is it useful for this use case? Is it needed or does it just look pretty? These are a few questions (among others) that should spring up in your mind to create a useful exploration.
This brings us to the technique being used in these explorations, which simply means the type of visualization you’ll get with the report.
There are currently 6 techniques in explorations – Free form, Cohort, Funnel exploration, Path exploration, Segment Overlap, and User lifetime.
You can also choose a blank template from the gallery to start with or simply pick one from the template gallery based on the technique, use case, and industry.
Here are the top 10 Google Analytics 4 exploration reports with their use cases that we will talk about:
- Path Exploration
- Funnel Exploration
- Segment Overlap Exploration
- User Lifetime Exploration
- Cohort Exploration
- Landing Pages Exploration
- Conversions Exploration
- Site Search Exploration
- Experiment Results Exploration
- Purchasers & Non-Purchasers Exploration
Let’s start learning about all these different explorations.
What are Explorations in GA4
Explorations are customizable reports that use advanced techniques (we’ll explain what those are in a moment) to go beyond the capabilities of standard reports.
Therefore, they allow for deeper analysis and the ability to answer more complex questions.
Techniques refer to different methods for analyzing and visualizing data. These come in the form of templates you can customize or build on an existing one.
Explorations utilize seven techniques:
- Free-form exploration
- Cohort exploration
- Funnel exploration
- Segment overlap
- User exploration
- Path exploration
- User lifetime
💡 Top Tip: We recommend starting by building Explorations from scratch. Pre-built exploration techniques available in the gallery are a great way to learn how they work and experiment with them. However, since they already include data, you might see numbers that don’t align with your expectations. This could be due to filters, segments, or different logic applied to the data, which may require you to backtrack and identify the root cause, often making you question your results.
Why Explorations Matter
Explorations provide capabilities unavailable in standard reports, including access to additional dimensions and metrics.
Explorations are ideal for discovering insights and comparing audiences. Additionally, you can export data into formats like Google Sheets or PDFs and create GA4 segments or remarket audiences.
Explorations make it easy to organize data by allowing you to drag and drop dimensions and metrics seamlessly.
The more you work with GA4, the more you’ll rely on Explorations to uncover answers and gain deeper insights.
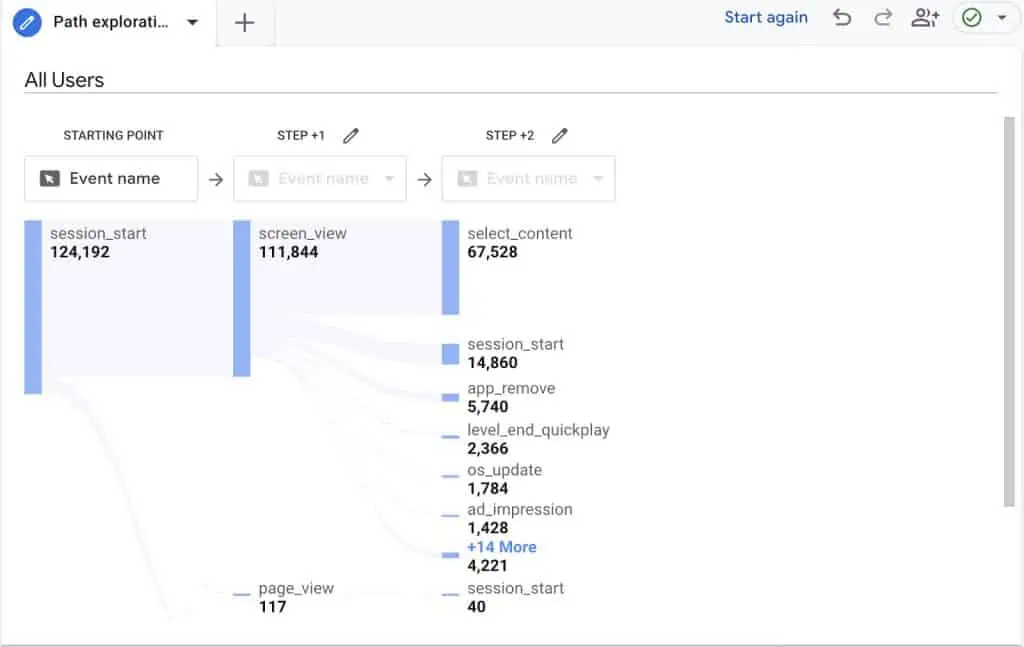
1. Path Exploration
This report will help you understand how users navigate your website and what paths they take to get from one page to another, especially if you want your users to get to the conversion page like the lead form or checkout.
As a result, you will be able to understand what pages or events are causing users to drop off, and if you see too many back-and-forth loops, then it could be because of some confusion in the users’ minds.
This can lead to other forms of research like heatmaps, and session recordings on those pages to find out what could be confusing the users and to remove that friction point.
2. Funnel Exploration
If you have a defined funnel on your website, which is especially the case with e-commerce steps, then knowing at what step users are abandoning the funnel will help you optimize those critical steps to improve your conversion rates and push the user down the funnel.
Funnel exploration reports with visualizations and segments can be quite helpful in understanding that.
You can also create audiences from each funnel step and use them for remarketing or running a/b tests to see what converts better for that specific audience.
Similar to path exploration, you can also run qualitative studies to find out if there’s something specific that is stopping users from proceeding to the next step.
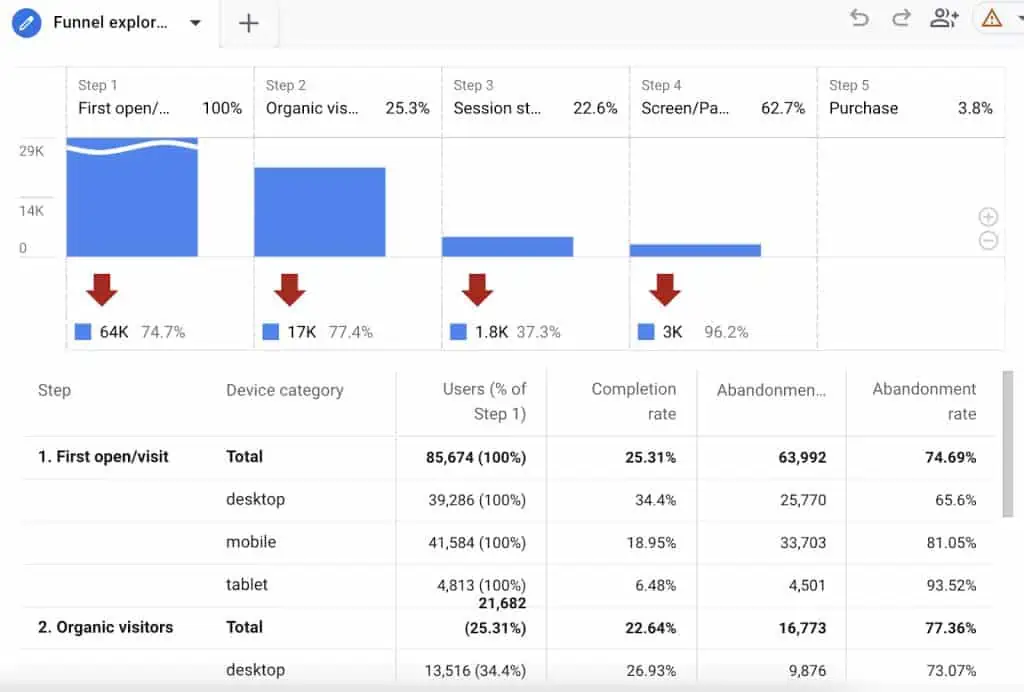
🚨 Note: Funnel explorations are always based on users, not sessions or views.
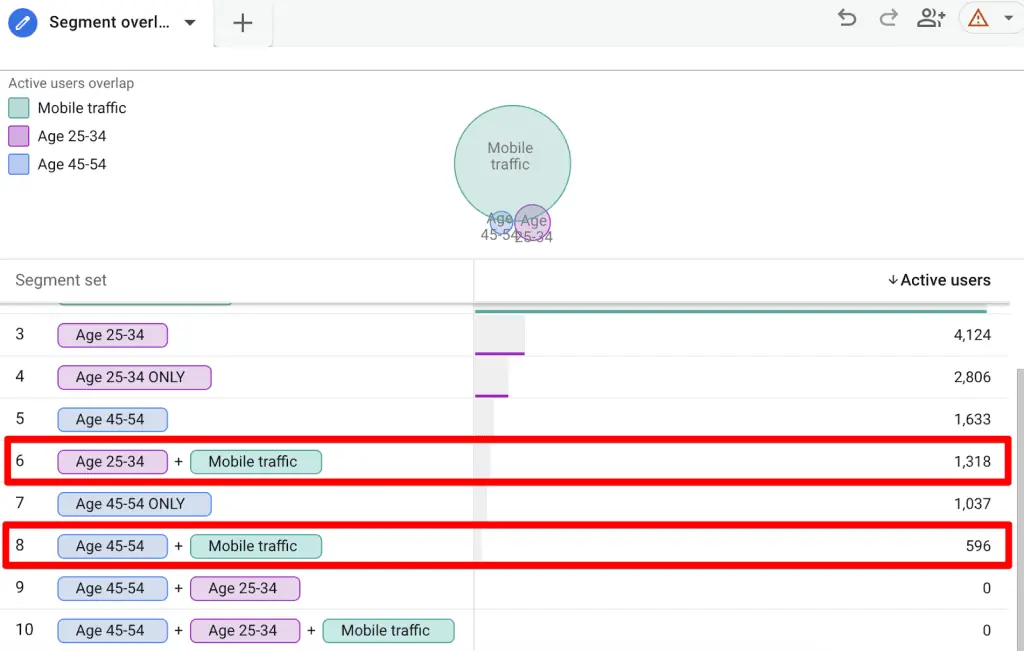
3. Segment Overlap Exploration
Understandably, you want to separate your website traffic based on specific regions, devices, and/or any other conditions. However, seeing your audiences’ overlap can also be helpful.
Creating segment overlap Google Analytics 4 exploration reports will help you to see how your different segments overlap with one another.
You can use that information to find commonalities, to focus on those segments more than the others, i.e., one type of combination converting more than the other.
In the example below, we can see that the traffic on Mobile + aged 25-34 is high vs Mobile + aged 44-54 which is low. Based on this, the former group should be at the core of our website strategy.
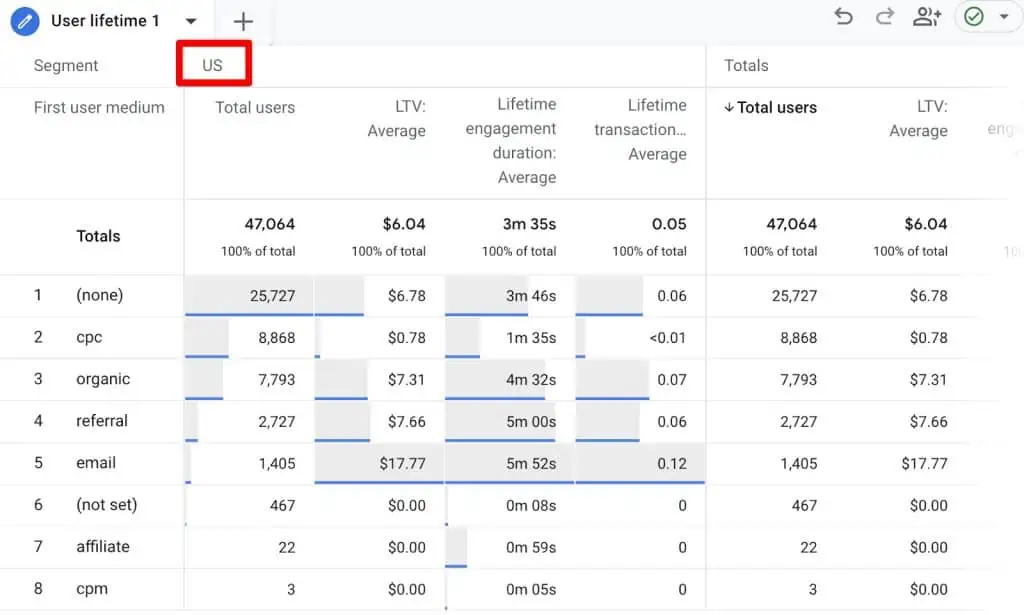
4. User Lifetime Exploration
This report provides a breakdown of users and their expected lifetime value. You can also uncover insights about unique user behavior, like when was the last time they purchased and which campaigns can lead to more purchases or churn.
For instance, if you can see which traffic source is contributing to more LTV of users, then you can direct more resources towards it and optimize your marketing budgets.
It also helps you to understand your valuable campaigns and how to get more valuable customers.
Applying more demographic segments is another way to comprehend what demographics are your most valuable users and optimize your creatives, messaging, and other marketing efforts toward them.
5. Cohort Exploration
If you are interested in knowing how a group of users with shared characteristics behave over the time of days, a few weeks, or a couple of months, then you could use this type of GA4 exploration report.
Cohort explorations can help you understand how these groups react to different strategies and how their engagement changes over time.
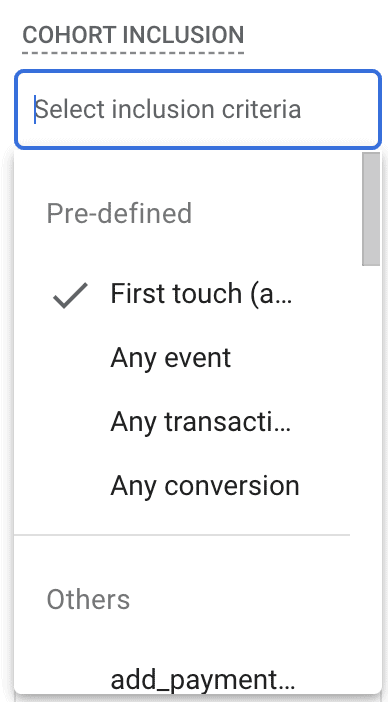
You can choose what type of event you want to use as Cohort Inclusion criteria from pre-defined or other custom events.
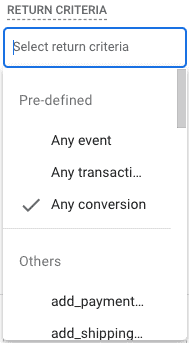
Next is the Return Criteria, where you can choose from pre-defined or other custom events.
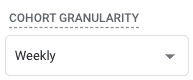
Cohort Granularity is the next important part of this exploration, which can be done on a daily, weekly, or monthly basis.
And finally, you can choose what type of Calculation method to use out of three, i.e., Standard, Rolling, and Cumulative.
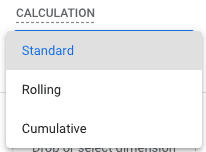
We chose First touch (acquisition date) which had Any transaction with weekly granularity based on standard calculation, as our inclusion criteria, and can see how it will behave in the below example.
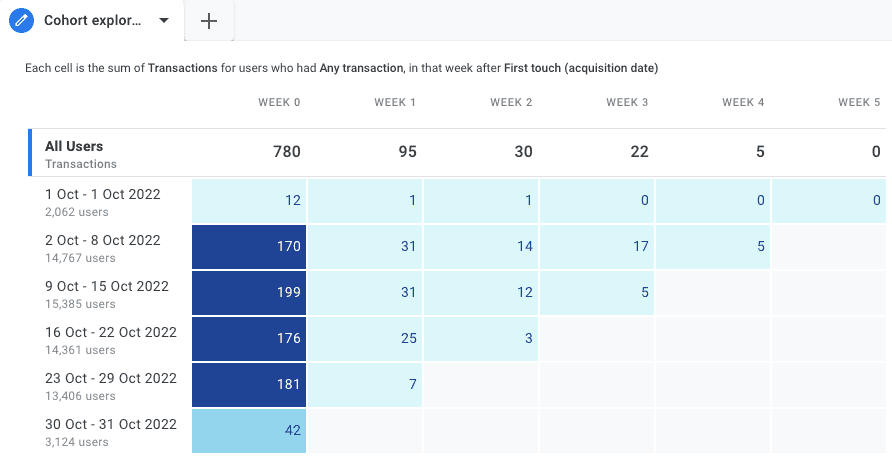
Based on this report, we can say that between 2 Oct – 8 Oct 2022, the website acquired 14,767 users who had 174 transactions in the same week they were acquired and 5 transactions in Week 4.
You can read about what different calculation methods mean, as well as the limitations of cohort explorations to make the most out of them on the cohort explorations Google documentation page.
The next set of reports is all based on the free-form technique which is the most common one in Google Analytics 4 exploration reports.
All of these reports have specific use cases and are only a few of many examples of how we can use free-form reports for analysis.
GA4 cohort is a topic often skipped, and yet it can bring back your business on track when things go wrong. It is one that is not always easy to read and interpret. Our guide on Using Google Analytics 4 Cohort Analysis to Reengage Users explains it all.
6. Landing Pages Exploration
You can now add the Landing Page dimension in the standard reports as well. However, it becomes a bit of a problem if you want to know the sources your users come from or what devices or countries bring more people to the landing page.
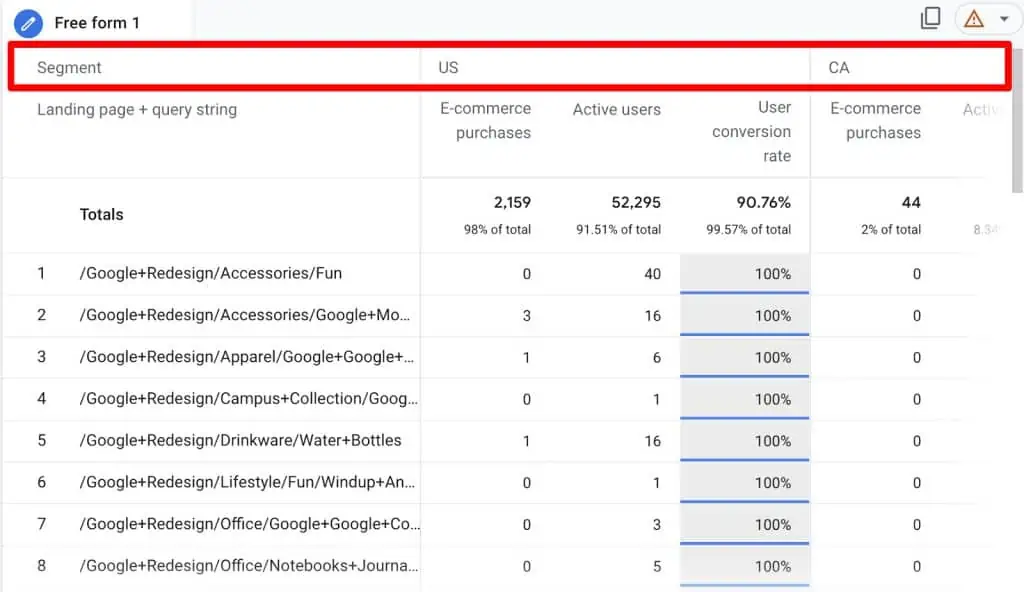
This is where creating a free form report for landing pages will help you use these types of segments and give you more context about your traffic’s behavior.
It’s also important to know about your landing pages’ performance whether you’re bringing paid traffic via ads or running a/b tests so that you can get the maximum out of your campaigns.
In the below example, we are looking at segments from the US and Canada and how they convert after landing on different pages.
7. Conversions Exploration
One of the most important metrics of our website’s performance is the conversions we get, and most of the standard reports in GA4 will show you the conversions (events marked as conversions in the admin settings).
However, there isn’t much we can do with the standard reports, for instance, if you want to know conversions by device, source/medium, or even country. Applying segments in your Google Analytics 4 exploration reports will solve this dilemma.
The default template in Google Analytics 4 exploration reports is a good place to start. You can also add metrics like session or user conversion rate or customize the report as you’d like. It has three types of reporting tabs in it by default.
First, we have the Conversion types that show all conversion events segmented by devices.
- Conversion types that show all conversion events segmented by devices.
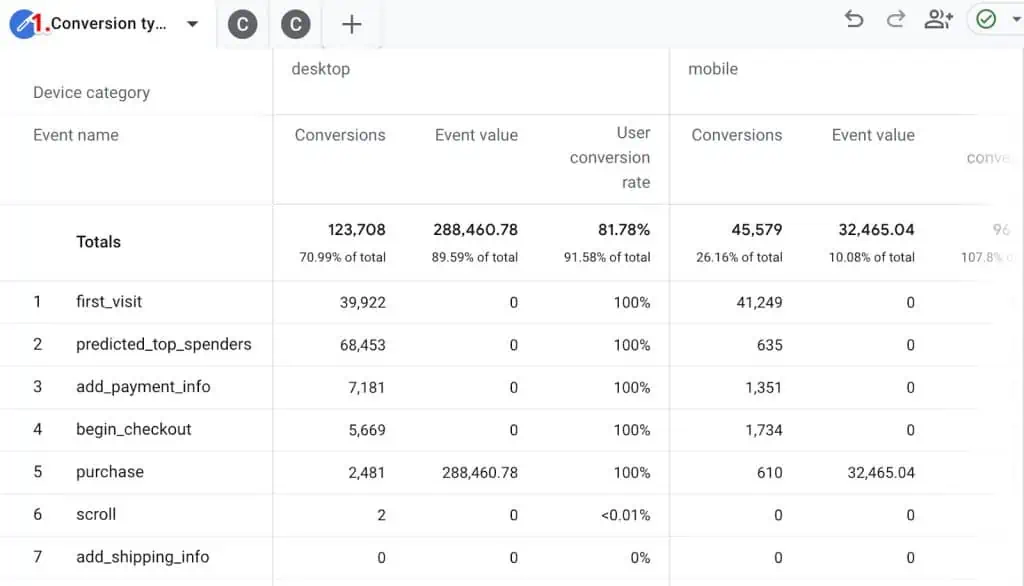
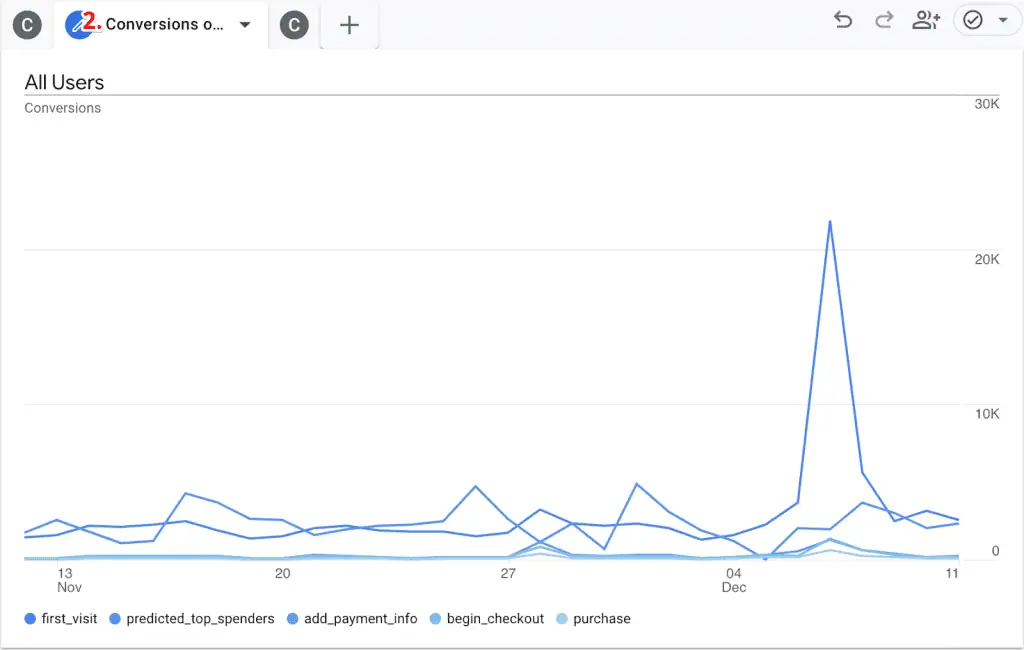
- Conversions over time shown as a trend line graph.
- Conversion sources that show sources for all the conversions.
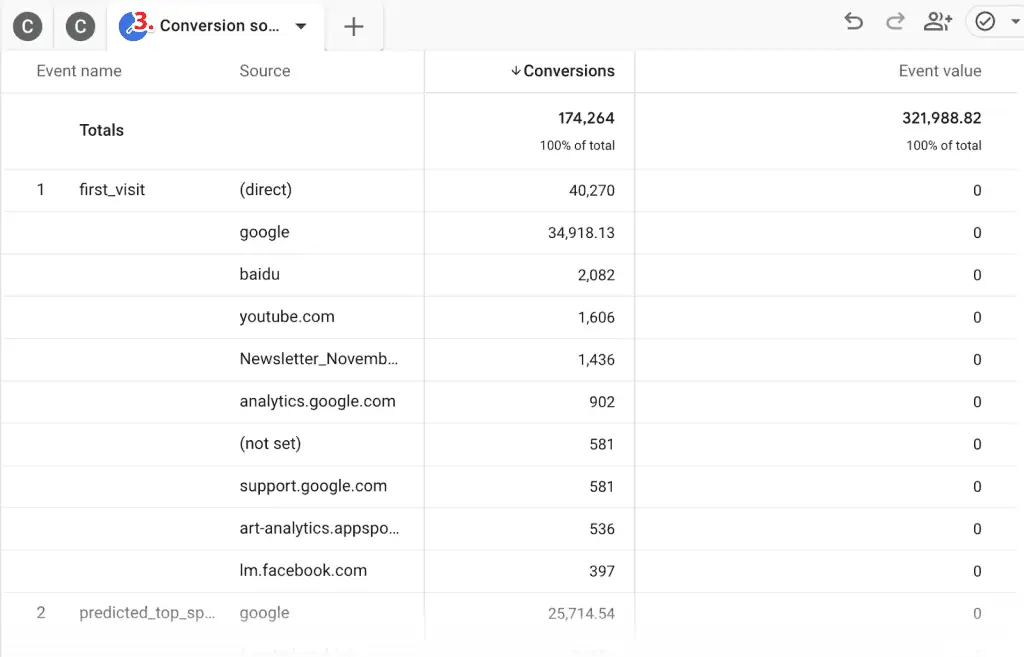
You can add more tabs or customize them to suit your needs.
🚨 Note: You can add up to 10 tabs/visualizations in an Exploration.
8. Site Search Exploration
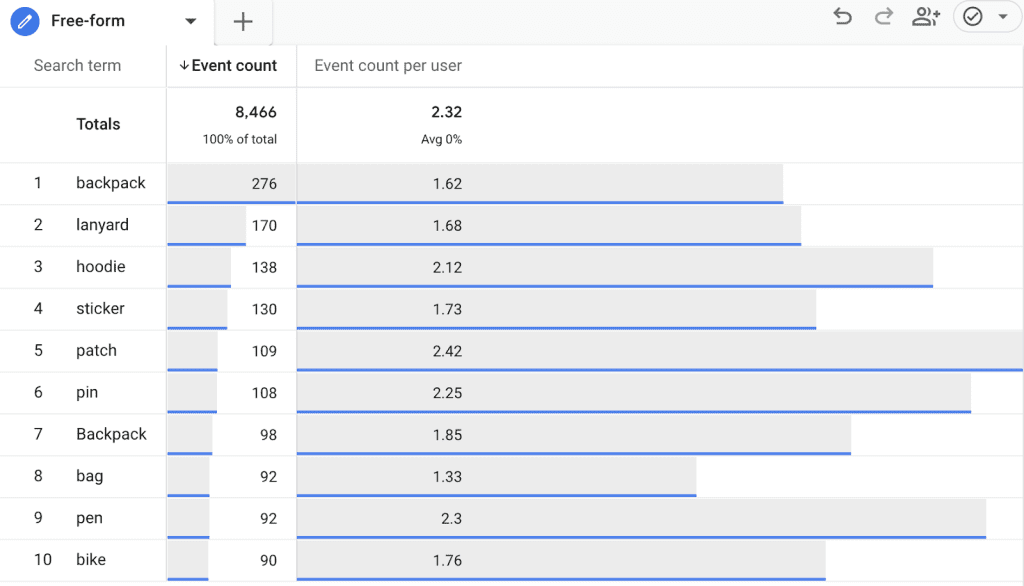
We all know the importance of knowing what visitors are looking for on our website and if you have site search enabled, then you can find those search terms in your Google Analytics 4 exploration reports.
This information can be used to make it easy for your visitors to find what they’re looking for, to use in your remarketing campaigns, or your messaging and copy to resonate even better with your audience.
As always, throwing in some other useful metrics and segments will give you more context so don’t forget to customize it further.
9. Experiment Results Exploration
If you work in the conversion rate optimization (CRO) industry, then finding test results in GA4 is one of the major tasks you’d be doing daily. However, standard reports won’t help you here.
The good news is that Google Optimize (and several other AB testing tools) send the events to GA4 already, but you need to add those events as custom definitions to use them in your Google Analytics 4 exploration reports.
This one is a little tricky, so let’s start by adding custom dimensions for Google Optimize by going to Admin → Custom definitions (Property column).
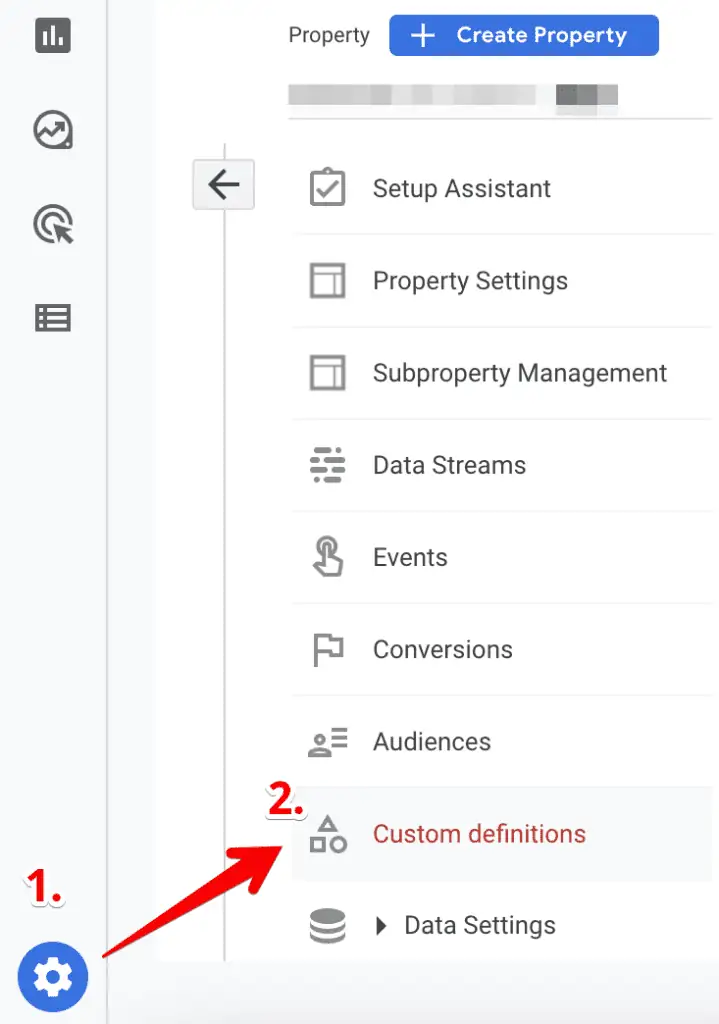
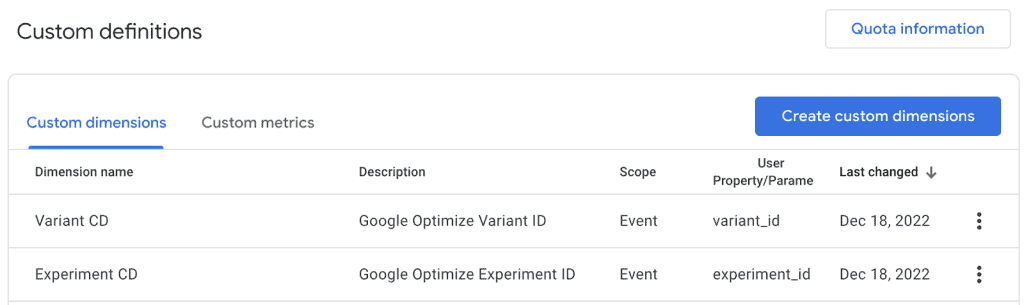
Now click on the Create custom dimensions button and create two event-scoped custom dimensions, i.e., experiment_id and variant_id. You can name them however you want, and add any helpful description for anyone to understand.
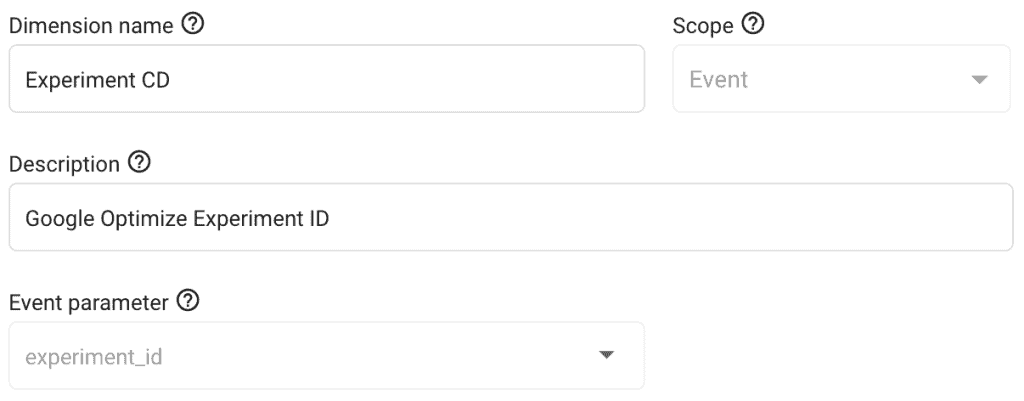
🚨 Note: You cannot edit the scope or event parameter after creating the custom definition.
Once done, you’ll have two of these custom dimensions:
You’ll have to wait up to 24 hrs. before the data starts flowing in for them to use in your Google Analytics 4 exploration reports.
Next, create a free-form exploration and add segments for your control and treatment/variant(s) by using the Variant CD we saved in the steps above and the experiment ID from Google Optimize.
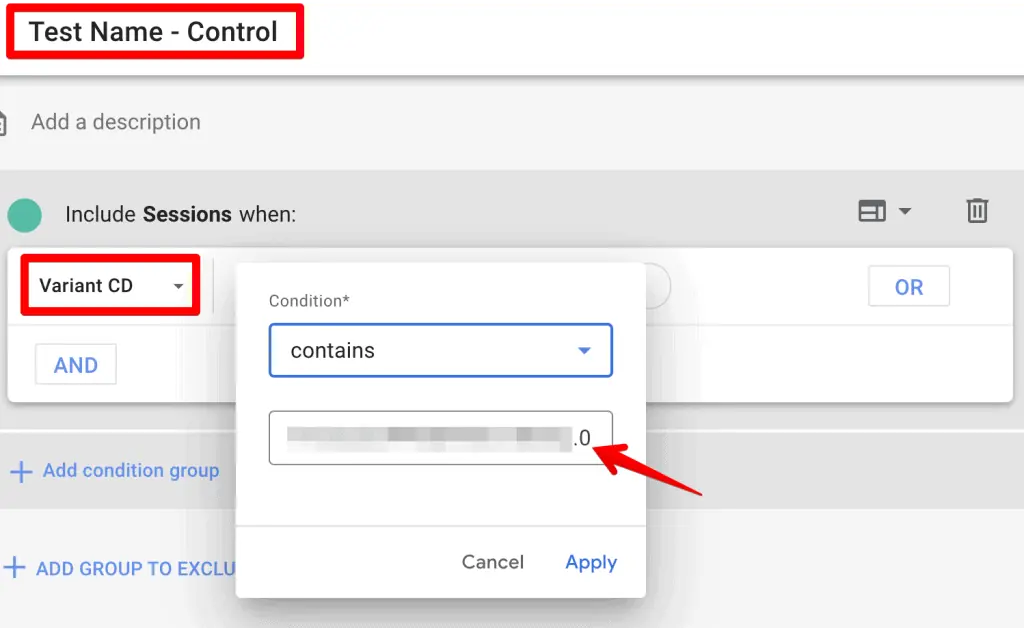
0 after the period is the first variation in the sequence, which is normally the control.
But, if your sequence is different, then keep that in mind and use the appropriate number. In this case, we have two variants, so we will be using 0 (control), 1 (variant 1), and 2 (variant 2).
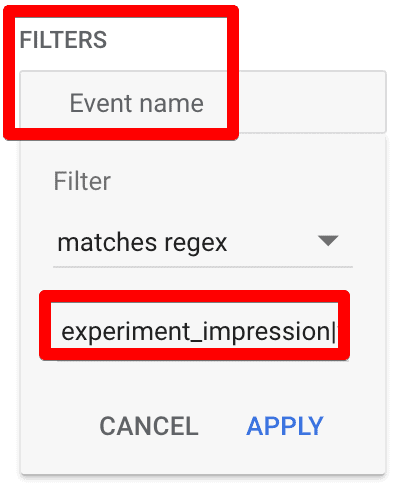
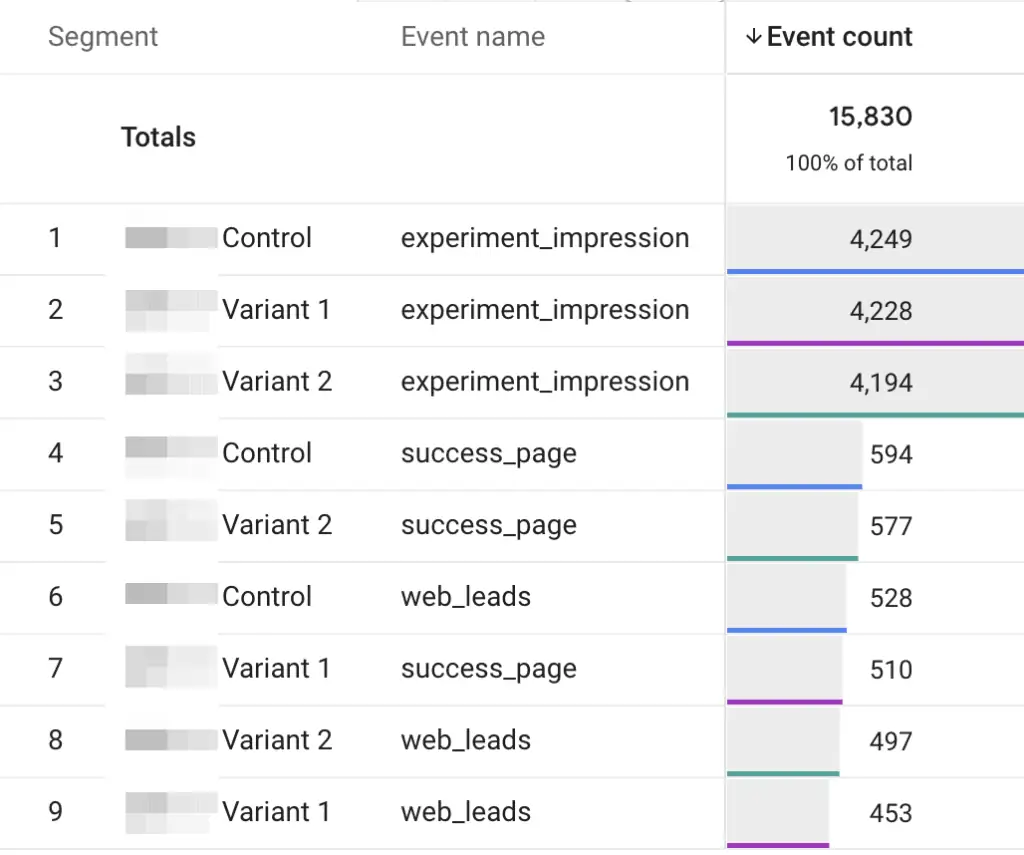
We only want to see the events that matter to us, which is normally the number of impressions and conversion event(s) for that experiment.
We can filter these under the Tab settings column → Filters based on the Event name.
When you’re all done with your hard work, your final Exploration will look something like this:
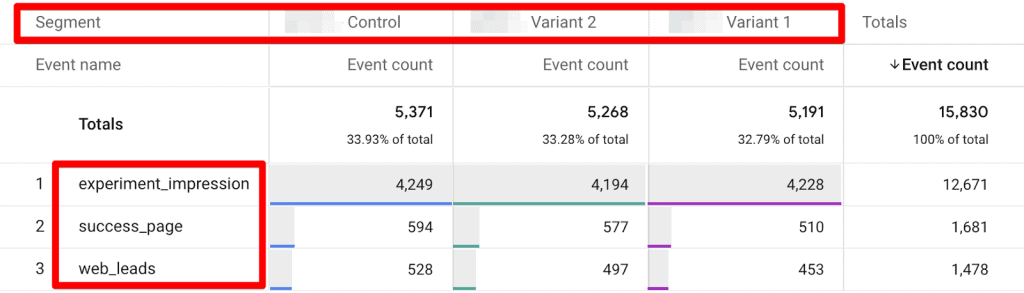
To improve the readability of this report, go to Tab settings → Pivot → select First row.
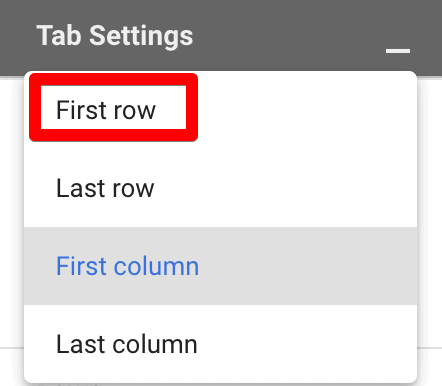
Now, the report groups the results by each segment, i.e., variants in the first column.
You’re free to play around and choose a pivot setting that works best for you.
10. Purchasers & Non-Purchasers Exploration
Wouldn’t it be helpful to separate the users who purchase from the people who don’t on your website? It would be even better if you knew if they viewed a certain promotion and then converted to know the impact of your promotional activities.
We can do this by creating a free-form exploration with segments for purchasers and non-purchasers.
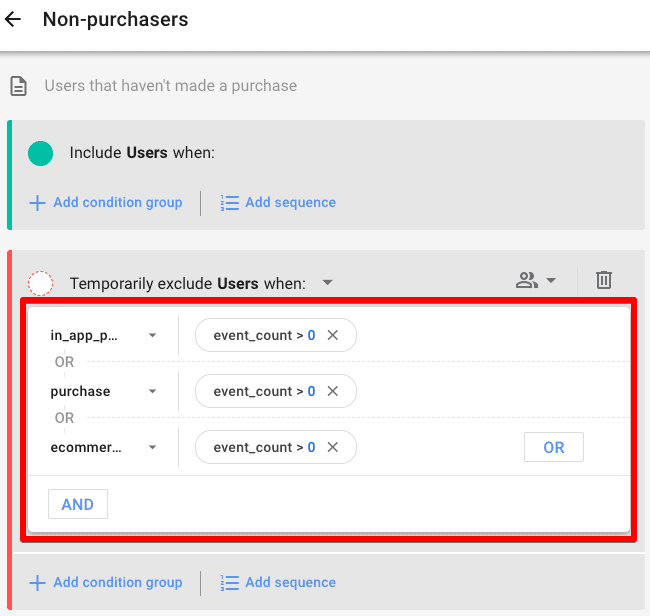
For the Non-purchasers segment, choose all the conversion events that amount to purchases and exclude them if their event_count is greater than 0.
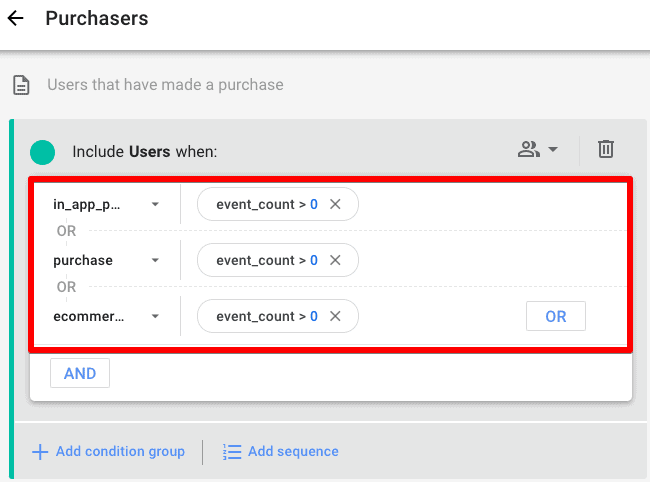
For the Purchasers segment, choose all the conversion events that amount to purchases and include them if their event_count is greater than 0.
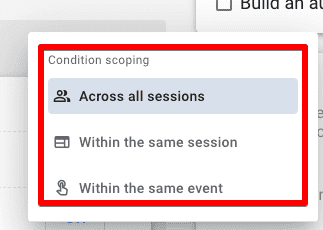
💡 Top Tip: You can also edit the segments based on condition scoping Across all the sessions, Within the same session, and Within the same event.
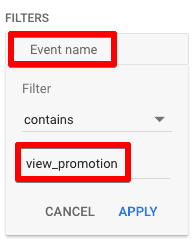
Next, we can apply the filter on the Event name for the view_promotion event only.
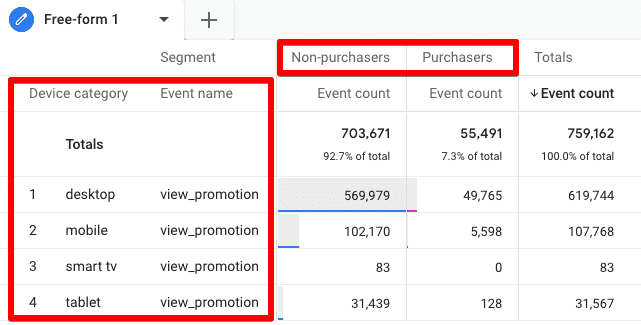
Your final report will then show the numbers for people who viewed a promotion and then did or didn’t make a purchase.
Of course, you can change the dimension from device category to country, city, source/medium, or anything important to you, as well as the Event name.
You can then create an audience based on these segments and retarget them in your marketing campaigns.
A similar method could also be used for a SaaS business where there are no eCommerce purchases but only form submissions for demos, trials, etc. by using the appropriate event in the segment while keeping all other settings the same.
You can call them Converters & Non-Converters.
🚨 Note: Also, don’t forget to check the User Explorer report which focuses on tracking what individual users are doing on your website.
Limitations of GA4 Explorations
Understanding these limitations of Google Analytics (GA4) Explorations can avoid potential issues that can significantly slow down reporting, sometimes by months. Below are the key limitations to be aware of:
- Data retention settings
- Data incompatibility
- Data thresholds
- Discrepancies between GA4 and Looker Studio
- Data processing time
Let’s cover each in more detail.
1. Data Retention Settings
One of the most common limitations in GA4 Explorations is data retention settings. By default, GA4 limits the viewable data to only two months. This restriction can hinder your ability to analyze longer date ranges, such as 90 days of data.
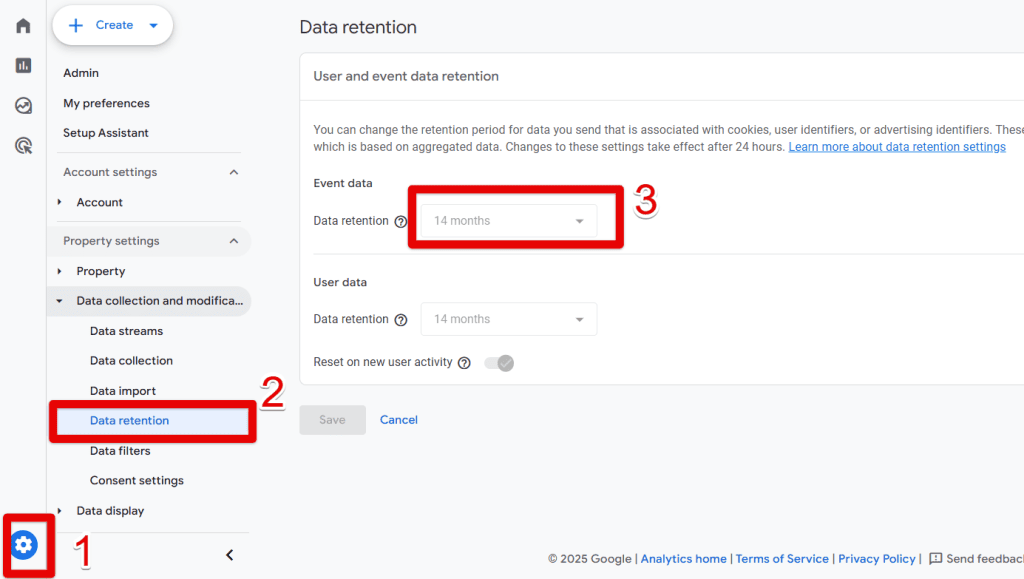
To address this limitation, you can easily change the data retention settings:
- Navigate to the Admin section.
- Under Data Collection and Modifications, select Data Retention.
- Increase the event data retention to 14 months.
It is essential to make this change early, as it may take a month or more for the new data retention settings to take effect. Without this adjustment, you may miss valuable insights, especially when analyzing trends.
2. Data Incompatibility
Another frequent limitation is data incompatibility, which prevents users from combining different dimensions and metrics in an exploration. This issue arises for two main reasons:
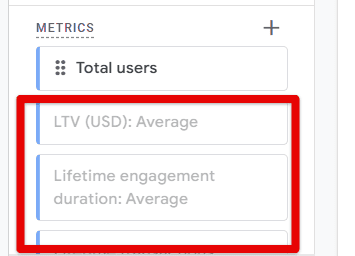
- Accuracy of Data: Google Analytics uses specific dimensions and metrics that align with its data processing techniques. If you attempt to use incompatible data types, they will not be available for exploration.
- Incompatible Combinations: Certain dimensions and metrics do not work together. For instance, you cannot break down campaign costs by event names. When dimensions and metrics are incompatible, they appear grayed out in the interface, indicating they cannot be used together.
3. Data Thresholds
Due to data thresholds, GA4 may not display demographic data, such as country or interest. This limitation typically occurs when user counts are low, which is a security measure to protect individual privacy.
To mitigate this issue, consider the following strategies:
- Adjust Date Ranges: Use longer date ranges to increase the user count and potentially access more data.
- Export to BigQuery: Exporting your data to BigQuery can provide additional insights; but be aware that Google Signals data is not exported to BigQuery, which may lead to discrepancies.
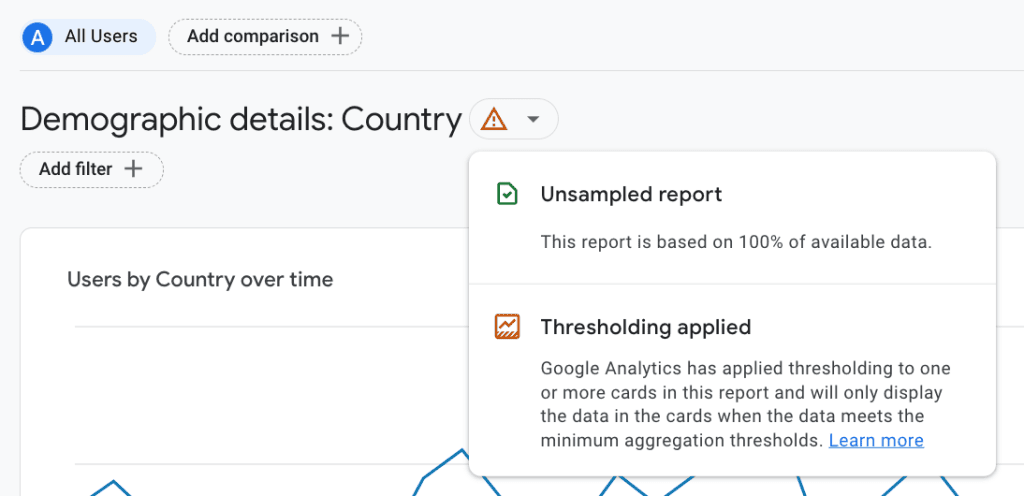
There’s a lot to remember with GA4, so you may sometimes forget that data threshold may be why you’re not seeing data. For this reason, always check the data quality indicator at the top right corner of your explorations.
It’ll have the following message if thresholds are applied:
“Google Analytics has applied thresholding to one or more cards in this report and will only display the data in the cards when the data meets the minimum aggregation thresholds.“
4. Discrepancies Between GA4 and Looker Studio
Users often encounter discrepancies between the data displayed in GA4 Explorations and Looker Studio. For example, the total user counts may not match, sometimes showing significant differences.
To ensure consistency, consider exporting your data from GA4 Explorations to Google Sheets.
The summed numbers in Google Sheets will align more closely with the data in Looker Studio, as the latter may not reflect the exact figures seen in GA4 Explorations.
If this topic interests you, please check our detailed guide on How to Fix Data Discrepancies Between GA4 and Looker Studio.
5. Data Processing Time
The fifth limitation involves data processing time, which can lead to delays in data availability. Key events may take one to two days or longer to appear in your reports.
When revisiting an exploration after a few days, you may notice discrepancies in the data, particularly with key events and total user counts. These discrepancies can be more pronounced in Looker Studio.
Keep in mind the following:
- Delayed Event Processing: Events may not be processed immediately, leading to inconsistencies.
- Modeled Key Events: Conversion data can take more than 12 days to update, which may result in further discrepancies.
So, being aware of these limitations in GA4 Explorations can help you navigate potential challenges and improve your reporting efficiency.
Summary
You are now aware of 10 different Google Analytics 4 Exploration reports to get started with customized reports in GA4, with a lot of nuances and different settings within them.
🚨 Note: If you’re missing GA4 event parameters from your reports, this guide will be able to help you out.
These explorations are a great addition to the already available (but limited) standard reports. They also feature the powerful visualizations you get with these, to easily digest all the information.
The exploration techniques are super helpful and serve specific purposes, so you need to be aware of their systematic differences.
However, chances are that you might not even use all these different types of reports in your day-to-day work, so it’s not important to be an expert in every one of them. We hope you’re not overwhelmed by these.
At the end of the day, what’s most important is to get actionable insights and share them with other stakeholders, and you can share your Google Analytics 4 exploration reports too.
That being said, if you are curious about what more than 100 people think about GA4, then head over to this insightful blog where users share their opinions on GA4.
Lastly, don’t leave us without telling us what type of Google Analytics 4 exploration reports have you been using to uncover some great insights in the comments. We are as curious as our readers are!


")
Thanks for the great post!
Do you know how I can segment this path exploration report between new and existing users?