
Last Modified on January 7, 2025
When working with tools like Google Tag Manager, you will inevitably run into issues or need something that can make your job easier.
Enter Google Tag Manager extensions. These browser extensions can be super helpful in understanding what’s going on, whether it’s related to DataLayer, Google Analytics 4, or other marketing tools like Meta, Microsoft Ads, etc.

Sign up to the FREE GTM for Beginners Course...
Other extensions can be used in conjunction with GTM to get the much-needed assistance in achieving your tracking and debugging goals, which we’ll have a brief look at.
Now, there are many extensions out there that can be used with GTM, but we are going to focus only on 11 so you’re not overwhelmed and can start using them right away.
To make things simpler, we’ve further divided them based on their use cases which we are going to cover as follows:
- DataLayer / Analytics / Google Tag Manager Extensions
- Other Useful Extensions
- Bonus: Extensions for Ad Pixels
The list is not in any particular order, e.g., ranked, but just the most useful ones.
DataLayer / Analytics / Google Tag Manager Extensions
These extensions help with Google Tag Manager, Google Analytics, and generally dataLayer debugging.
1. Tag Assistant Companion
This is Google’s extension to replace the much-loved Tag Assistant which provided a lot more info on the extension. If you have the previous version still installed, you will benefit from the newer version’s features.
Here’s what the previous tag assistant extension looks like which is no longer supported.
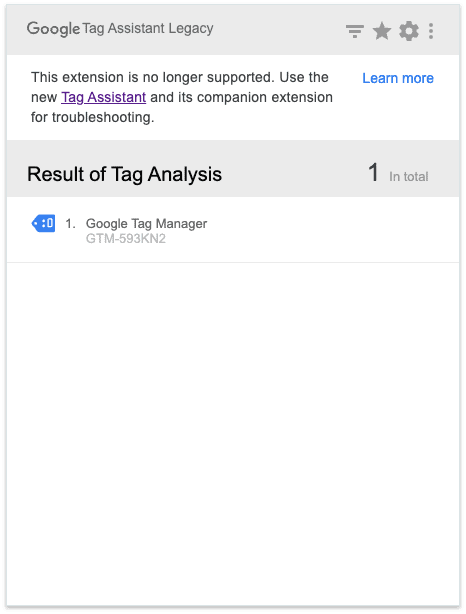
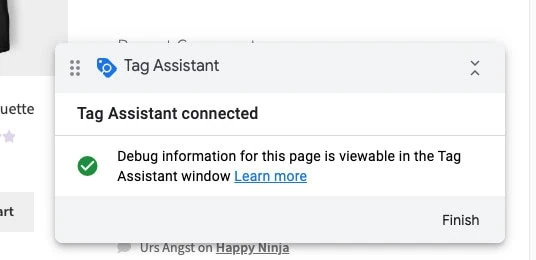
Google recommends using the new Tag Assistant (which opens on a separate page) along with its companion extension that shows if the preview mode is active and helps debug iframes and multiple windows from the same debug session.
2. Analytics Debugger
It’s been around for quite a while now, and the person behind it, David Vallejo, has contributed a lot to the analytics community overall with his resources and has made the interface quite user-friendly lately.
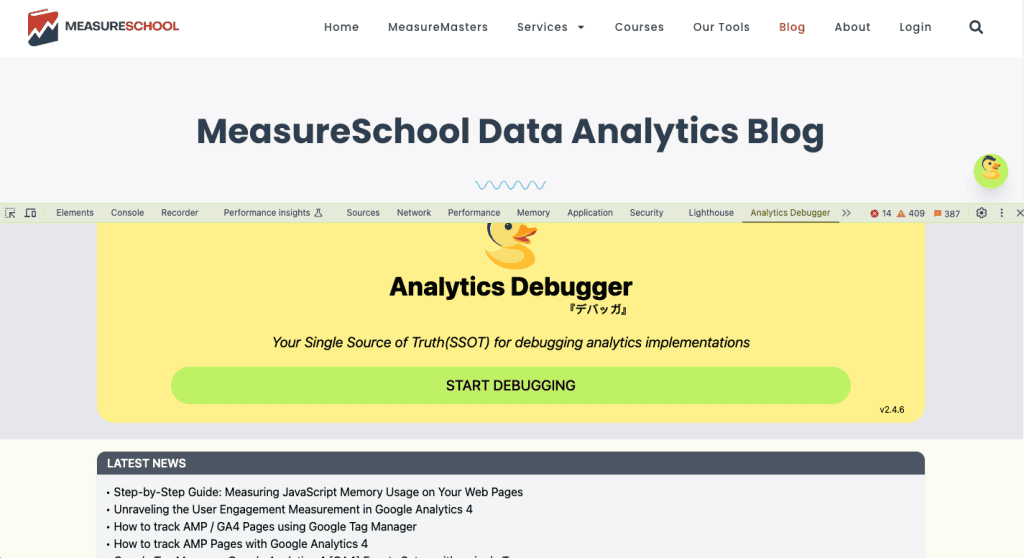
Once you click on the ‘Start Debugging’ button, it reloads the page and you can find it in the developer tools when it comes to seeing your GTM/GTAG and GA4 data.
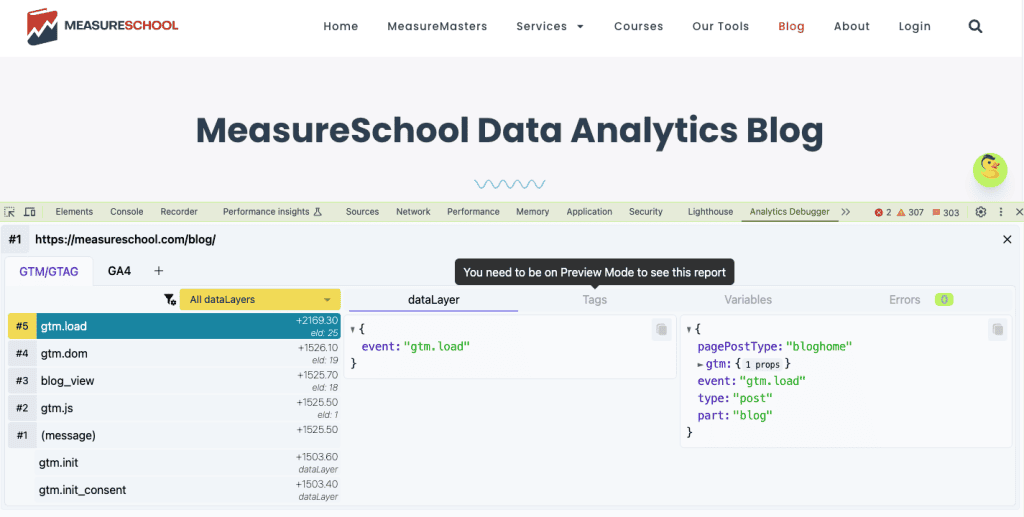
Here you can see GTM’s data layer messages and if you use it with GTM’s preview mode, you can also see what’s happening with tags, variables, and any errors.
However, generally, it’s convenient for most people to use GTM’s preview mode.
Its true power lies in reading the information in a clear format without going into your GTM or GA4 account. It can be used in conjunction.
If you move over to the GA4 tab, it gives you details on each page being fired along with other important information starting with an overview of that single event.
Some basic setup shows that at the top right corner, you can choose to clear the report and open settings. The coffee mug icon is there if you want to show some love to David by sponsoring a coffee.
Below, you have the page URL where the event(s) are happening in chronological order.
The report is further divided into two columns, where the left side shows all the events being sent to GA4 (or any other analytics tool), and the right side provides a lot of information about a specific event once it’s clicked on / selected from the left side.
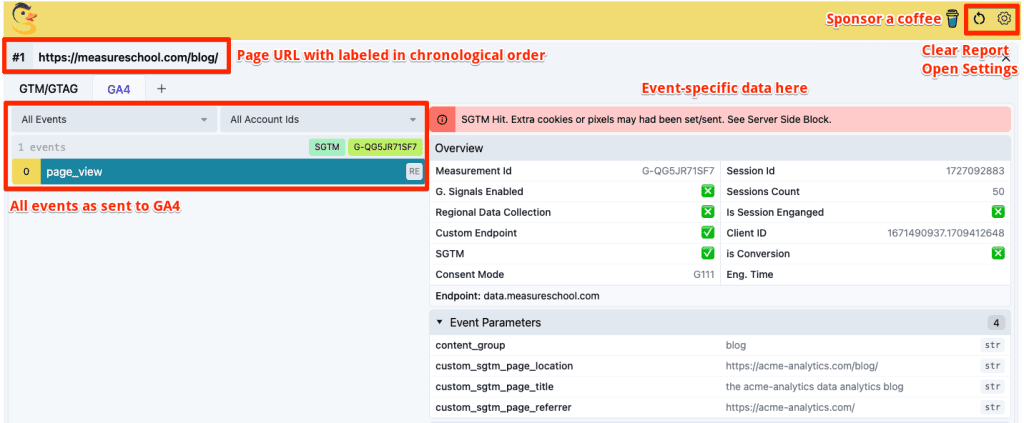
The left side shows the following information:
- Event names in chronological order
- GA4 measurement ID the event is being sent to
- Whether the hit is server-side or not, e.g., SGTM
- It also shows if the event is modeled by consent mode v2 by adding the letters ‘CM’ to the event (this happens when cookies are not accepted)
- You can also see if the event is one of the recommended ones with the letter ‘RE’ in front of it.
The right side gets a lot more specific for each event starting with an Overview and Event Parameters as shown in the screenshot above.
If you scroll further down, then you can see other details grouped under the following tabs:
- User Properties
- eCommerce Data
- Server Side Response
- Shared Parameters
- Server-side Parameters
- Raw Request Details
- Request Technical Details
These tabs can be collapsed or expanded.
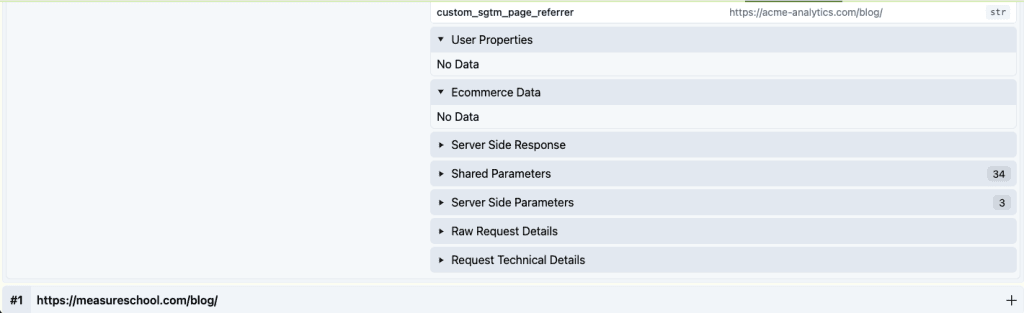
At the end, you can see the previous page and any data collected there. This makes debugging and seeing details about each event and page quite convenient.
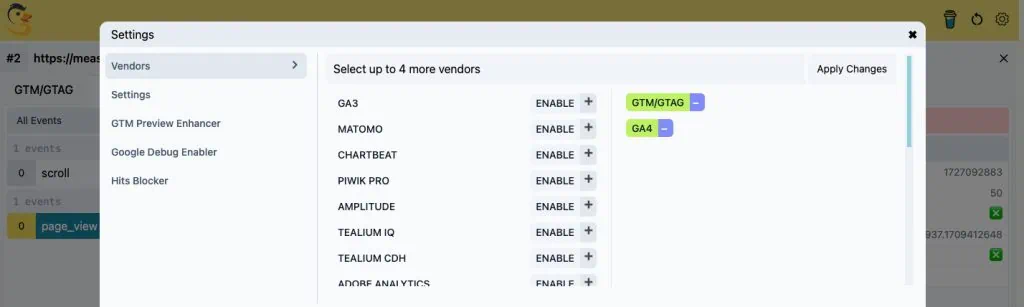
If you open the settings, you will see this screen where you can select vendors for which you want to see the data. It supports over 20 at the moment.
Other Settings are more display-specific.
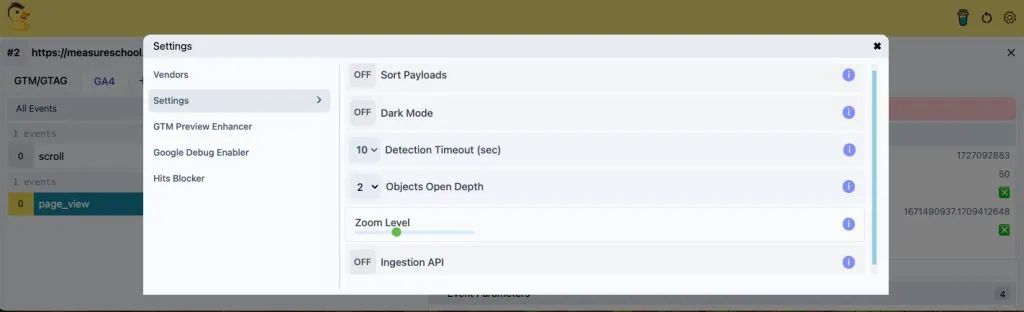
You can also choose to turn on GTM Preview Enhancer and Google Debug Enable, meaning when you enable that you can also see the data in the Console tab of developer tools and GA4’s DebugView, and if you want to block any hits to GA4 while you’re playing around.
Therefore, it’s quite a useful extension in your arsenal if you’re working with any of the tools it supports.
3. Adswerve dataLayer Inspector+
No list will be complete without Adswerve’s dataLayer Inspector+ extension, recently revamped with a new look.
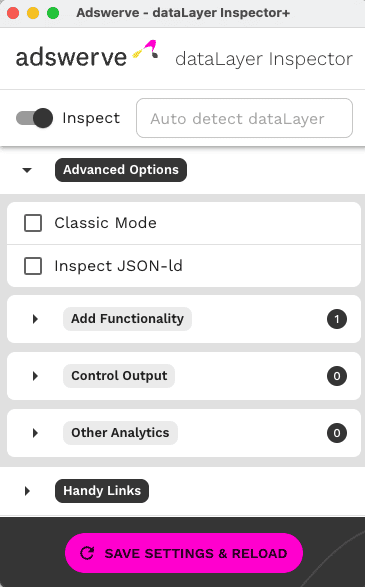
You can enable it on or off by toggling the Inspect switch at the top. Here are the status badges you can see when turned on/off and using other settings:
 – Turned off
- – Turned on
 – Turned on with Classic mode (no advanced functionality is available)
 – dataLayer.push is being used to push some event(s) for testing
 – GTM container is inserted on a website. It shows for all websites, not just on the site you’ve inserted the container on
 – Some custom code is inserted on a website
 – When multiple advanced functions are being used, you will see a + symbol in front of it or you can hover it to see which options are enabled
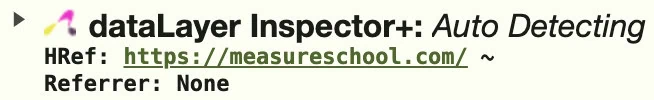
When enabled, you see a message on the Console tab of the developer tools that it’s ‘Auto Detecting.’
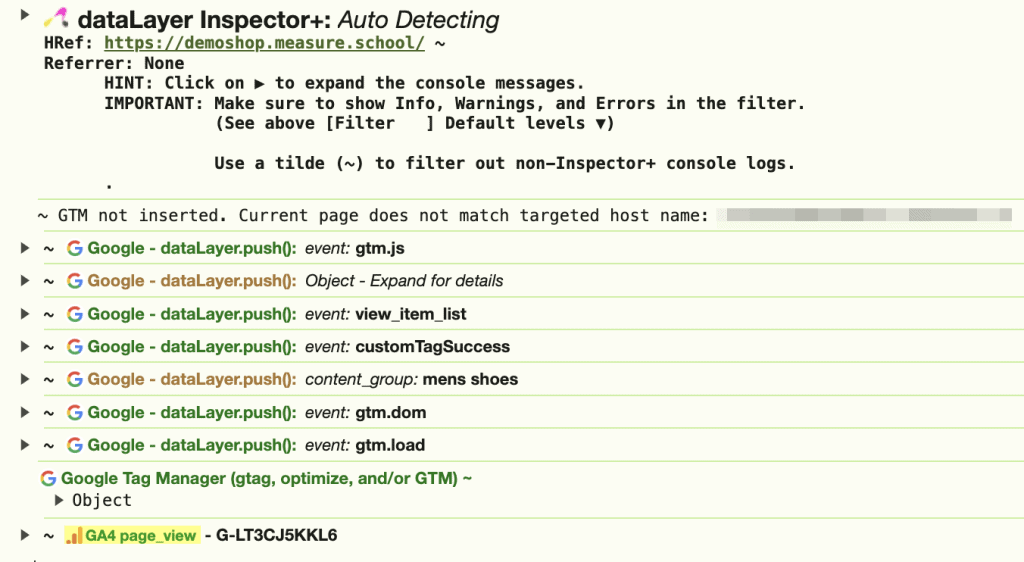
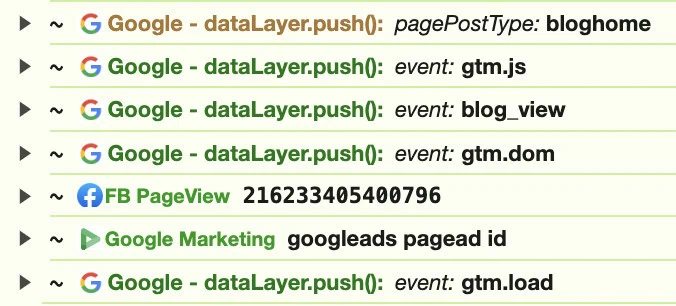
As the banner says, you can use a tilde ~ to filter events specific to Inspector+, which we’ve done in the above screenshot. Otherwise, it would get too crowded!
You can also see that it shows dataLayer messages and events being sent to GA4 highlighted in yellow.
The colors of the messages mean the following things:
- Green – Everything is good!
- Brown – It is a Notice, i.e., you should take action on it. You can click on it to see the details.

- Red – It’s bad and you should fix it. For instance, duplicate pageviews, dataLayer resets, etc. should be dealt with.
Let’s look at other features of this extension starting with the options under Add functionality.
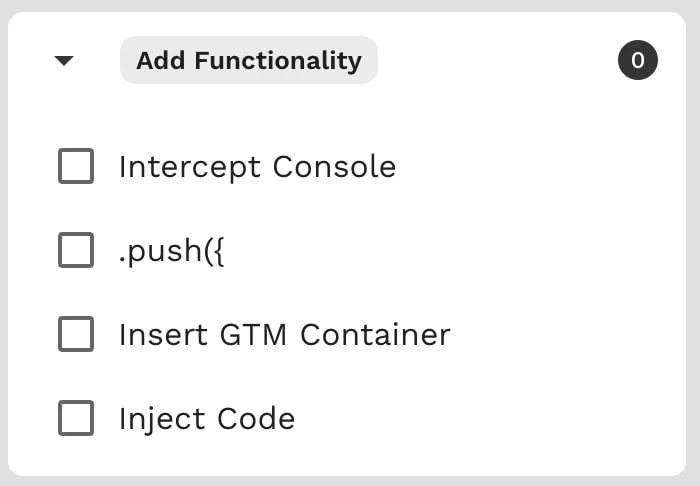
- Intercept Console – Allows Inspector+ when a site blocks console logging.
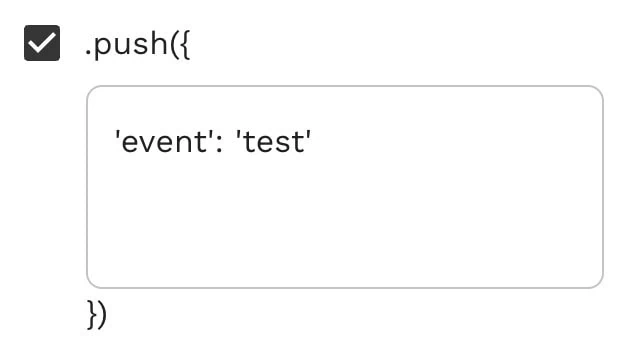
- .push({ – Takes care of the dataLayer wrapping; all you have to do is enter the event key and parameters.
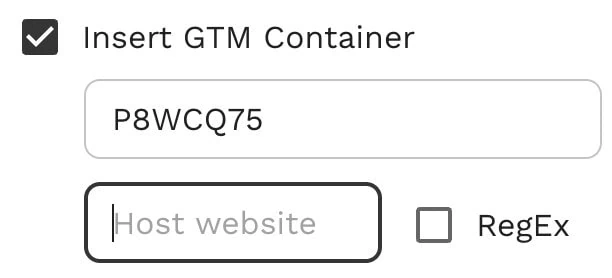
- Insert GTM Container – Enter GTM ID without the GTM- prefix and the hostname. You can also Regex when you want to enter the container on multiple sites.
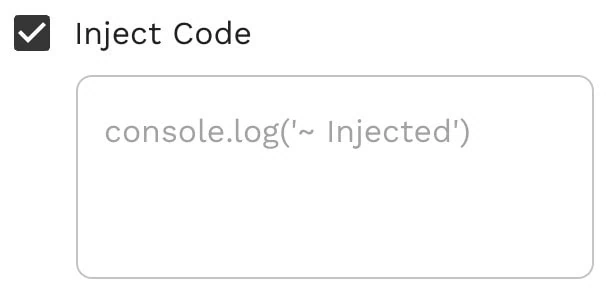
- Inject Code – Use this to add any code to the site.
Apart from this, you have the Control Output section that can be used to make changes to data that’s shown in the console tab.
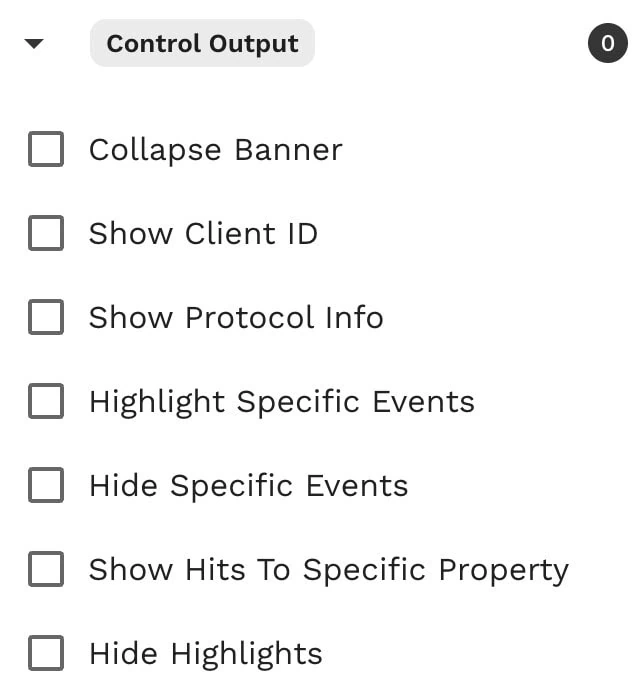
Here’s what they all do:
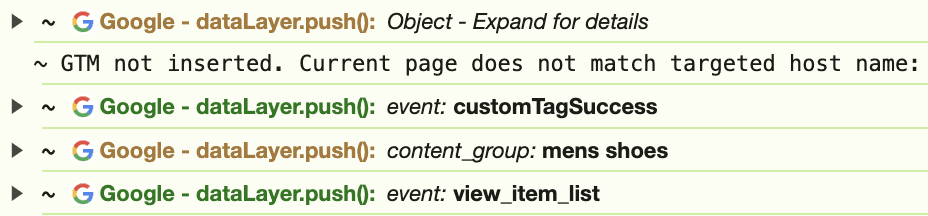
- Collapse Banner – Makes the banner shorter with less info. This is what it looks like after checking this option:
- Show Client ID – Shows the client ID along with your GA4 hits, e.g.

- Show Protocol Info – They haven’t been very clear about this feature. Their guide discusses adding CD names, but I couldn’t recreate that while writing this post.
- Highlight Specific Events – This lets you highlight any specific events you’re more interested in. You can use Regex to highlight multiple events.
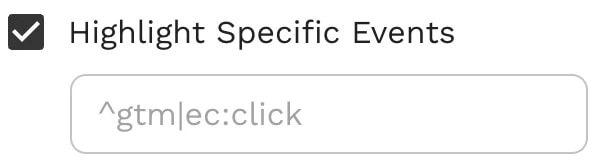
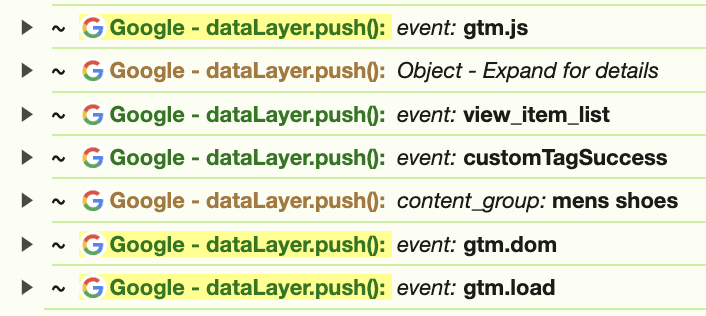
For instance, we want to see all events with GTM as you can see in the messages below:
- Hide Specific Events – Similar to the highlight specific events feature, this lets you hide events that might clutter up the console tab. Following the same example, we don’t see any GTM events in the console anymore.
- Show Hits to Specific Properties – If the events are doing to multiple properties, then you can filter out the properties that you want to see the data for.
- Hide Highlights – The yellow highlighted events like GA4 can be turned off with this setting as shown below.

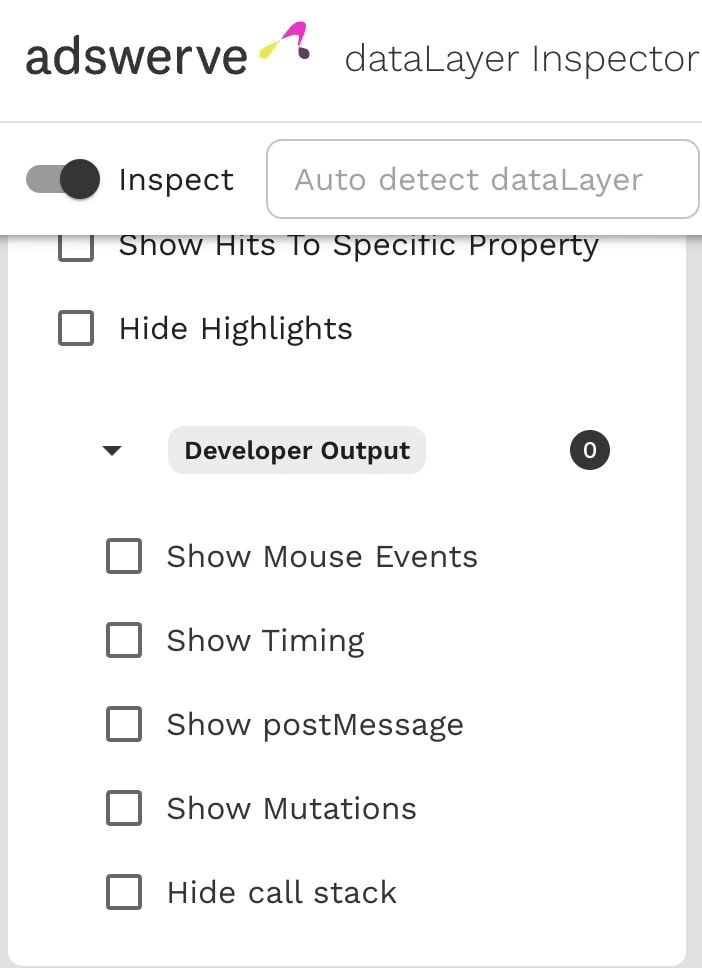
Within Control Output, there are also more options nested under Developer Output, should you need them for advanced testing or debugging.
The third tab about Other Analytics is for other tools or custom analytics solutions. You can enable and see messages for them, as well. These are:
- Google Marketing
- Tealium
- Adobe_satellite
- Adobe Analytics
- Segment
- GTM Server-side – It shows you hits for all server-side tracking. But, it has a cool option where you can choose the specific server domain and it will show only hits for that.
- Custom Analytics
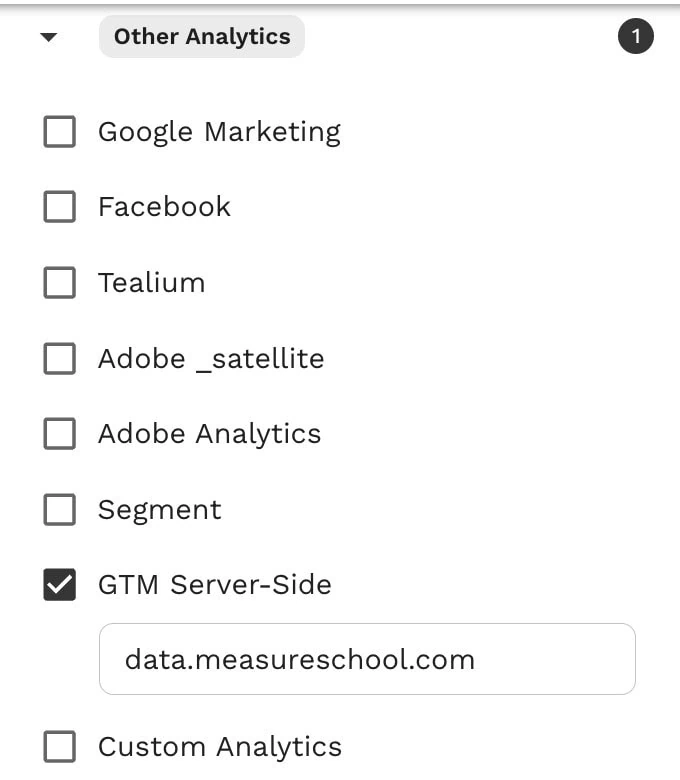
For instance, enabling Google Marketing and Facebook shows messages for those hits as well.
Hopefully, this helps you to understand why it’s a very useful and comprehensive extension to have.
4. TagHound – Analytics/GTM/Pixel Debugger
This extension covers hits to analytics and other platforms.
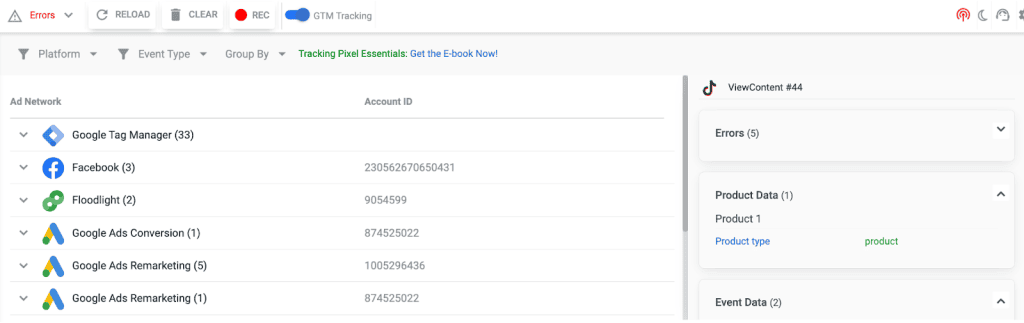
Its UI also makes it easier to navigate where you can filter the data by platform or event type (pageview, conversion, etc.), as well as choose how to group the events, i.e., by Network (vendor), Event type, or have a flat table.
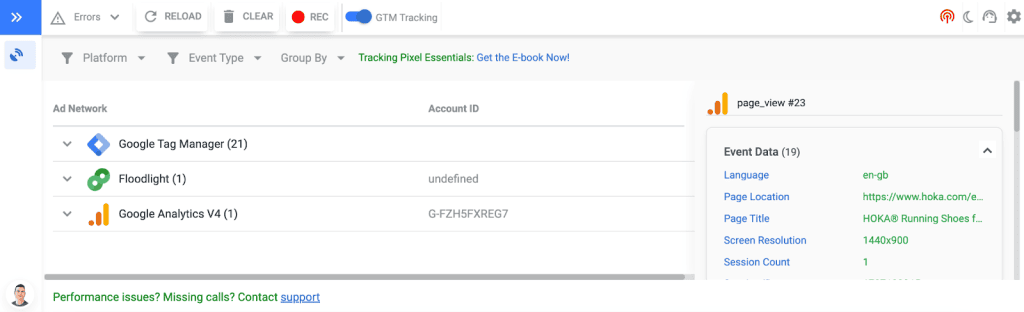
You can also view more details on events or any errors about specific events on the right side. The ‘Errors’ drop-down at the top is highlighted in red when there are any errors.
If you click on the GTM events, you can view any dataLayer updates.
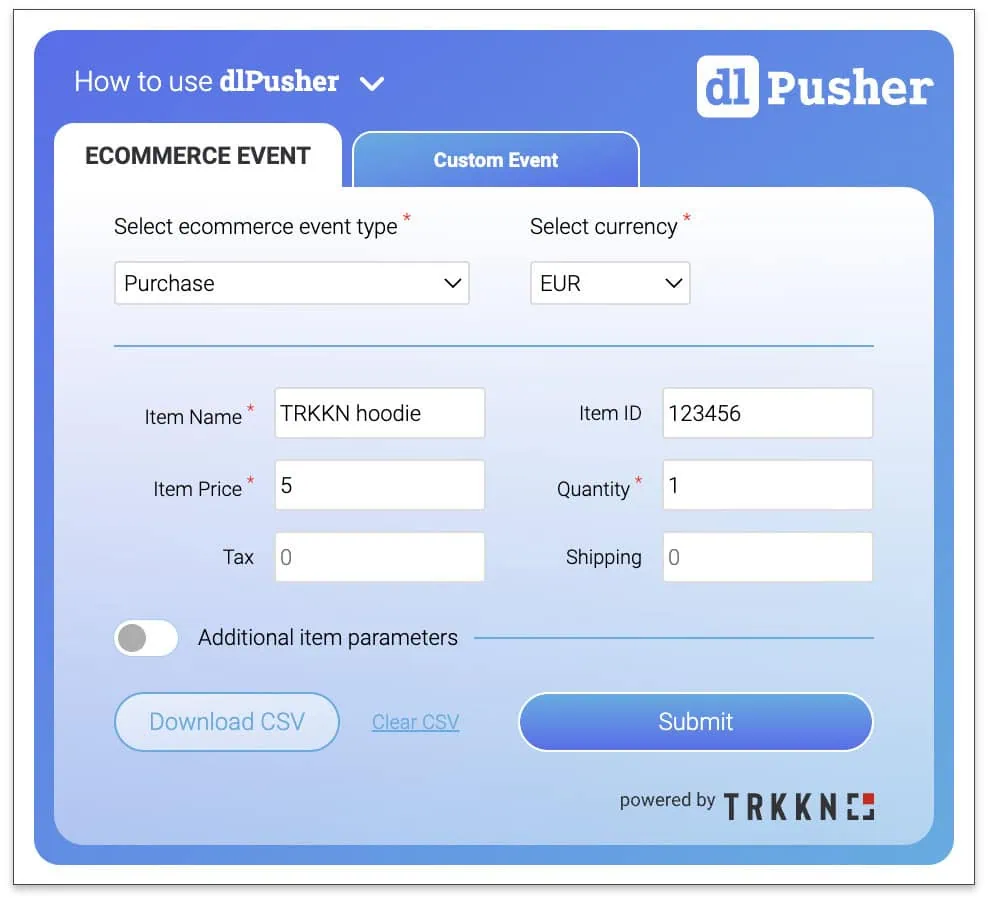
5. dlPusher
This is a simple extension with a clean interface that lets you push dataLayer from pre-made eCommerce events or a custom one, as well as add any additional parameters you want.
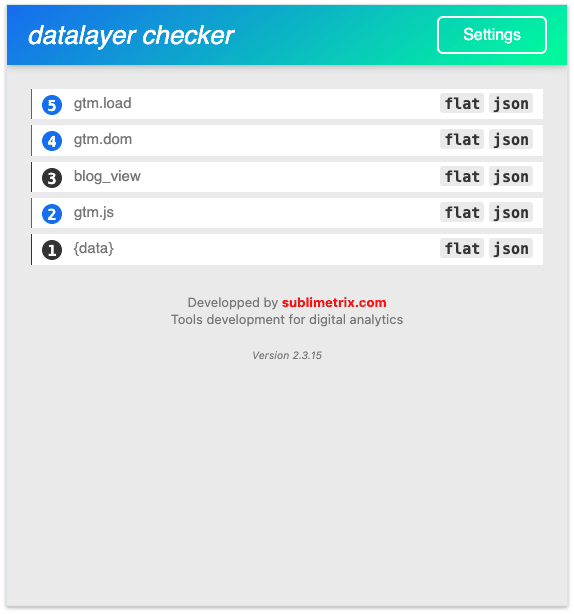
6. Datalayer Checker
Another simple extension that lets you view dataLayer pushes on a page in a nicely organized and colored format.
You can view the data in a flat table or JSON format. The flat table would look like this:
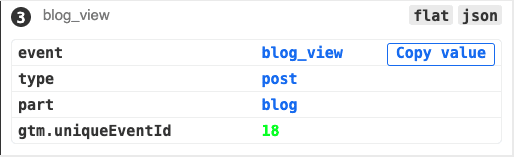
If you hover over events and values, you can also copy them. Here’s what JSON would look like:
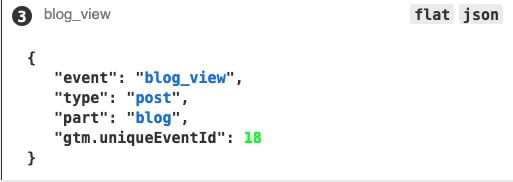
With JSON format, you cannot copy keys and values when you hover over them, but you can use the old way of copy-pasting by highlighting a text.
Other Useful Extensions
These extensions can be helpful when debugging and tracking outside GTM yet in its context.
7. Redirect Path
Losing URL parameters like UTMs and GA4’s cross-domain _ga values could mean your tracking and data will suffer from attribution issues.
This extension lets you see what happens with your page’s redirect in the background, which you cannot see with GTM.
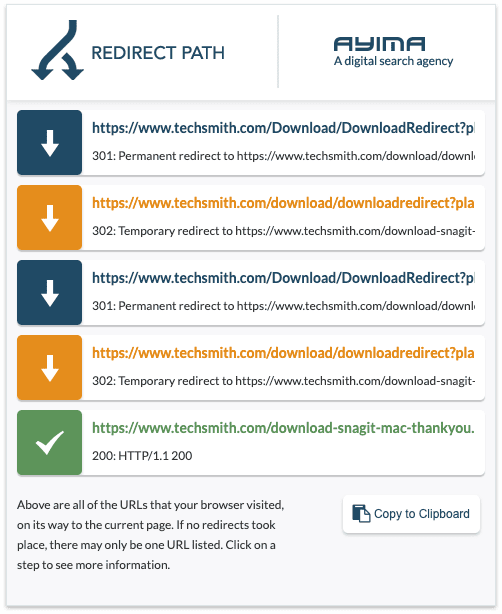
All you have to do is navigate from one page to another and click the extension icon. It will show you all the URLs that your browser visits before reaching the current page. Pretty handy, no?
While you can copy all the URLs, click on the individual redirects and get more info.
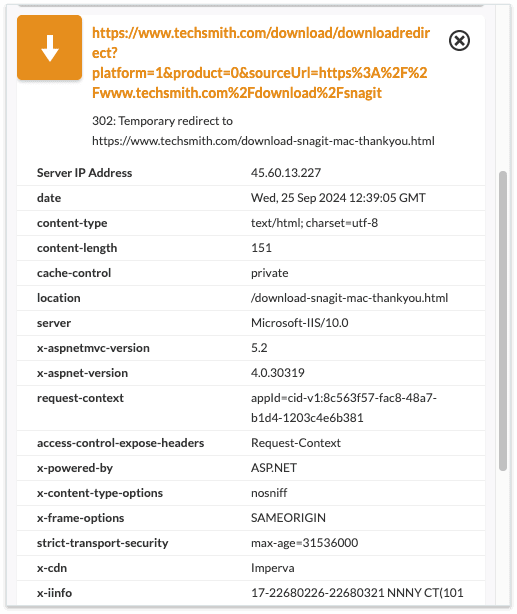
This way you’d know if you’re losing any important parameters along the way and talk to the devs about fixing them because again, you cannot solve that with GTM.
8. Clear Cache
It lets you clear your cache with just one click. You can choose your cache clear settings and it will work like a charm.
You can also customize it to fire for the active tab or all tabs and the time frame for data removal. Additionally, you can choose to delete cookies, and local storage among other data types.
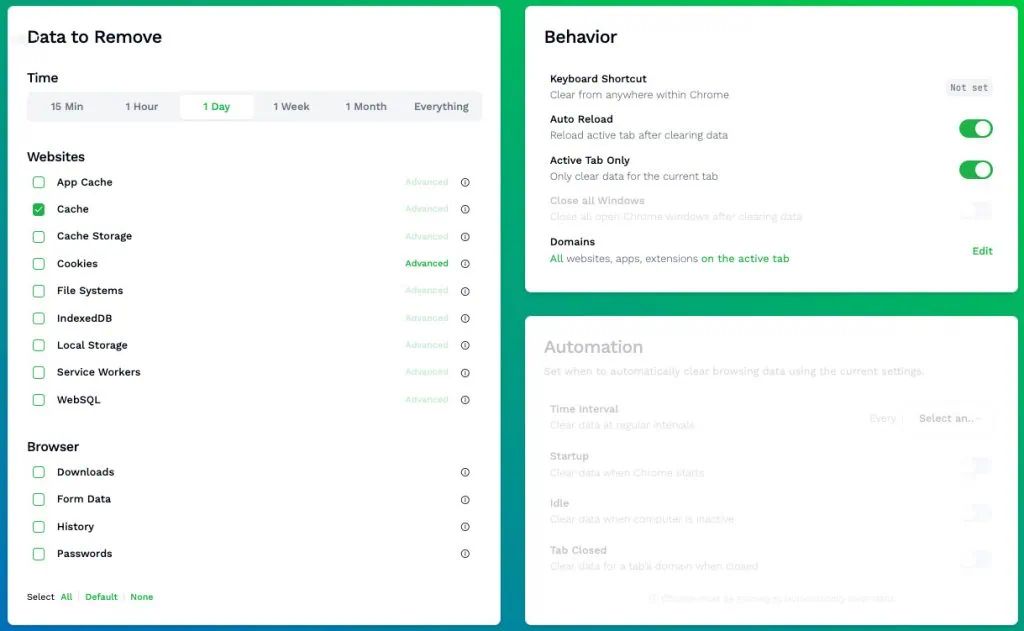
Perhaps the better way is to assign a keyboard shortcut to it and apply it to Active Tab only when you’re testing things.
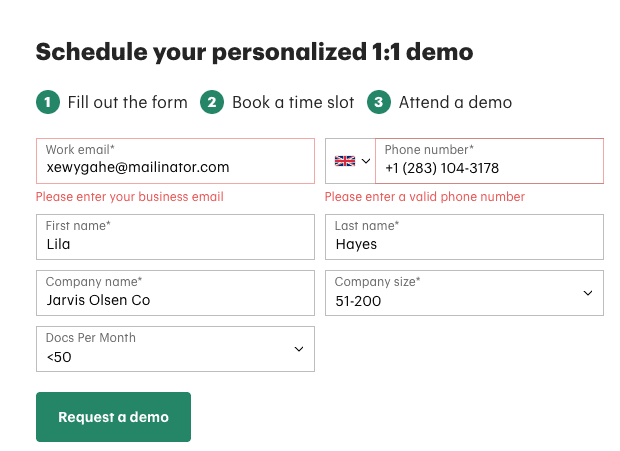
9. Fake Filler
This is quite a time-saver when filling long forms multiple times when you’re testing your tracking setup or simply debugging, as it fills up all the fields for you with two clicks.
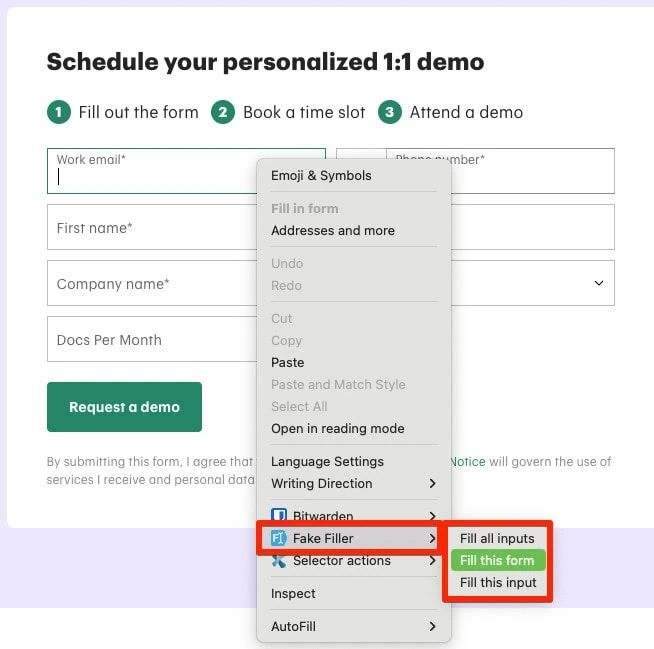
Once you choose the filling option, it automatically populates the fields and by default uses US phone numbers and mailinator as the email hostname. But, the good thing is you can change those settings to suit your needs.
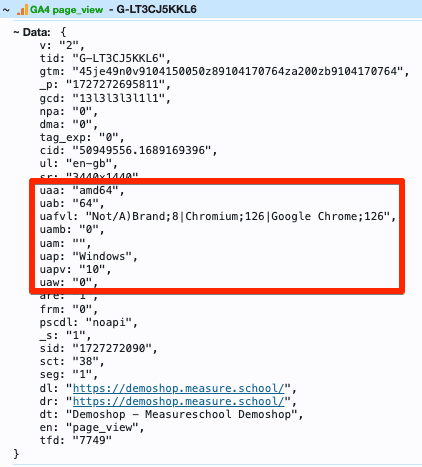
10. User-Agent Switcher and Manager
This could come in handy if you see weird data or certain types of errors from specific devices / operating systems. You can then switch to that user agent to recreate the scenario and determine what is happening.
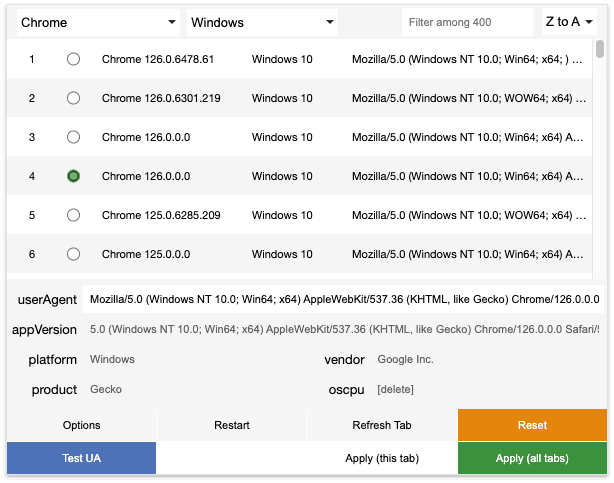
See below how chosen settings are sent with GA4’s page view event.
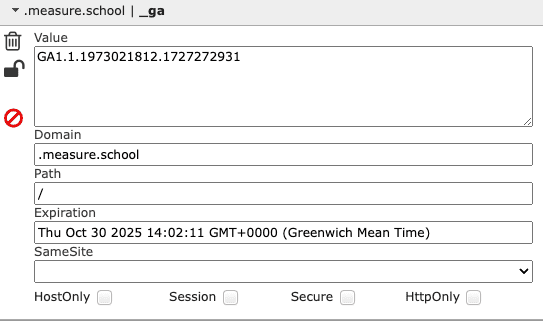
11. Edit This Cookie
This extension shows you all the cookies set in an easy-to-read format and you can edit, delete, or add any new cookies, as well as test things.
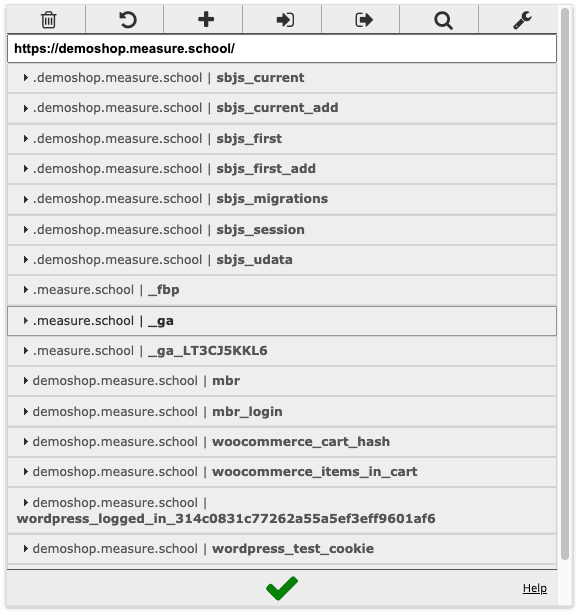
You can expand each cookie and find more details about it, as well as edit it.
Let’s move on to extensions for ad pixels.
Bonus: Extensions for Ad Pixels
While extensions like Adswerve’s Inspect+ and TagHound allow you to see what is being sent to different platforms, you can still complement that with the vendors’ extensions.
So, we won’t consider the list below as different extensions because they all fall in one category, i.e., pixels, and which one you use completely depends on which ad platform you’re using or debugging.
- Meta Pixel Helper – It shows you the base pixel code and any additional information sent to Meta along with the setup method.
- UET Tag Helper – This can be used for debugging events for Bing aka Microsoft Ads.
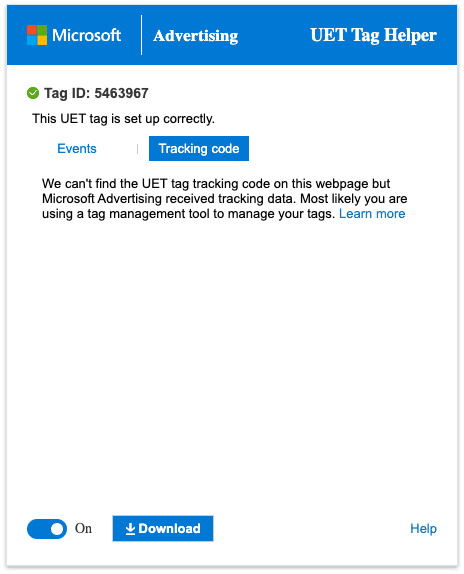
You see, there’s a pattern here: a vendor-specific pixel helper extension showing you whether the pixel code is installed properly and if any events are being sent to that pixel along with any other details (parameters).
Some other popular pixels are as follows:
- Twitter Pixel Helper
- Snap Pixel Helper
- TikTok Pixel Helper
- Pinterest Tag Helper
- Reddit Pixel Helper
- Taboola Pixel Helper
- LinkedIn Pixel Helper (Unofficial)
Do you need all of them? Perhaps not.
However, when you’re debugging tracking setup for a specific vendor, it helps to have their extension, even though there are extensions that show you what info is being sent to a vendor.
Summary
We know browser extensions can be handy, especially with tools like GTM. There is a myriad of Google Tag Manager extensions out, there but our post focused on the top 11 ones based on their use cases.
We started by looking at 6 extensions related to GTM, GA4, and the dataLayer as they are the core of GTM.
While doing so, we explored the Analytics Debugger and the Inpsector+ extensions in depth to show you their full potential. So, if you use them right, you might not even need a few others.
We then looked at the other useful extensions that can help us do certain mundane or even tricky tasks, like finding the redirect path easily when working with GTM. Our favorite is the Fake Filler; it’s simple yet so effective.
Lastly, we looked at the pixel helper extensions category where almost all major ad platforms have extensions to help you verify installation and see what events are being sent to them.
Which one you use depends on the platform you’re working with.
To make the most out of extensions, the best thing is to read their documentation or watch any videos the creators upload.
If you’re working online, there’s a very high chance your marketing efforts include email marketing. Check out our post on Google Analytics 4 Email Tracking to track your email marketing campaigns!
So, what are your favorite Google Tag Manager extensions and how do they help you? Let us know in the comments below!
Sign up to the FREE GTM for Beginners Course...


")
Thanks for mentioning TagHound 🙂