Google Analytics 4 demographics reports help you gain in-depth information about users’ language, interests, location, age, and gender.
Suppose you’re curious about how GA4 gathers demographic data and how you can use it in marketing.
In this case, our guide will explain the process and show you how to gain valuable insights to understand your visitors and improve your campaigns.
We’ll cover:
- How Does GA4 Collect Demographics Data?
- How to See Demographics in GA4
- How to Enable Demographics in Google Analytics 4
- How Accurate Is Google Analytics Demographics?
- How To Create A Custom Report in Explorations
- How To Analyze Google Analytics 4 Demographics Reports
- Why Is GA4 Not Collecting Demographic Data?
Let’s dive in!
How Does GA4 Collect Demographics Data?
Google Analytics 4 (GA4) uses IP addresses to determine a user’s location, such as country and city. There is nothing to set up on your end, as dimensions like country are populated automatically by default.
GA4 uses IP addresses to estimate a user’s location. It uses coarse geo-location to obfuscate the user’s true position while providing a more general view of their location to protect user privacy.
This applies to data like country, city, and even latitude and longitude.
GA4 never stores or logs IP addresses in any data center or server. Once the location is determined, the IP address is promptly disposed of to ensure privacy.
How to See Demographics in GA4?
🚨Note: We will first show you what a GA4 Demographics report looks like using the Google Analytics demo account. However, to enable this report completely (to see age, gender, and interest) in your account, you must first activate Google Signals, which we’ll cover later.
Demographics Report Example
This is an example of demographic data in the User attributes overview.
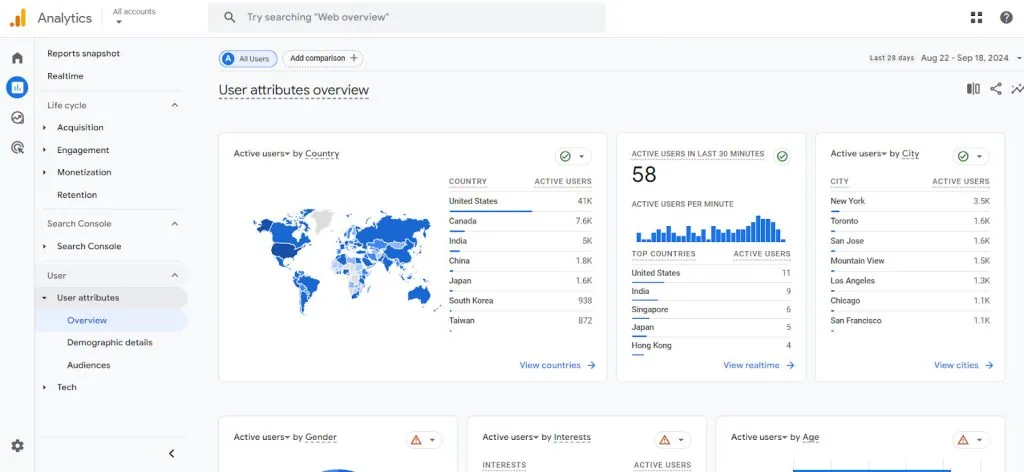
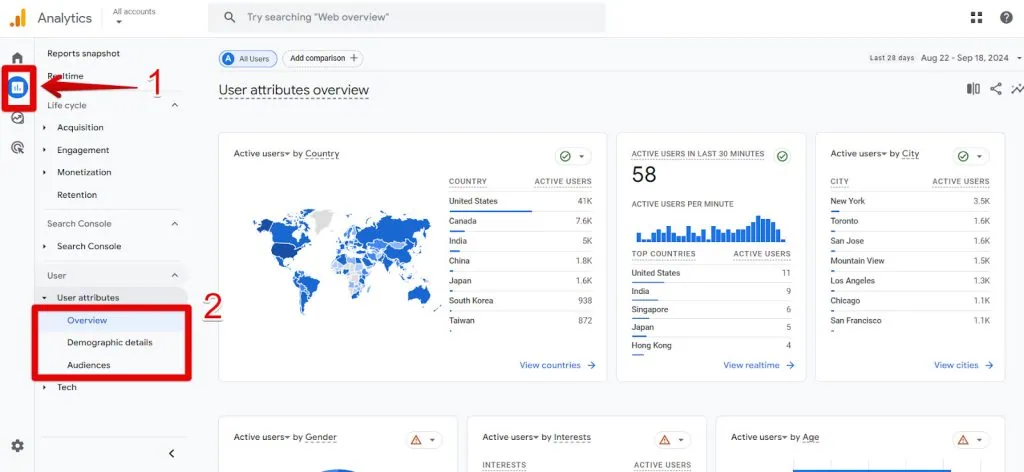
To see what a Demographics report looks like:
- In the navigation, select Reports.
- Select any of the reports under User attributes, for example, Overview.
How to Enable Demographics in Google Analytics 4
In addition to regional data, Google Analytics 4 demographics reports offer information on three key user attributes: age, gender, and interest categories.
To access these additional insights in your reports, you need to activate Google signals. Language is also included, but it is derived from the user’s browser or device setting and not from Google signals.
What Is Google Signals?
Enabling Google signals allows more advanced tracking features such as cross-device remarketing and key event exports to Google Ads.
Cross-device remarketing allows you to show ads to users across different devices. For example, if someone visits your website on their desktop but doesn’t complete a purchase, you can later show them a reminder ad on their phone or tablet.
This functionality relies on data from users signed in to their Google accounts and enabled ad personalization.
Cross-device key events exports refer to tracking important actions (such as purchases, form submissions, or resource downloads) across different devices.
If you enable data sharing, these key events or conversions are shared between Google Analytics and linked advertising platforms, like Google Ads. This allows you to target these users more effectively in your advertising campaigns.
Once Google Signals is activated, you’ll be able to use these advanced marketing features and gain access to the additional demographics data we mentioned earlier.
Essentially, Google Signals collects session data from sites and apps associated with users who are signed in to their Google accounts and have ads personalization enabled.
This data is aggregated and used for reporting, without compromising individual privacy.
To learn more about Google signals, see our short Google Signals Explained (In-Depth Guide).
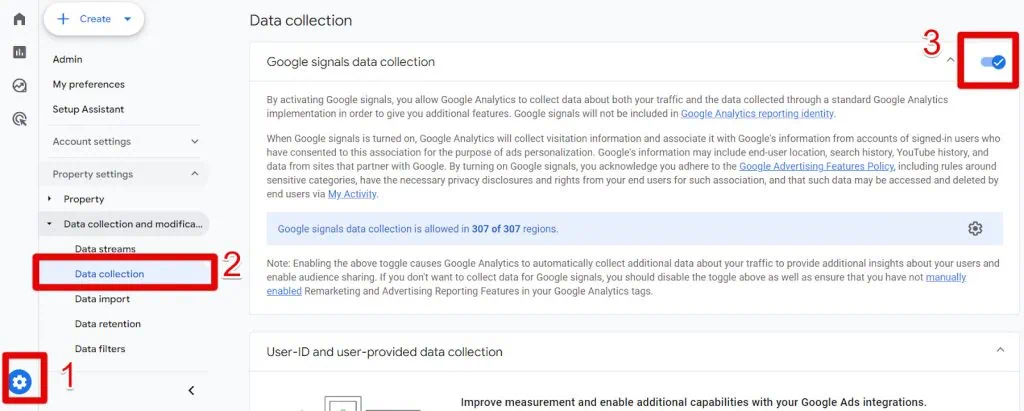
How To Activate Google Signals
To activate Google signals:
- Go to Admin.
- In Property Settings, click Data Collection.
- Turn on Google Signals.
How Accurate are Google Analytics Demographics
Google Analytics 4 demographics reports provide a good overview of your users’ locations (region), languages, and interests. However, you shouldn’t expect 100% accuracy due to several key factors:
- IP-based Location Data: Regional data in GA4 is derived from users’ IP addresses, meaning it reflects the location of their devices. However, users may be using VPNs, which can show a different country or region than where they are physically located. Additionally, the location data is based on coarse geo-location, which estimates a user’s location rather than providing an exact pinpoint of where they are.
- Google Signals Criteria: When Google Signals is enabled, the demographic data you see in the reports, such as age, gender, and interests, is aggregated. This means you’re looking at summarized data, not raw individual data. Furthermore, this information is only available from users who have consented and are signed into their Google accounts. If users don’t meet these criteria, their demographic data will not be included.
- Data Thresholds: Google Analytics applies data thresholds to protect user privacy. If your website doesn’t receive enough traffic, GA4 may limit the data available in reports and explorations. This prevents identifying individual users based on demographics like age, gender, or location. The thresholds ensure that sensitive information is not exposed by preventing users from concluding individuals when there is insufficient data to protect their privacy effectively.
To work around thresholds, you can increase the date range in your reports to get a more complete view of your audience. However, it’s important to note that these thresholds cannot be removed entirely.
How To Create A Custom Report in Explorations
With Explorations, you can customize your reports far more than with standard reports. This is not only due to the various techniques and visualizations available but also because you can access dimensions not available in standard reports.
Let’s take an example:
I want a report that shows me the Total revenue by the subcontinent. I’d also like to visualize this in a bubble map (similar to the one you see in the Real-time report).
To do so:
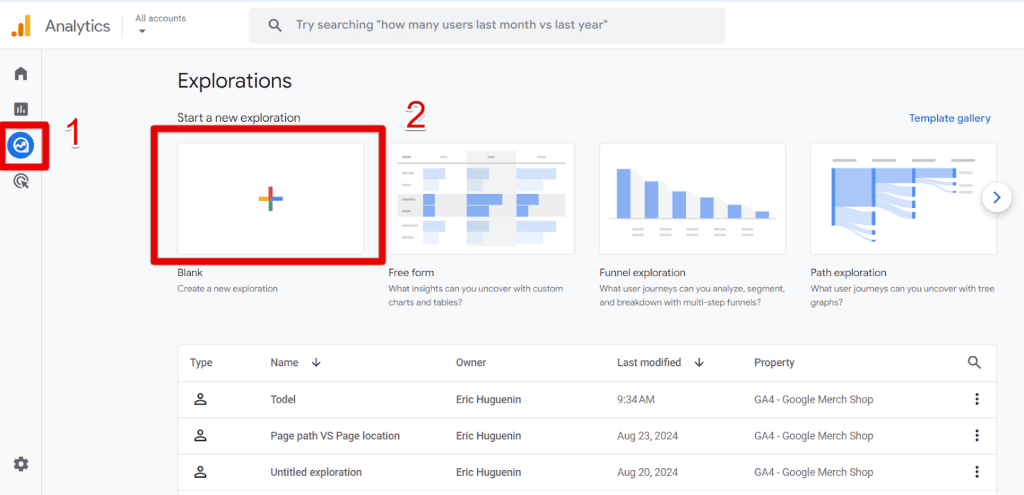
- Click Explore in the left navigation.
- Click the card with the plus + sign to start a new exploration.
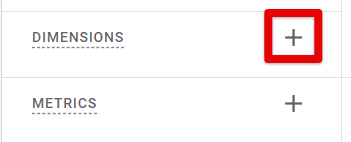
- Click the + beside Dimensions.
- In the search bar, type Subcontinent and select it in the list.
- Click Import.

- Repeat the same for Metrics, and add Total revenue.
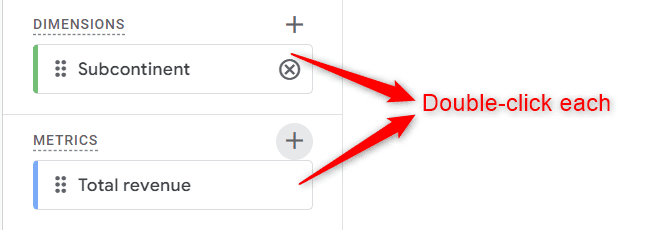
- Double-click Subcontinent and Total Revenue to add them to your report.
- Select Geo map in Visualization.

Your report should look like this one:

How To Analyze Google Analytics 4 Demographics Reports
When analyzing demographic data in GA4, you’ll primarily spend your time in the User Attributes section, which contains three key reports: the Overview, Demographics Details, and Audience reports.
You’ll use these main reports to gain insights into your audience.
All three reports can be found in the User Attributes section. To find them,
- Go to Reports.
- Go to User attributes in the User section.

The Overview report provides a high-level summary of your demographics. You can quickly spot useful insights here, such as the top countries driving traffic or even more granular data like cities.
If something stands out, such as a particular region, gender, or other user attributes, you can click on any cards to dive deeper into the data.
For example, clicking View cities in the Active users by Country will take you to the Demographics Details report, but will focus on country data.

In the Demographics Details report, you’ll see all the data displayed in a table format. Here, you can analyze deeper by identifying which cities have the most engaged sessions or contribute the most to your key events.

Additionally, you can refine your analysis further by adding a secondary dimension. For instance, you can click the plus sign and add Age to see how various age groups perform in many countries.
To do so:
- Click the plus sign +.
- Click Demographics.
- Select Age.

This should be your final result:

This approach allows you to identify patterns, trends, and opportunities across different demographics, helping you make more informed decisions for your business.
Why Is GA4 Not Collecting Demographic Data?
GA4 may not collect demographic data for at least 8 reasons.
Most of these are often technical issues that are relatively simple to fix. First, you need to be able to identify them. Beyond technical issues, the challenge may be finding strategies to increase traffic volume.
Most of the time, regional data will appear, but it is often the age, gender, and interest demographics that fail to show up.

Sometimes no demographic data appears, while in other cases, the data is only partially displayed, with certain regions missing from the reports.
The lack of demographic data is understandable for websites with low traffic, but it’s more puzzling when it happens to sites with high traffic.
Why You Don’t See Demographics Data
Here are 8 reasons why you may not see demographic data:
1. Server-side tagging
Sometimes the outgoing HTTP request to the Google Analytics server is sending the IP address with invalid characters and needs to be overridden with the correct ones.
Also, in the Client details in GTM preview mode, if the Region doesn’t have a country code, shows undefined, or is empty, then you need to send specific request headers that contain the user’s region information.
2. Analytics and Ads-blocker extensions
Make sure to turn these off.
🚨Note: Especially for some ad-blockers, unpinning them or turning them off from the toolbar is insufficient. You need to turn them off from within the Manage Extensions section.
Like so:

3. Google signals not activated
Go to Admin → Data collection and modification → Data collection.
Turn on Google signals if it’s not enabled.

4. Wait for reports to populate
Report delays are to be expected and this is especially true with new implementations. If you’ve just configured GA4, you’ll need to wait 24-48 hours and even more, if you have low traffic.
5. Filters
Check to see if there are any filters in place blocking a country or a specific city. Sometimes, you may be in charge of an account with multiple properties created for different country segments.
6. Regions allowed
Go to Admin → Data collection and modification → Data collection.
If Google Signals is turned on, check if the number of regions allowed in Google Signals matches.
For example, if you see Google signals data collection is allowed in 300 of 307, this means you need to click the settings icon and enable these regions.

On the same page, do the same for Granular location and device data. Scroll at the bottom. Expand the section and check if the number of allowed regions matches.

7. Sampling
The usual fix is to increase the date range.
8. Threshold
Hovering over the warning signs in your reports can help you determine if thresholding was applied.
There’s not much you can do about thresholds, except work on increasing traffic to your website. You can use ads to help with this, as driving traffic through platforms like Facebook Ads can be cost-effective.
However, it’s important not to rely on a single channel for ads. Instead, diversify your efforts by reviewing your traffic sources to identify which channels present growth opportunities, and apply tailored growth strategies to each.

Summary
We’ve covered in detail how demographic data appears in GA4 and how to use, create, and analyze the various Google Analytics 4 demographics reports.
As previously discussed, sometimes some demographic data may be missing. While geo-location data occasionally goes missing, it’s typically the age, gender, and interest demographics that are absent.
We’ve explored different methods to help you resolve these issues.
We haven’t covered the audiences you can create from demographic data and easily share with platforms like DV360, Search 360, and Google Ads.
For that, check out our Definitive Guide to Google Analytics 4 Audiences, which explains precisely how to do this.
Do you have any other interesting methods to share regarding using Google Analytics 4 demographics reports? Let us know!


