Last Modified on January 18, 2024
Google Analytics 4 (GA4) has introduced amazing features, one of which is the built-in scroll tracking that wasn’t available in the previous versions.
When enabled, it can help you recognize how far a user has scrolled on a web page and you can use this information to improve the user experience.
Tracking scrolls works well for informational or long-form content websites as it provides more details on how the content is being digested.
Although easy to set up with GA4, you will need to understand how it fits into your landing page strategy before enabling the default feature.
We’ll cover the following:
Let’s jump right in!
What Is GA4 Scroll Tracking?
Scroll tracking is a way to measure how much of a given web page has been viewed and scrolled, either horizontally or vertically.
This helps you understand how a user moves about your website, allowing you to see the underlying trends of the user experience.
How Do You Implement Scroll Tracking?
The most common way to track scrolling is by using a tag management tool like Google Tag Manager and creating a scroll event. With this method, the distance scrolled by users can be translated into percentages (there are two ways to go about it in GTM).
The other approach (the easiest, but not the most insightful) is to simply click the toggle button in GA4 that enables scroll tracking.
This is a part of GA4’s Enhanced measurement which comprises interactions, commonly tracked in digital marketing such as outbound clicks and file downloads. Google Analytics facilitated their tracking without the need to code or additional setups.
🚨 Note: The issue with this method is that it only provides a limited scroll depth information of 90%. No other percentages are tracked, which means that the percent scroll dimension is populated only when a user reaches 90% of the page.
Set Scroll Depth in Google Tag Manager
To follow along, you’ll need to have GA4 installed on your site through Google Tag Manager. If you don’t have it in place, you can read our blog on how to install GA4 with Google Tag Manager.
Since you’re going to customize the scroll tracking default settings of 90% with your threshold, you’ll first need to disable it in GA4.
To do so, go to Admin → Data Streams → Web Data Streams.
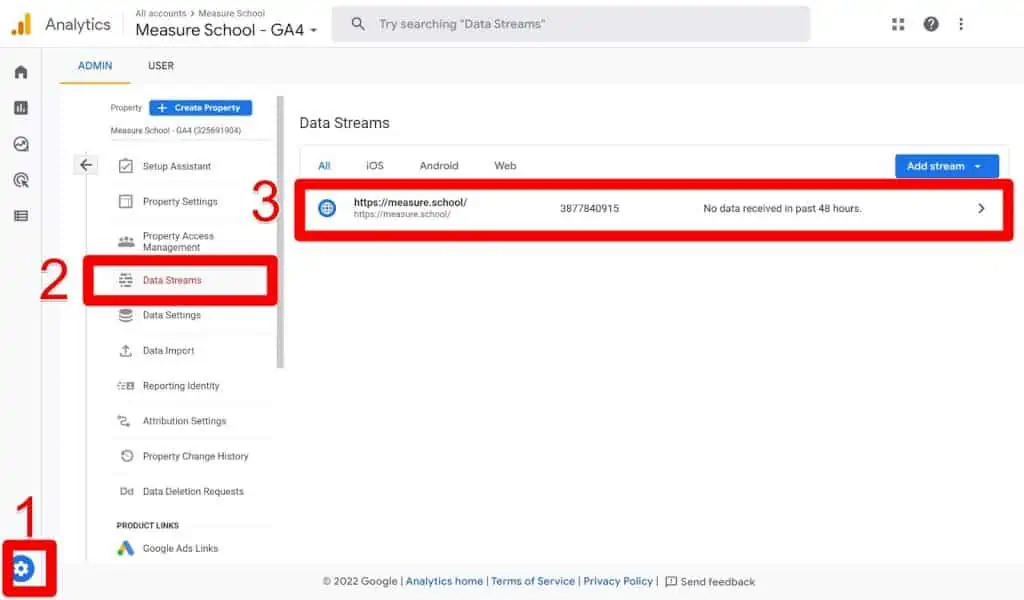
Under Events, click on the settings icon in Enhanced measurement.
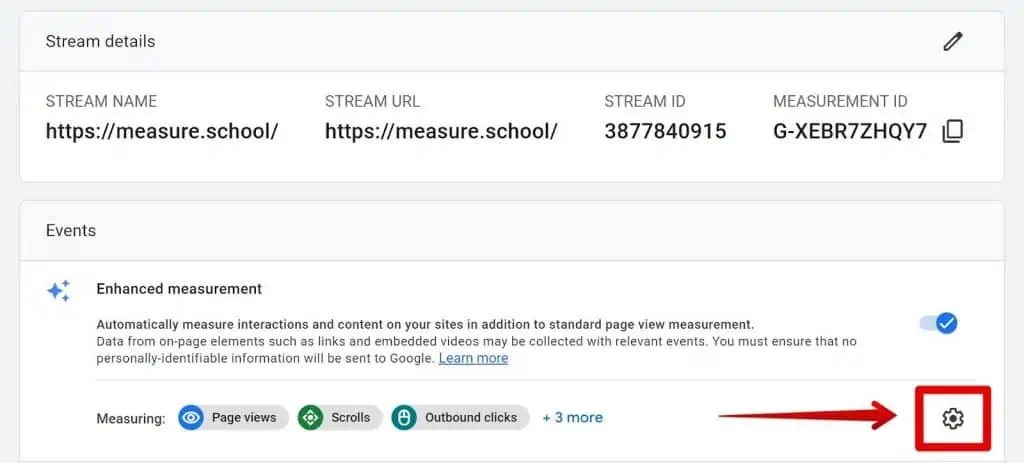
In the Scrolls area, disable the button and click Save.

You are now ready to go to Google Tag Manager and configure scroll tracking from there.
First, you need to make sure that the scroll details can be used by your triggers and tags, and are then sent to Google Analytics.
Starting from the left side of your workspace, select Variables, then Configure.

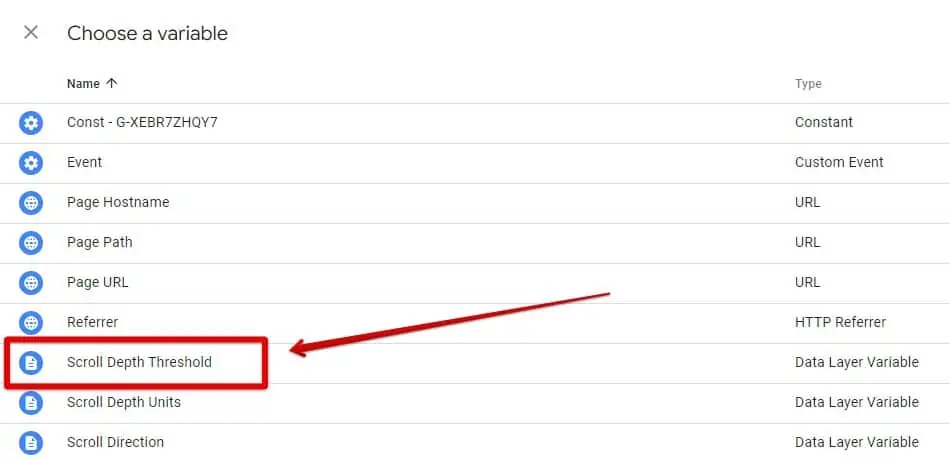
In Configure Built-In Variables, you will find the Scrolling section near the bottom. Select Scroll Depth Threshold.
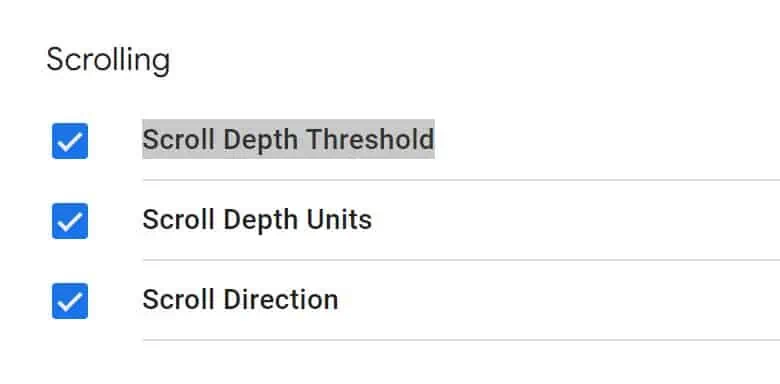
Feel free to select other details such as Scroll Depth Units or Scroll direction.
Selecting them all won’t affect your data. The Scroll Depth Threshold is sufficient for what we’re trying to achieve.
Now, let’s create a scroll trigger in Google Tag Manager by following these steps:
Go to Triggers → News → Trigger Configuration → Scroll Depth.
This is what your configuration will look like:

Generally, this percentage configuration should work, but many websites are different in design and content. The threshold of 25% percent is common because 10% may often be too short and misleading, especially when a large banner is occupying your page.
Moreover, the threshold of 90% usually reflects the bottom of a page’s content since the last 10% is probably the footer. However, for the footer-less pages, a 100% threshold makes sense.
You can quickly test your trigger by enabling Google Tag Manager’s preview mode and scrolling down to the bottom of the page. On the left side of the Preview Mode panel, you will see scroll depths events for each of the percentages you’ve set.
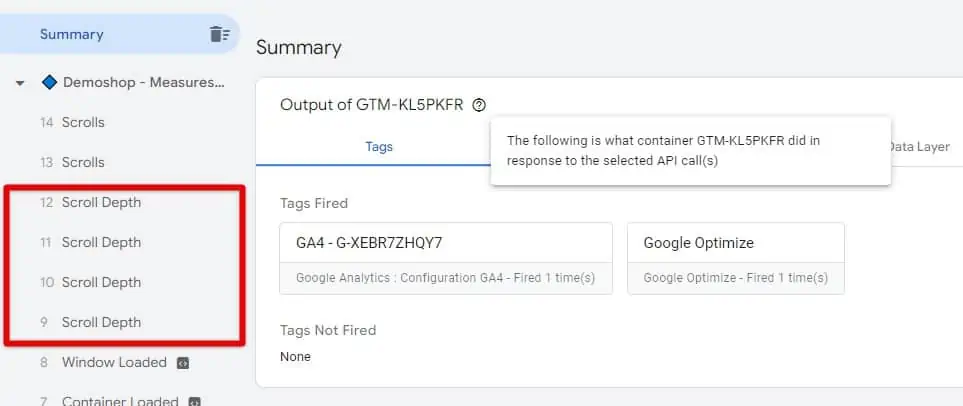
To send this data to Google Analytics, you’ll need to create a tag. In your Google Tag Manager workspace, click Tag in the left navigation bar, then follow this sequence:
Tags → New → Tag Configuration → Google Analytics: GA4 Events
Here’s what your tag will look like:
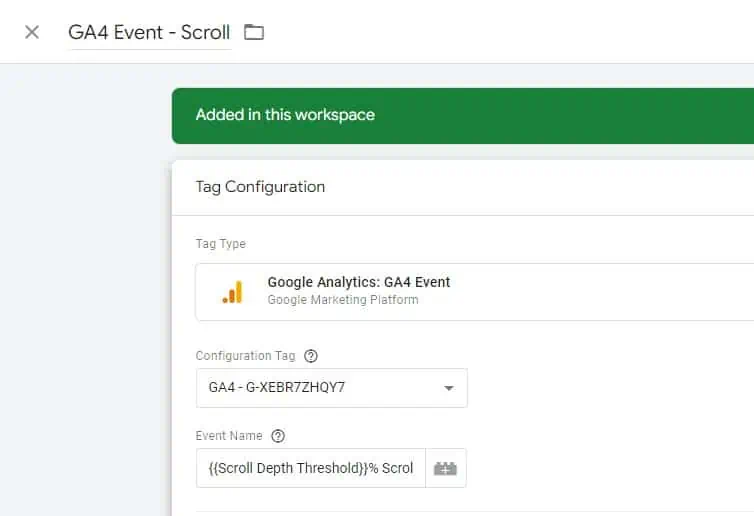
Now, let’s see what we have done in more detail.
In the Configuration Tag placeholder, select your GA4 configuration tag. This configuration should be available if you’ve followed the link shared above on how to install GA4 with Google Tag Manager.
In Event Name, feel free to name your event with one of the following methods:
- Using the Scroll Depth Threshold variable
- Using Event Name and Event Parameters
The first option doesn’t require creating a custom dimension and it allows you to be more descriptive with your event name. If this sounds a bit foreign to you or you need to revise these terms, you can read our post on how to track events with GA4.
It’s time to take a look at both methods in detail, starting with the first one!
Method 1: Using the Scroll Depth Threshold Variable
Click the variable icon.
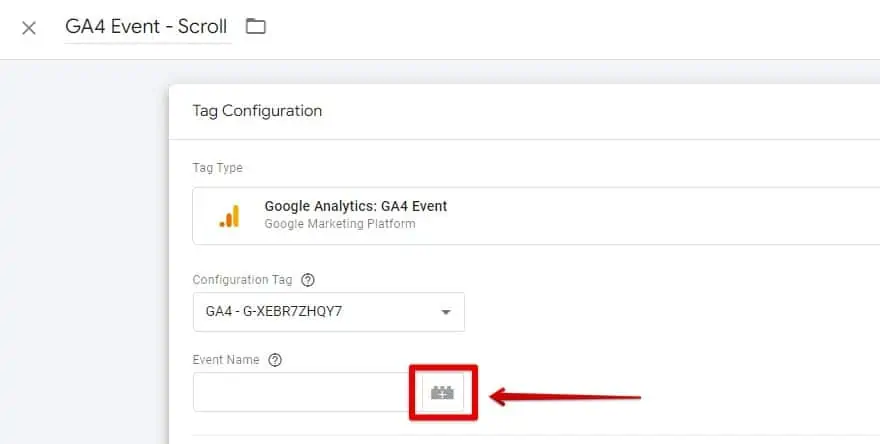
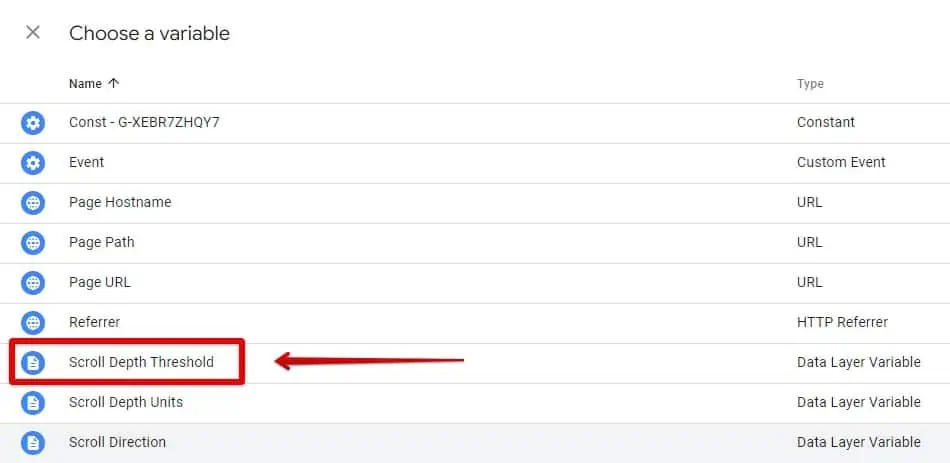
Select the Scroll Depth Threshold Variable.
Add a % sign after the curly braces, then a space followed by the word Scroll, as shown below.

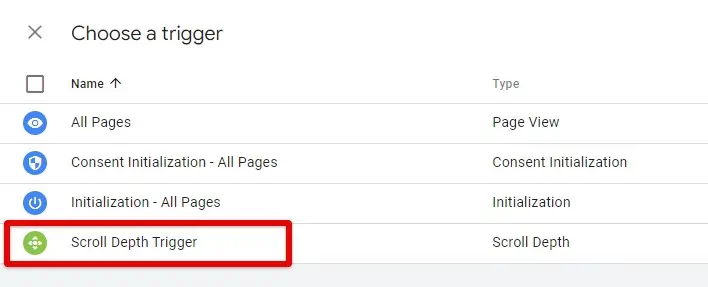
Choose a trigger to go along with your tag. Then, click anywhere in the Triggering box.

Select the Scroll Depth Trigger you configured earlier. Then, click Save to save your tag.
Now, let’s see how everything looks on both Google Tag Manager and Google Analytics.
Enable the Preview mode and scroll down to the bottom of your website’s page. In the debug interface, select any of the scroll events and click on the fired tag.
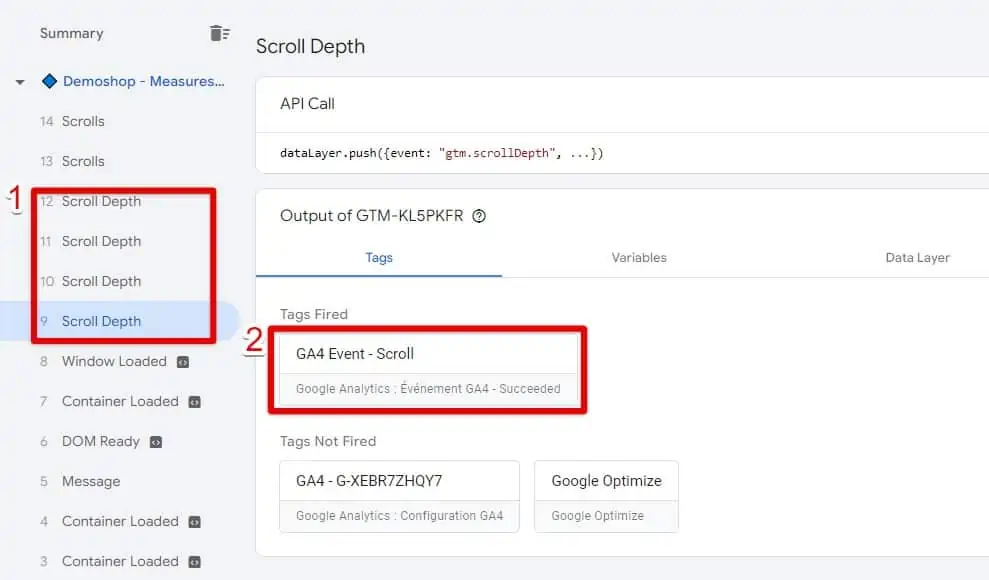
If the tag has been fired, you will see in Tag details what the event will look like in Google Analytics. In the top right corner, click Values to display the value of your variable.
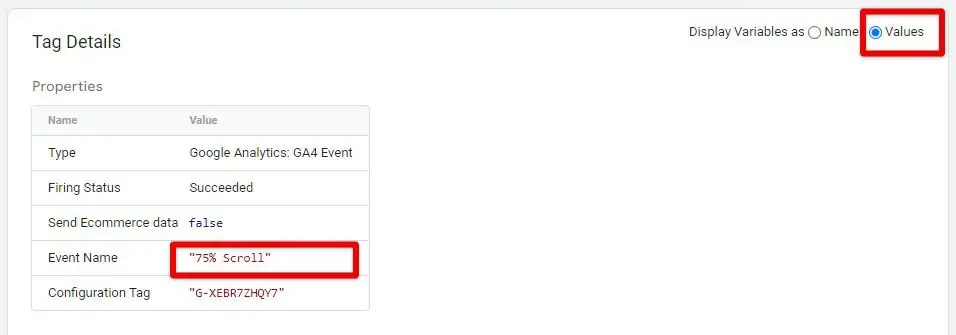
So far, so good! Things are working as expected on the Google Tag Manager’s side. However, to ensure that all is well, head over to Google Analytics and go to DebugView.
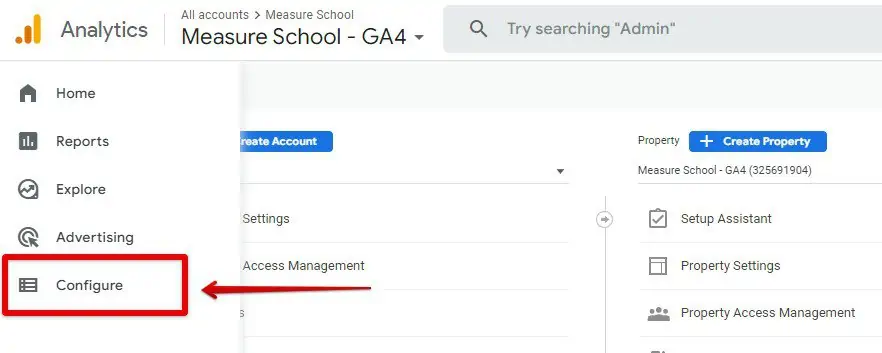
In the left navigation bar, select Configure.
Then select DebugView.
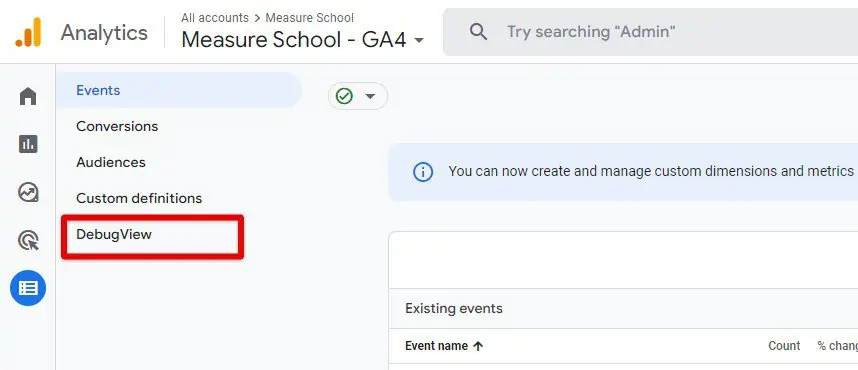
Your DebugView report should display your live scrolling events, and if that’s what you see, you did a great job!
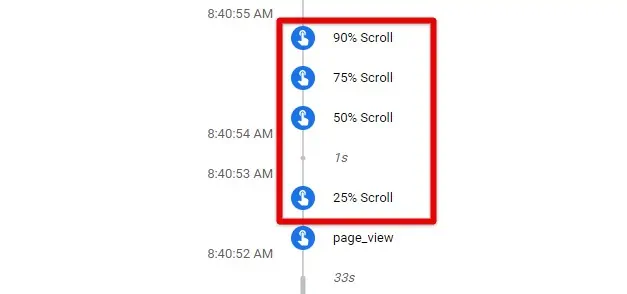
Method 2: Using the Events and Parameters
Compared to what you’ve configured so far, you will not see an event for each scroll threshold (an event for 25%, an event for 50%, etc.) using this method.
Instead, it creates a single event that we’ll name ‘scroll’, along with event parameters which are additional information about the event.
This method saves room in your report but requires additional steps in both Google Tag Manager and Google Analytics.
🚨 Note: You can name your event whatever you want, but it is a common practice to use or replicate Google’s naming conventions when using events with parameters.
To get this to work, keep the trigger you configured previously. You’re only going to modify your GA4 Event tag.
Your setup should look like this:

Save your tag and publish it.
Make sure that everything is working as expected in your DebugView report in GA4.
You might be thinking about why we did the setup the way we did. Well, scroll tracking is a feature available in Google Analytics.
Since it falls under the category of Enhanced measurement, it is advised to use Google’s general rules for naming your events and parameters.
The image below is an example taken from Google’s documentation and we’ve replicated the same in our setup.

Following Google’s example, we typed the Event Name ‘scroll’ in lowercase. The Parameter Name is also in lowercase and has been separated by an underscore.
To populate the built-in variable for the Value placeholder, click the variable icon.

Select the Scroll Depth Threshold built-in variable. Then, click Save for your changes to take effect in GA4.
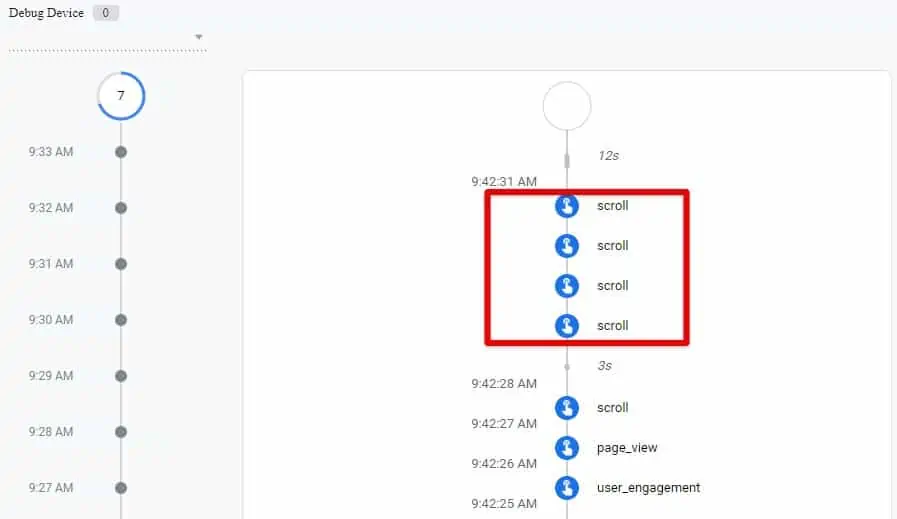
This is what it’ll look like in your GA4 DebugView report. As you can see, we only have one scroll event named ‘scroll’.
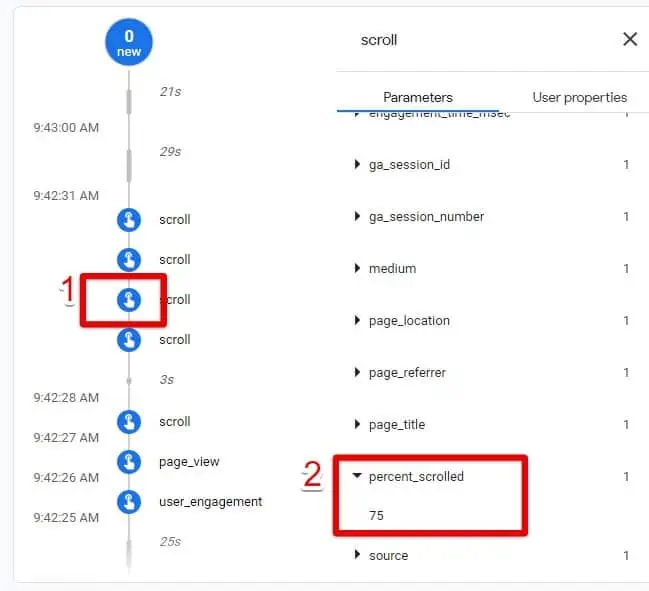
To see the details (parameters) of the scroll, click on any scroll event, and then under Parameters, click percent_scroll. Here you will see the scroll depth percentage of this event.
Sending Scroll Events With Enhanced Measurement
As mentioned before, this is the fastest and easiest way to track scrolls. You implement it within GA4 without Google Tag Manager.
Nevertheless, this method is not the most insightful or accurate one if you take into account the many behaviors behind scrolls.
We could have started by showing you this method first, but considering all the different customization you may need, it was better to show you this at the end.
Having said that, there will be cases where a scroll event with Enhanced measurement is befitting, like when you’re only interested to know who reaches 90% of a given page.
To enable Enhanced measurement on a scroll, do the following:
Click Admin in the bottom left corner of the page.

Under Property, click on Data Streams and then select your website in Data Streams.

In the Events section, go to Enhanced measurement and click on the settings icon.

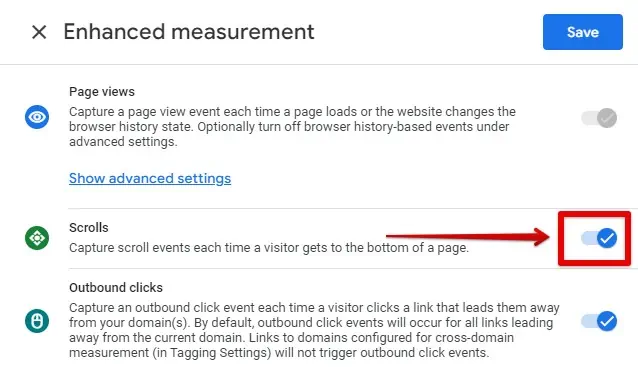
In Scrolls, enable the scroll tracking option, and click Save.
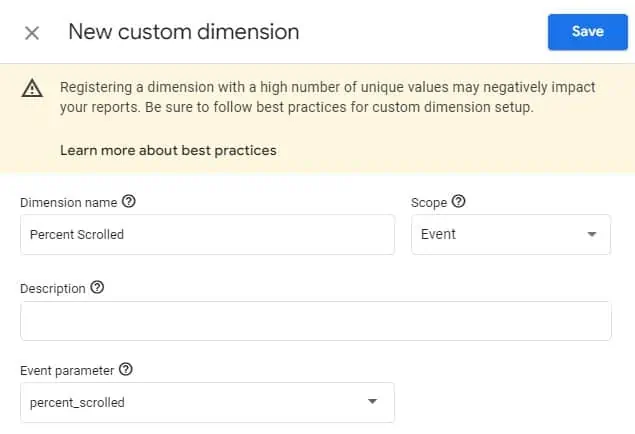
If you want to see your percent_scrolled parameter in your GA4 reports, you need to create a Custom definition.
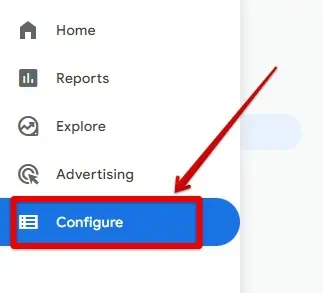
For that, simply go to Configure in the left navigation bar.
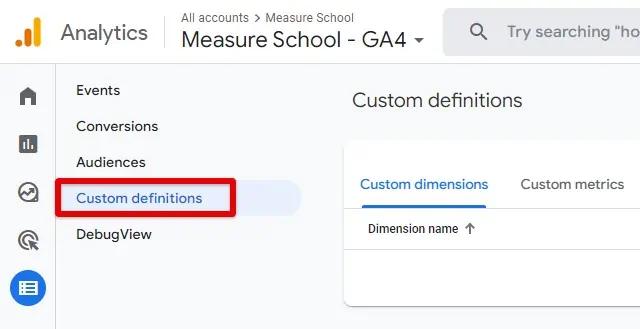
Select Custom definitions.
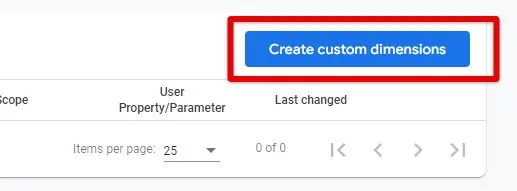
Then, click on Create custom dimensions.
Follow our setup and save it. In the Event parameter placeholder, there is a drop-down where you can select your percent_scrolled parameter.
You are now good to go!
How Do You Analyze Scroll Depth?
We’ve learned all about what scroll tracking is and the different ways to implement it.
At this point, your setup is complete and you should wait a couple of days or weeks to collect significant data for your scroll events analysis.
However, let’s first take a look at the value of scroll tracking as a metric.
Is Scroll Tracking a Good Metric?
Scroll tracking may or may not be a good engagement metric. It is often described as a way to measure user engagement, but this is best done in conjunction with other engagement metrics, such as time on page or bounce rate.
To simply view it as an isolated metric will not tell you much about the visitor intent.
Think about this for a moment, how many times have you scrolled down a page after reading just a few lines? Probably quite a few times…or all the time!
In particular, full scroll downs occur on long sales pages as users are trying to find the price.
The same is true for blog posts and other content-rich pages where readers are looking for a small piece of information or a call to action.
This is why the Element visibility trigger in Google Tag Manager works so well with scroll tracking because you can be clear on whether or not a user is taking time to look at your call to action, price section, or any other key element, and not just scrolling through.
This behavior is too common to ignore and to exclusively associate high engagement with considerable depth scrolls.
Then comes the issue of the event or hit limits. Depending on the analytics platform, going beyond the limit of a premium service could incur higher fees.
In GA4, you have a limit for the number of custom dimensions you can have. Your scroll Event name or parameter is included in that limit and can be one too many.
Having said that, scroll tracking is sometimes tied well to analytics platform features whether in GA4 or other platforms like Hotjar.
In Google Analytics, you can use scroll-tracking data to create segments.
Hotjar’s scrolling maps can help you see how pages are being scrolled through different reports (such as scroll reports for phones and desktops). This can be investigated further with screen recordings.
How Do I Find My Scrolls in Google Analytics
To analyze scrolling data, you first need to know where to find it. Here are the reports where you can view and analyze your scroll events:
The Realtime Report
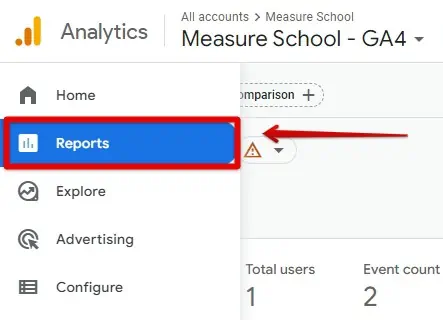
In the left navigation bar, click on the Reports icon.
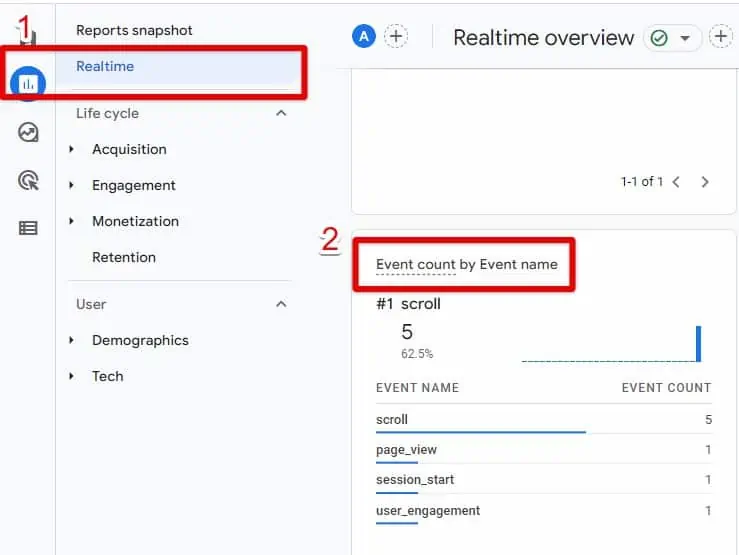
Select Realtime. At the bottom, you’ll see scroll data under Event count by Event name.
The Events Report
In the reports section, go to Engagement, and select Events.
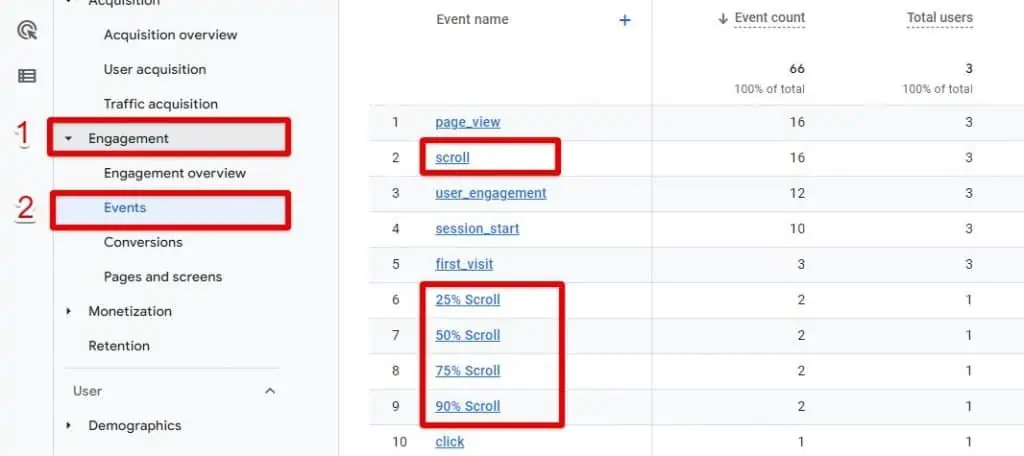
Here, you’ll see a report listing your events in descending order. Clicking one of them will lead you to a dashboard dedicated to this event.
Funnel Exploration Report
The Funnel exploration report allows you to conduct a deeper analysis of your scroll events. You can use scrolls and analyze them for key pages or multiple pages of your site.
It’s much easier to view how many of your users reach your thresholds.
How to Use Scroll Depth Data to Improve the User Experience on Your Website?
These are some common questions that can be answered by using scroll tracking:
- Why do people drop off?
Maybe, your content is too long and complex.
- Where to place your pop-up triggers?
Based on your criteria, pop-up placement can get into the right scroll percentage threshold. This is also true for irritating pop-ups that interrupt users from going further down the page.
- Are visitors reading the content on your page?
Time spent on a page is a good metric to understand engagement, but it doesn’t necessarily mean that the users are digesting your content (think of unread tabs). However, scroll tracking proves that there’s some kind of interaction. This may need to be explored further with other engagement metrics or the element visibility trigger in Google Tag Manager.
- Is your content relevant to your audience?
If only a quarter (or 25% scroll) of your long blog posts is consumed, it’s a sign that your readers are not engaging with your blog content, and may be losing interest because their expectations are not being met. It may also determine the quality of your web traffic (e.i., bringing in the wrong type of audience).
- Why is traffic to your page great but conversions are low?
Maybe, your call to action or form is located at the end of a long sales page. If you even have a few conversions, scroll tracking tells you if visitors don’t reach the bottom of the page. This lets you know that you should move these elements to the top of the page.
- How is the user experience across devices?
Mobile behavior can be different from desktop behavior. Therefore, content and elements may be adjusted to fit them.
FAQ
How do I implement scroll tracking in GA4?
There are two main methods to implement scroll tracking in GA4:
1. Using a tag management tool like Google Tag Manager to create a scroll event.
2. Enabling the default scroll tracking feature in GA4’s Enhanced measurement.
How do I set up scroll tracking using Google Tag Manager?
1. Disable the default scroll tracking in GA4 settings.
2. Configure the scroll depth threshold variable in Google Tag Manager.
3. Create a scroll trigger in Google Tag Manager.
4. Create a tag in Google Tag Manager using the Google Analytics: GA4 Events configuration.
5. Test and validate the setup using the Preview mode in Google Tag Manager.
Is scroll tracking a good metric for measuring user engagement?
Scroll tracking is a useful metric, but it should be used in conjunction with other engagement metrics such as time on page or bounce rate. It provides insights into user behavior but should not be viewed in isolation.
Summary
By now, you have learned to trigger the 90% scroll event. Great job!
Scroll tracking is possible in Google Analytics, and it can be used to understand how your visitors are viewing your pages and digesting your content.
You can use this data to improve the experience for your visitors, such as ensuring that the content on your page is readable and identifying issues/opportunities on your pages.
As an engagement metric, it will give you a bigger picture when used with other metrics.
However, it does come with downsides such as event limits due to which, we recommend using the Scroll Depth Threshold variable described above.
Scroll tracking may simply not work in some cases, for example, some single applications, which is unfortunate.
There are a few reports that explain how scrolls are performed on your website. However, we recommend you learn how to create a Funnel exploration report in GA4.
We hope that this post helped you improve your measurement strategy. If you have any suggestions,
Which is your preferred method of setting scroll depth? Which topics would you like us to write about next? Let us know in the comments below.


it’s awesome content. I really appreciate you just for providing this type of content. I personally like it. Good Job.
Hi Sanjay, late reply but thanks for taking time out of your day to comment. Really appreciated.
Thank you!! Will this fire unique per user? I think currently the scroll event fires “each time a user gets to the bottom of the page”, so it tracks multiple times per user, which makes it harder to analyze.
Hi Karolina, I presume you’re using the Enhanced Measurement feature. Normally, if they were to scroll back up again and scroll down a 2nd time, in GA4 the thresholds will only count for the first time they did. That is unless they don’t refresh the page. Also, if you’re using GTM, make sure that your scroll trigger is set to “Vertical” and not “Horizontal”. What happens is that if it’s on horizontal, your events will fire for all the scrolls just by landing on the page.
I also wanted to add that the parameters reporting in GA4 currently seems to be very limited and when you click through to the “scroll” event to view details, it only shows real time data for the parameters, which isn’t very useful, because you can’t evaluate it by channel. Have you discovered a better way to analyze parameters? I feel this reporting is super limited now.
Hi Karolina, yes they are limited only to user who have scrolled down to 90%. Not 25%, 50% etc. This is the only drawback of using Enhance Measurement for scrolls. The alternative (if you need to analyze different threshold percentages of your page) is to use GTM. Then you can analyze your scroll events by going to the Events report and analayze them within your standard G4 report. Lastly, you can use Explorations to analyze your scroll event parameters. Also, in terms of timing, real time data always show events in real time, but you may not see the same… Read more »
Hey Eric!
thanks for your great explanation. i have implemented the scroll event according to variant 2 (one event including scroll depth parameter). however, in the exploratory data analysis in GA4 i see that a large part of the scroll events arrive with an empty parameter. do you have any idea what i might have done wrong? Thanks in advance for your help
Hi Daniel, thanks for the message. I assumed you’ve registered the parameter as a custom dimension in GA4, Has more than 24 hour passed since ? How does your Exploration compares to the standard reports. Also in Explorations, try using a filter for your event name, example: Event name exactly matches “Scroll” (or your Scroll event name).