Last Modified on January 7, 2025
If you’re interested in the broader picture of your Facebook ads performance and want to know what’s going on in the heads of users who navigate your site after clicking it, then tracking them in GA4 is the right way to go.
Tracking Facebook ads in Google Analytics 4 involves using a URL builder to define the parameters based on your ad campaign. After adding the new link to your ad, GA4 will report the data.
You can create custom reports to leverage GA4 features to get a full picture of traffic coming just from Facebook ads.
Setting this up is easy. But as with most analytics-related topics, one configuration can touch other subjects including modeling attribution and data discrepancies or inaccuracies.
This post isn’t just about UTM parameters. We’ll show you different best practices to track and analyze Facebook ads traffic in Google Analytics 4.
Here’s an overview of what we’ll cover:
- Why Should I Track Facebook Ads in GA4?
- Steps in Tracking Facebook Ads in Google Analytics 4
- How Do I See Facebook Ads in GA4?
- How to Track Facebook Conversions in Google Analytics 4?
- How to Analyze Facebook Ads?
- Why Is There a Discrepancy Between Facebook and Google Analytics?
Why Should I Track Facebook Ads in GA4?
Here are some highlights of why tracking Facebook ads in Google Analytics is a smart move:
- Many marketers report that Facebook Ads Manager doesn’t correctly attribute conversions to the right ads. Tracking your FB ads in GA4 helps to attribute conversions ads more correctly.
- Once users click the ad and wander off somewhere else like navigating a website, Facebook is unable to track what happens beyond that point. Facebook ads are more impacted by the IOS security and privacy changes. It’s not to say that Google Analytics isn’t affected. But since it uses first-party cookies, the consequences are partial. GA4 is very helpful as it continues to work as an analytics platform. With UTMs and enabling conversions that are similar to your Facebook goals, you can recuperate lost data.
- You can understand the full conversion path. For example, after clicking an ad, did they convert right away, or did they visit other pages first? For those who didn’t convert, maybe the landing page didn’t match their expectations as indicated by low-engaged sessions and a high bounce rate
- It is always best practice to use at the minimum two analytics tools to compare the data and to see if changes or conversions match each other or detect the trends.
Steps in Tracking Facebook Ads in Google Analytics 4
Here’s the process in short:
- Use a UTM builder
- Set Up UTM Parameters Facebook Ads
- Add the Generated Link to Your Ad
Step 1: Use a UTM Builder
The first step is to use UTMs to customize the information (parameters) added to your URL. Google Analytics will perform well in terms of tracking traffic sources and links.
However, if you don’t need more precision (e.g. having the name of a marketing campaign in GA4), you have to tell GA4. UTM builders allow you to do this.
There are different UTM builders out there. The most common one is the one from the GA Dev Tools. You can build UTM on Facebook as well in two different places: when you’re creating an ad and this standalone tool.
💡 Top Tip: If you’re all about organizing and efficiency while setting up your campaigns, this is why you’d want to have the MeasureSchool UTM builder in your toolbox.
You may wonder what makes this UTM builder so special.
You will quickly notice that tracking campaigns using regular UTM builders is an iterative process. This tool makes the whole process much easier and automates all the repetitive tasks for you.
There is no need to always go back to the builder and add all the parameters over and over again for your different campaigns. Everything is there for you once you have added the details that you want.
This free tool comes with pre-filled suggestions for your source and medium parameters. You can add new ones as well.
One of the coolest features is the ability to shorten your URL. This is very useful because most of the time you find yourself navigating to other websites to find a URL shortener. With this tool, you can build your campaign URLs and naming conventions in one spot.
You’ll be able to structure your campaigns in such a way that Google Analytics won’t just give you numbers, but reveal a full story for each of your traffic sources.
You’ll be able to understand the interests of your users coming from ads once they land on your website. This way, you can figure out how to improve the digital conversation, how to greet and guide your users, and how to meet their expectations.
💡 Top Tip: Whichever builder you use, ensure that your naming convention remains consistent. You don’t want to change the name of your campaigns frequently. GA reports with more than 15 or 20 campaigns tend to indicate that their campaigns lack structuring. You want to keep everything consistent, so you don’t end up mixing things up later on.
Once you have established your naming conventions, they will be stored for consistency so that anyone who uses the builder will follow your setups.
Step 2: Set Up UTM Parameters Facebook Ads
Here’s an example of a Facebook ad campaign parameters built with a UTM builder:
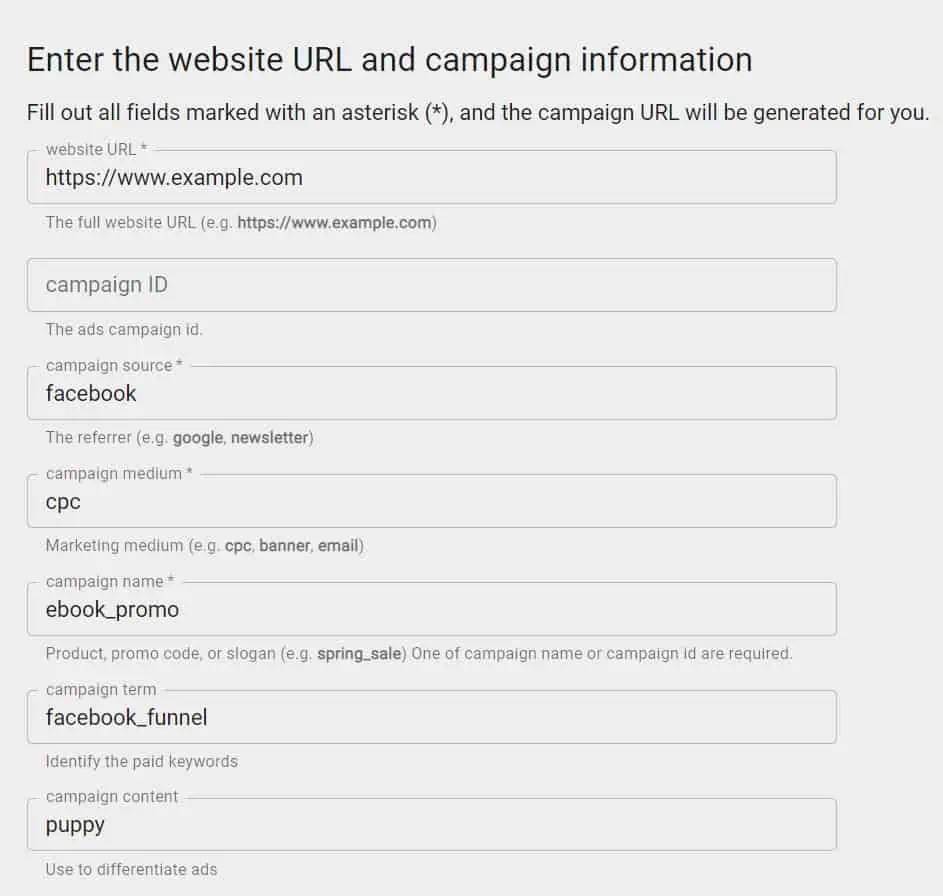
The builder will generate the following link:
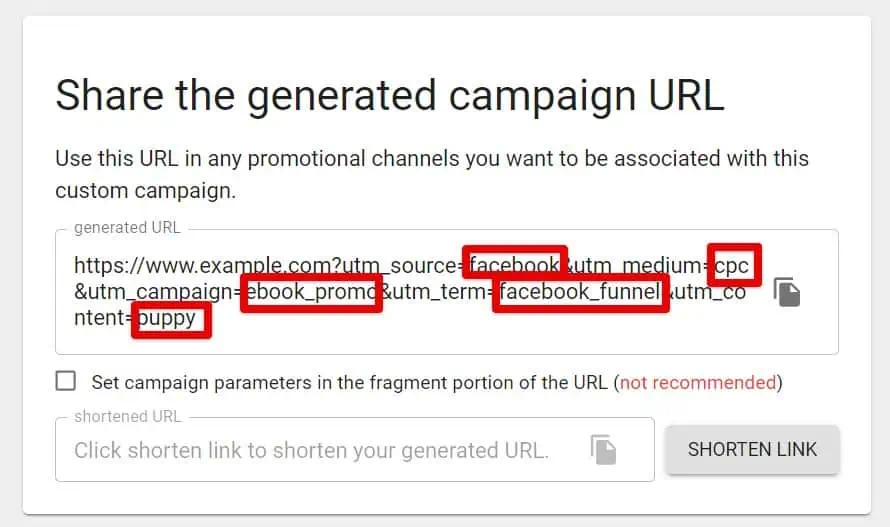
Step 3: Add the Generated Link to Your Ad
Now it’s time to add your link to your Ad. There are 3 ways to do it.
The first is to add the link when you create your Facebook ad. There you can customize your link using its builder. However, you will always have to repeat the procedure for a new campaign, like that:

Second, you also have the option to add the link in your ad description. For that, you have to shorten your link and add it like this, so that it is not too long.
From there, all you have to do is go to GA4 to see your ads.
How Do I See Facebook Ads in GA4?
There are four places where you can access your Facebook ads data:
- Acquisition Overview
- User Acquisition
- Traffic Acquisition
- Explorations
The first three reports are found in Acquisition.
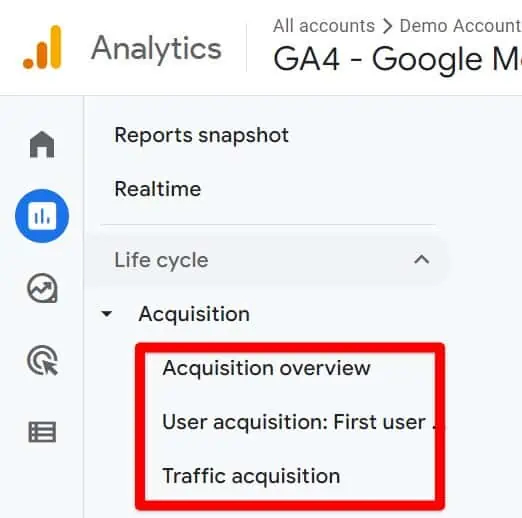
Acquisition Overview
Go to Acquisition → Acquisition Overview.
The acquisition overview is a snapshot of your traffic data. Scroll down, you will find 2 cards, one related to the User acquisition report and the other to the Traffic acquisition report.

You can change the default dimensions of these cards.
However, for more meaningful data and to view all your ad campaigns, click the link at the bottom of the card that’ll bring you straight to the full report connected to this summary card.

User Acquisition
The user acquisition report contains data on users who are accessing your website for the first time.
This report is useful for understanding the effectiveness of campaigns focused on increasing brand awareness for example, as it provides information on how these campaigns bring new users to your website.
The table report at the bottom is set to the First user default channel group:
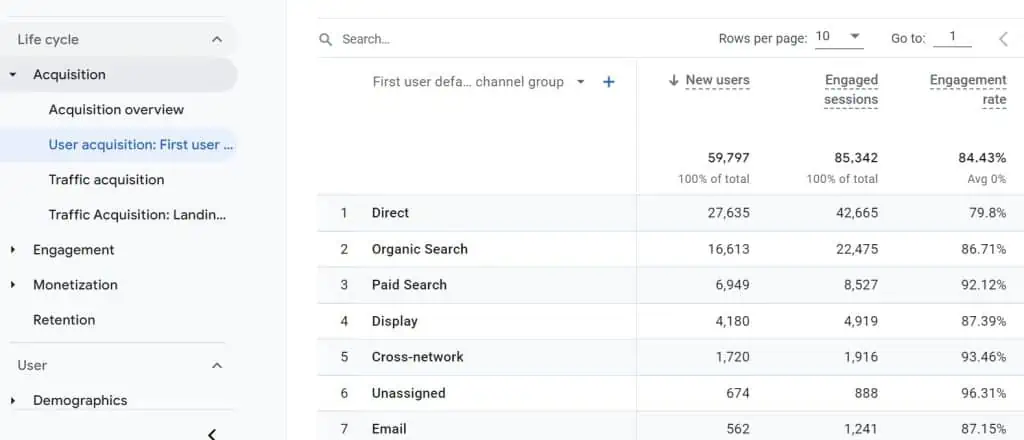
Again, you can change the default dimensions to either First user source/medium or First user campaign by clicking on the text or the tiny dropdown arrow, to see your ads:
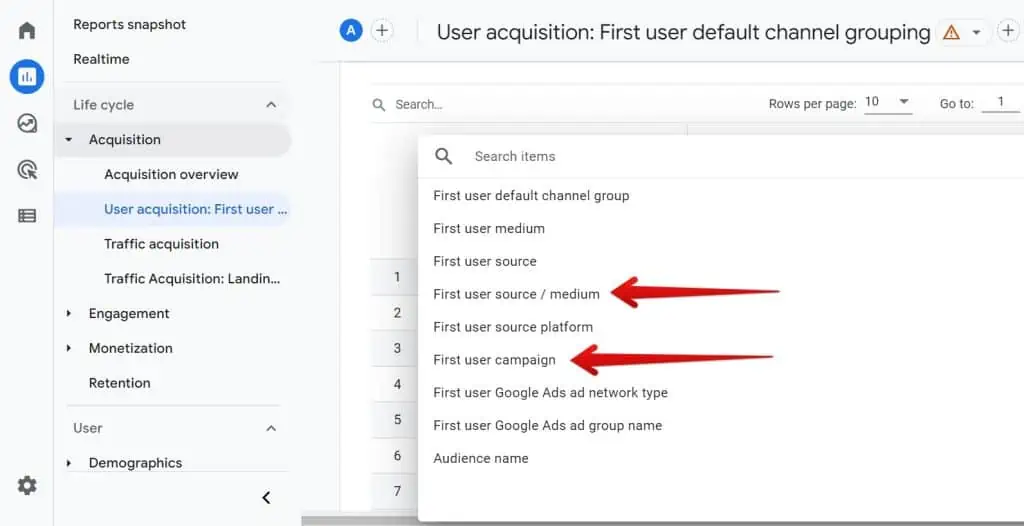
First user source/medium
Use this to see the source/medium that brought users for the first time to your website. You can then look at Facebook / CPC, compare it to other channels and evaluate the performance of that channel.
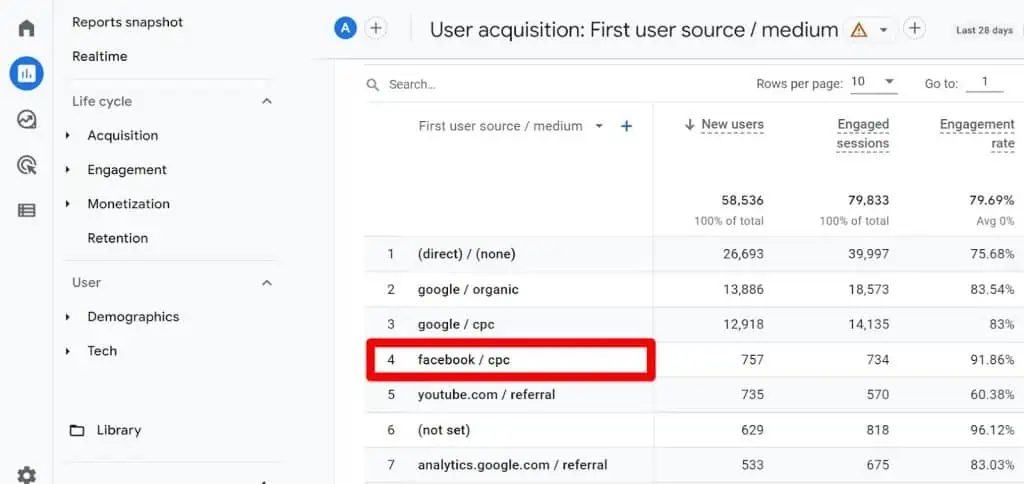
Unfortunately, the source/medium cannot be drilled down to find a specific campaign (the same goes for all reports under Acquisition). For that, you’ll have to change the dimension to the First user campaign or better yet, use explorations (more on that later).
First user campaign
This is to see which campaigns brought users to your site for the first time.
Traffic Acquisition
The traffic acquisition report will help you understand what brings users to navigate your website (sessions) based on whether they’re new or returning users.
This is different from the User acquisition report, which focuses on how users discovered your website for the first time only.
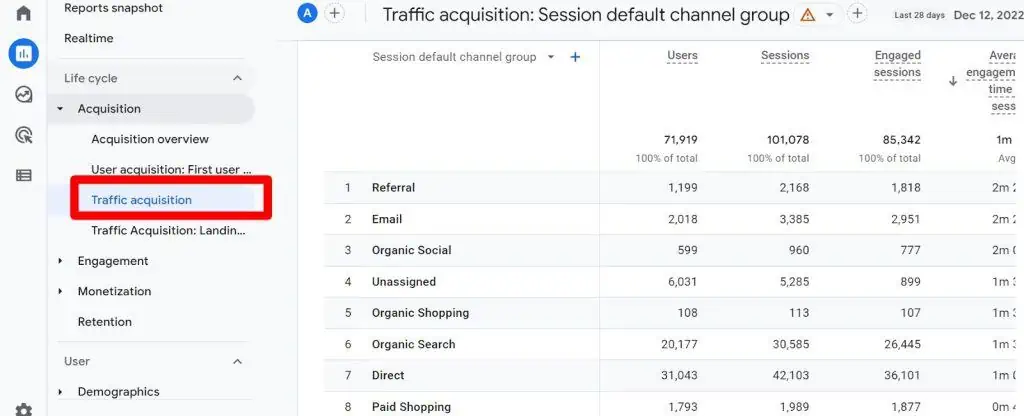
The traffic acquisition focuses on those visitors who start a session. The layout and features work the same as the user acquisition report.
To see your Facebook ads data, you can change the dimension to the Session source/medium or Session campaign and this time screen.
Explorations
The exploration report is our recommended report for conducting a more in-depth analysis. We built 2 explorations for you, but feel free to change the dimensions and metrics to suit your needs.
If you’re not familiar with building explorations, this documentation should help out. However, let us know if you’d like us to make a tutorial on the subject in the comment section.
We’ve built 2 reports for your Facebook ads analysis. We’ll just call them Report 1, and Report 2.
Report 1
The first report helps you analyze your Facebook ads campaigns. It includes the following dimensions and metrics.
Dimensions:
- Campaign
Metrics:
- Total users
- Engaged sessions
- Bounce rate
- Conversions
- Total revenue
We’ve created a segment to show data specific to Facebook ads.
To add a segment, click on the plus sign + on Segments:

Select the Session segment when asked to build your filter.
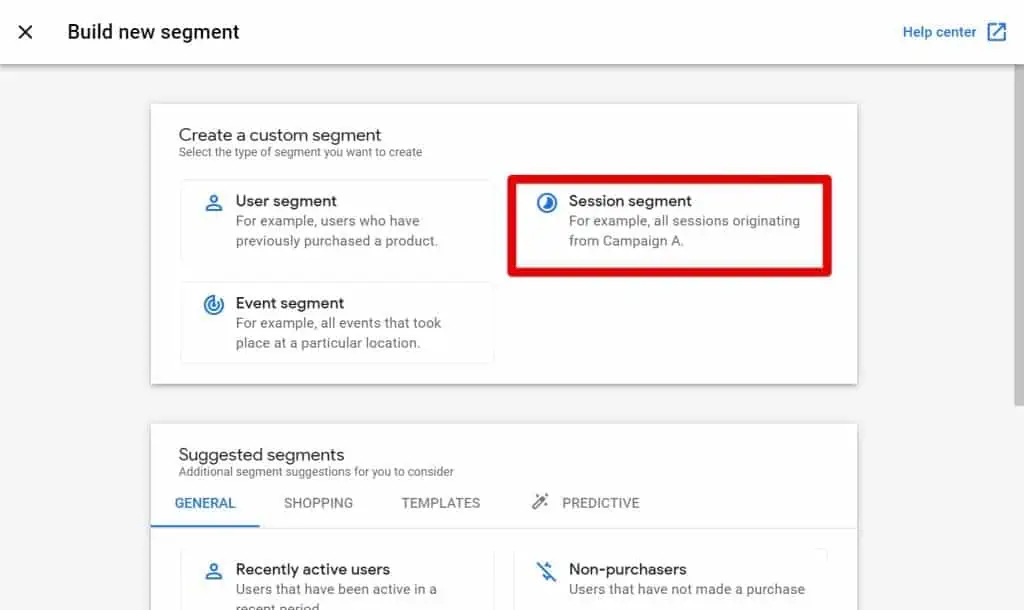
Click on Add new. There will be a dropdown.
Follow these steps to select the right dimension: Traffic source → Session source/medium
Then click on + Add filter. Include a filter condition that matches regex for Facebook / CPC. This is how the segment should look:
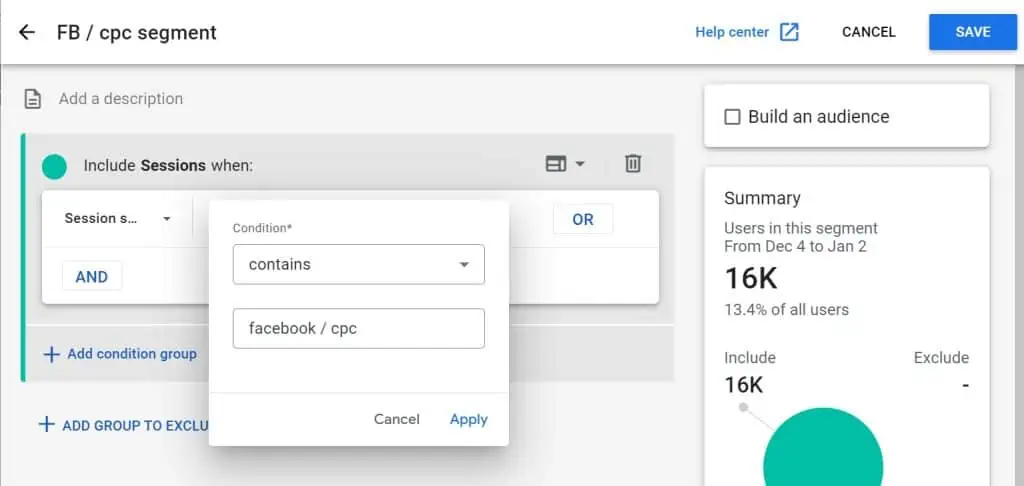
Click Apply, then click Save at the top right corner.
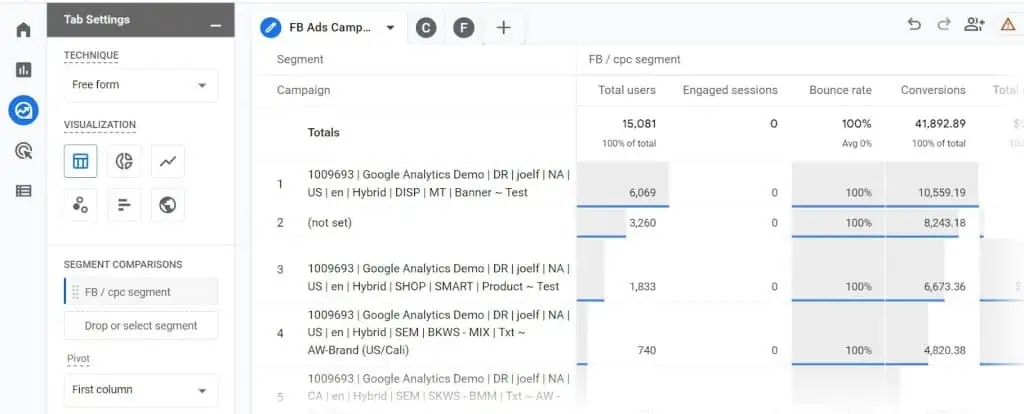
Now your report should show Facebook ads for your specified date range.
This is how your end report should look like, showing Facebook ads for your specified date range.
🚨 Note: We used Google / CPC data for demonstration purposes. The process though remains the same.
Report 2
The second report helps you drill down your campaigns by looking at the Facebook ad content (content parameter added in with URL builder).
We kept the same segment and metrics you’ve seen in Report 1.
The only difference is that we changed the dimension to Session manual ad content.
You can now analyze the performance of your different Facebook ad sets.
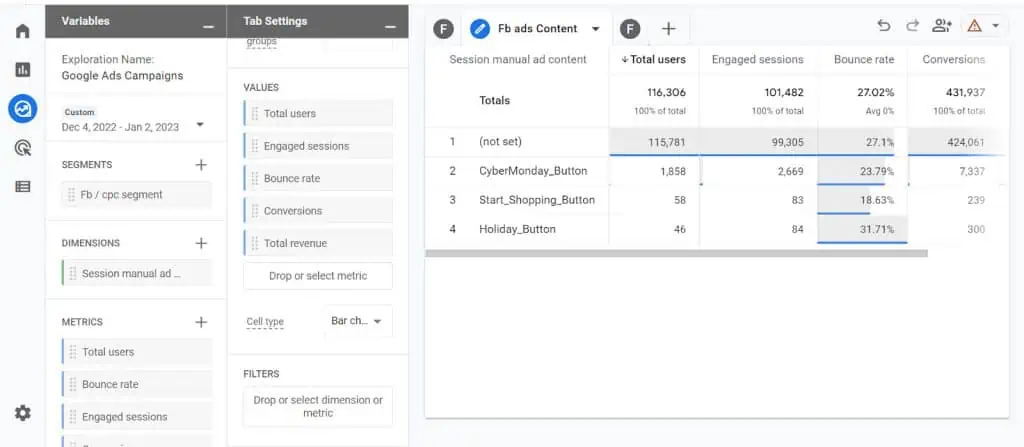
🚨 Note: We’re not using segments here. Also, because we are using the GA4 demo data from the Google merchandise store, you will not find Facebook ads data (Facebook / CPC), but rather Google ads data (Google / CPC). For this exercise, pretend that Google / CPC represents your Facebook ads.
How to Track Facebook Conversions in Google Analytics 4?
To track Facebook ads conversions in GA4, we recommend creating conversions in GA4 that reflect your Facebook objectives.
To create a conversion in GA4, you must first send an event to GA4. You can then mark the event as a conversion simply by clicking a toggle button.
An event can be created within GA4 (some events come with limitations), but besides a pageview event, we prefer using Google Tag Manager.
Here is a video on how to create an event and modify it as a conversion in GA4: How to Configure GA4 Goals and Conversions.
How to Analyze Facebook Ads?
By now, you should know how to track your Facebook ads. But what to do with all this information?
Which metrics should you focus on?
Which tool between Facebook ads manager and Google Analytics should you trust?
What should you do if the results don’t match between the two platforms?
We could have included all these specific details here, but it would make this post too lengthy and go beyond the goal of tracking your ads in GA4.
If you’re interested in learning how to deal with these questions, take a look at this great read on how to analyze Facebook ads campaign data – how to make sense of the metrics. There is also a video if you want a more visual guide.
However, there is a must-have method that we recommend: the use of comparisons.
Using Comparisons (aka Views)
Here is a pro tip. You are going to apply what used to be referred to as views in Universal Analytics, the previous version of Google Analytics 4.
Essentially, views were a way to filter all your reports using a subset of your data.
For example, rather than always changing your dimensions as we just did earlier to find Facebook ads-related insights, you could just keep all your GA4 reports.
The only difference is they will only show you Facebook ads data. Nothing else. You can use comparisons to achieve that.
Note that comparisons work for any report.
Here’s a standard GA4 report, it includes data for all our traffic sources, campaigns, etc.
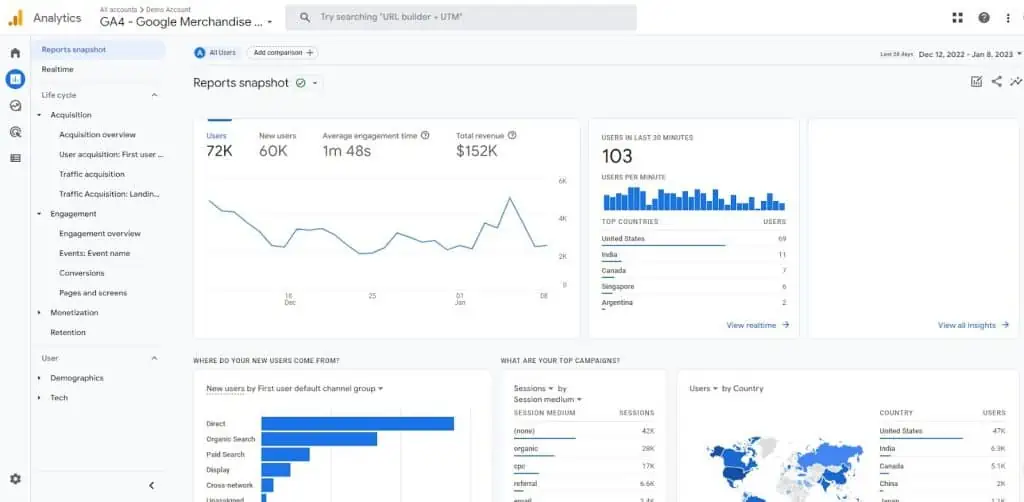
The following image is the same report, except that it only displays Facebook ads data. Notice the drastic change in numbers compared to the previous image. For example, you can see that we went down from 72K users to 13K users.

This is very useful to understand how your Facebook paid traffic behaves and goes through your funnel.
To create a comparison, click on the Edit comparisons icon at the top right-hand side of any report, then follow our steps. Instead of Google / CPC select Facebook / CPC.
Click on Ok, then Apply.
Why Is There a Discrepancy Between Facebook and Google Analytics?
There can be various explanations for why the data in your Facebook Ads Manager and Google Analytics 4 do not match.
One of the main reasons is that the two platforms track clicks differently, with Facebook placing more emphasis on engagement clicks such as shares, likes, and comments, while GA4 primarily tracks clicks that lead to a website.
As a result, if a user clicks on an ad twice within a 30-minute session, Facebook will register these as two separate clicks, while GA4 will only count it as one.
Additionally, Facebook may be more inclined to attribute conversions to its platform, while GA4 takes a more holistic approach and considers the role of various sources in a conversion.
However, it’s important to note that GA4 may not track certain interactions such as view-through. Some users may choose to not be tracked, either by disabling cookies, running ad-blockers, or turning off JavaScript. which may result in lost data for GA4
FAQ
How can I see Facebook ads in GA4?
In GA4, you can access your Facebook ads data in the following reports: Acquisition Overview, User Acquisition, Traffic Acquisition, and Explorations. These reports provide insights into the performance and effectiveness of your Facebook ad campaigns.
How can I track Facebook ads in Google Analytics 4?
To track Facebook ads in Google Analytics 4, you need to use a URL builder to create custom parameters for your ad campaign. Once you have the generated link, you can add it to your Facebook ad, and GA4 will report the data.
How do I set up UTM parameters for Facebook ads?
To set up UTM parameters for Facebook ads, you can use a UTM builder tool. One popular option is the UTM builder provided by GA Dev Tools. It allows you to customize the information added to your URL, such as the name of your marketing campaign in GA4. Consistency in naming conventions is important to keep your campaigns well-structured.
Summary
Tracking Facebook ads in Google Analytics 4 can provide a more accurate picture of ad performance.
This is not to say that one tool is better than the other. GA4, for example, cannot track view-throughs. So, we can see that GA4 and Facebook ads manager complement each other.
Now you can create custom reports in GA4 to get a full understanding of traffic coming from Facebook ads.
Tracking Facebook ads in GA4 can also help attribute conversions to the correct ads and understand the full conversion path of users, including any actions taken on the website after clicking on an ad.
If you’re interested in exploring the topic of ads with other popular platforms, such as how to set up ads for Shopify, just check out our blog. There is complete A to Z tutorials on setting up and tracking ads.


Hello!
Nice article! I was wondering if it is possible to use UTM parameters for setting ad identification numbers of Facebook ads to see customer journey in GA4.
Thank you
Pick a number between 1 to 10,000
256
Hi, How to track conversions in GA4 when running Lead gen ads ? Is this case, the user is not visiting our website and conversion occurs only in meta ( or LinkedIn). How to keep tracking of these users and conversions in GA4?
Through measurement protocol api and meta lead gen webhook api you can send hits to GA4.