
Last Modified on April 2, 2024
Are you running Facebook Ads campaigns—but confused when you have to analyze the metrics?
There are so many ways to look at Facebook Ads results, but as a marketer you should focus on metrics that helps you optimize your campaigns. With the correct analysis, you can not only reach more audiences, but also save a lot of money on those ads!
In this guide, we’ll discuss the different metrics available in Facebook Ads results and learn how to interpret and analyze them.
An overview of what we’ll cover:
- Campaign objective overview
- Adding the metrics to a campaign report
- Analyzing data at the Campaign level
- Analyzing data at Ad Set level
- Comparing Ad Set results (Ads level)
- Understanding frequency data
- Analyzing data at Ad level
- Analyzing frequency at the Ad level
So let’s start!
Campaign Objective Overview
Campaign objectives are essentially your advertising goals—you can select them based on the impact you want to have on your users.
Depending on where your target audience is in your funnel, you can create awareness, raise consideration, or convert users.
Let’s open our Ads Manager account and look at a past campaign to better understand the objectives. For example, this is a campaign we used for a virtual event that helped optimize Facebook leads.

To select the campaign objective, click on the Create button. It will open a window to Choose a Campaign Objective.

It is important to know that depending on the objective of each Facebook Ads campaign, the metrics will change accordingly.
For example, a brand awareness campaign, a traffic-increment campaign, and a sales campaign will each have different metrics because their objectives are different.
Your focus in each case should be the metrics that demonstrate the ROI on the ads you bought.
Thus, the metrics you care about will change depending on which part of your funnel a campaign targets. Upper-funnel metrics attract the audience, the middle-funnel turns the audience into qualified leads, and the lower-funnel metrics convert these leads into purchases or clients.
Hence, if we analyze the upper funnel, we might be analyzing metrics like click-through rate or impressions. As we move lower into a funnel, we’ll try to optimize campaigns to result in the lowest cost per lead.
It’s a lot easier to select which Facebook Ads metrics to track once we understand the logic behind them.
Let’s take a look!
Adding the Metrics to a Campaign Report
Since we want a custom view of our Facebook Ads metrics, we’ll use the Customize Columns function.
🚨 Note: You can use a pre-made template if it suits your needs or if you’re not looking for highly customized reports.
Click the Customize Columns option to create your own view of the data.
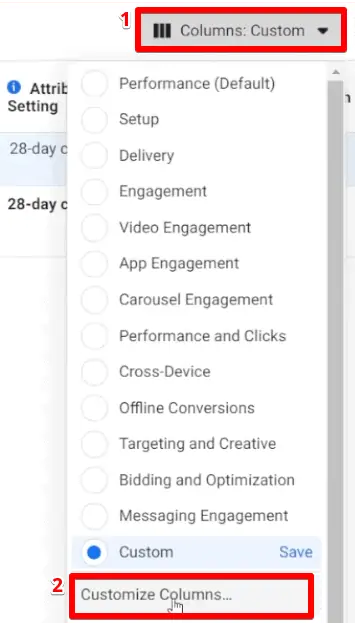
In the center of the screen, you’ll see a list of metrics. These are all the metrics that you can add to your custom view.
On the right side of your screen will be the list of metrics that are already present in your custom columns. You can drag and arrange them in the order you want. You can also remove some of these metrics if you wish.

If you can’t find a suitable metric for your template, you can click on Create Custom Metric to create a new one.
So let’s go ahead and add some metrics—each from the lower, middle, and upper funnels.
(Don’t worry too much about following the logic for each right now—we’ll explain more once our report is done.)
We’ll start by adding the click-through rate. To do this, you can search for the metric in the search bar.
The click through rate that we want to track is CTR (Link Click-Through Rate). There is also an option to select the CTR (All), but this metric will track all clicks on the page including images, comments, or any other irrelevant links.
On the other hand, CTR (Link Click-Through Rate) will filter the people who click on a particular link, so this is the most useful metric for us.

Next, we’ll add the CPM (Cost per 1000 impressions) metric to our custom view. This will help us to know the cost of an ad for 1000 impressions. Based on that, we can measure the effectiveness of our ad (i.e., lower cost per 1000 impressions is more effective).
You can also use this to compare the costs of different ads that you’re running.

The third metric we’ll add is CPC (Cost per Link Click). Similar to the CTR metric, we’ll select the CPC (Cost per Link Click) option instead of CPC (All) to track particular links.

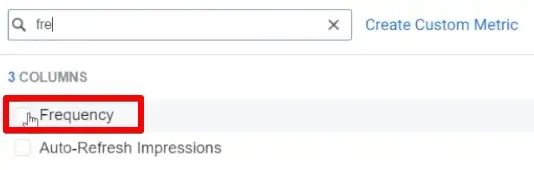
The next metric that we’ll add to our view is Frequency. This metric will tell us the average number of times a person saw a particular ad. With this metric, we can keep an eye on the cost per result of an ad.
Once you’ve set up your custom view, you can analyze the data in the Facebook Ads results.
Analyzing Data at the Campaign Level
Data at the campaign level gives an overview of the campaign’s performance. You can’t make a lot of modifications at this level. (If you want to make major modifications, check out the Ad Set and Ad level.)
At the campaign level, we can see the Results, Reach, Impressions and Cost per Result.

Before launching a campaign, you should ideally know the amount you’re willing to pay for the desired result. This amount can change based on your industry or your requirements.
For example, you wouldn’t want to pay a high cost per result for a free event—that’s a return of zero for high investment. You aren’t earning anything from these leads unless you expect an extremely high conversion rate for free event attendees.
On the other hand, if your conversion is worth a lot—like VIP coaching or course membership—then a high cost per result may be worth it. You’ll have to do your own math.
Similarly, you can also analyze your Facebook Ads data at an Ad Set level—but with some other useful tricks.
Analyzing Data at the Ad Set Level
Let’s click on the Ad Sets tab.
The three Ad Sets that we’ll discuss in this example have the same audience. We’ll start by analyzing the Results of each Ad Set.

It is possible that some Ad Sets have higher Results than others. However, the Results metric alone is not a comprehensive indicator of campaign success.
To dig a little deeper, we’ll also look at the Impressions and the Cost per Result.

If you’re paying more per result for an Ad Set that has more results, it is important to keep the other low-paying Ad Sets running as well.
In case you’re just running a test campaign and aren’t sure of the costs involved, it’s always better to use Ad Set Budget Optimization and not Campaign Budget Optimization.
You can go to the Campaigns tab, click on the Edit button and uncheck the Campaign Budget Optimization box.
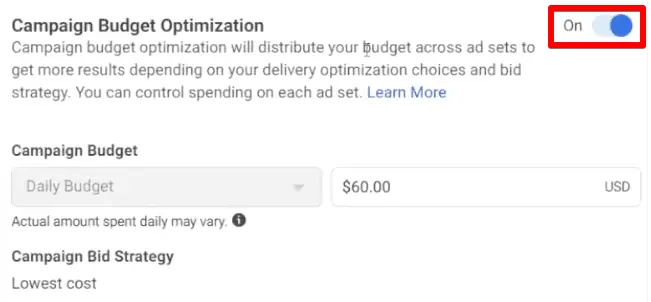
Using Campaign Budget Optimization will give Facebook the option to choose the Ad Set it wants to spend more money on. Keeping it unchecked will give you control over how you want to spend the budget.
💡 Top Tip: It takes at least 50 events—purchases, conversions, etc.—to see a normalization in the Cost per Result. It is best to wait for at least this many events before making any budget decisions! So in our example, the Cost per Result with just 23 events might not be very accurate.

A good option is to check the Ad Set Optimization option.
Secondly, you can have different Ad Sets running the same or similar ads. By doing so, you’ll know that the change in results is because of the audience and not because of an ad variable.
Moving forward, let’s dive deeper into the Ad Set results!
Comparing Ad Set Results (Ad Level)
In our sample campaign, we have three different Ad Sets running for a campaign. However, Facebook chose one particular Ad Set to use the budget more effectively and give more reach despite this Ad Set having a higher Cost per Result.
Let’s demonstrate why.
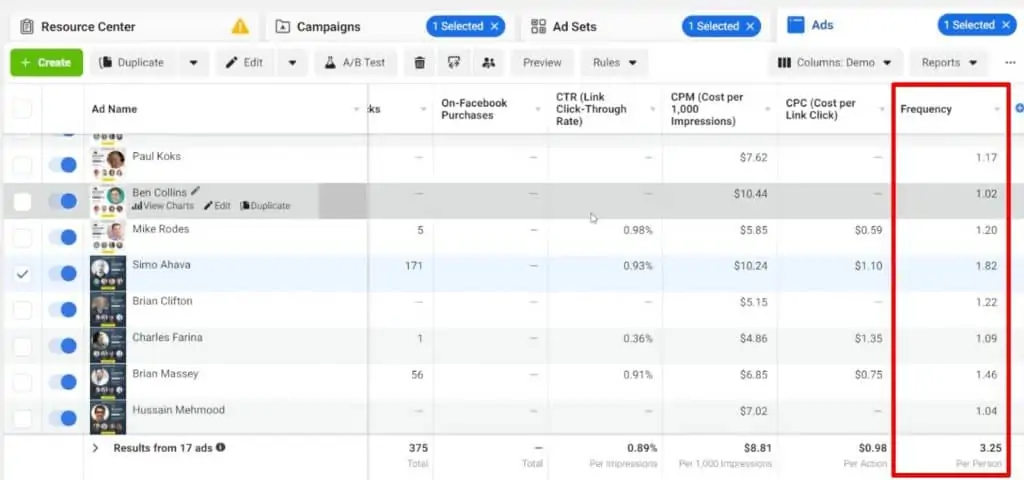
We’ll start with the ad for the first Ad Set that has the highest number of impressions. On the Ads tab, we can see that this Ad Set has a total of 17 different ads.

Next, we’ll also open the ads for the last ad set that has the least budget used and the least number of impressions. We can see that this Ad Set has only two ads.

This means that Facebook may have chosen a particular Ad Set simply because it has more ads. With more ads, Facebook has more tools to analyze and win over potential leads.
The Ad Set with 17 ads has so many variables and formats that it can use to find someone that might convert and become a lead. Thus, giving more options to Facebook grants it more flexibility to cater to different users’ needs.
However, this is just one of the reasons.
Another parameter to consider while analyzing Ad Set level data is frequency.
Understanding the “Frequency Metric” in FB Ads
Frequency is an important factor to consider if you’re running your campaign for a longer period of time.
An increase in frequency can lead to Ad Fatigue, where users can get tired of seeing the same ads.
This will in turn increase our Cost per Result value for the campaign, which can drain the budget.
A good rule of thumb is to reconsider your ads every time the Frequency value goes above two. You can monitor the frequency data at both the Ad Set and Ad level.

Apart from this, frequency is also an important metric to consider for retargeting campaigns.
For a retargeting campaign, your audiences are often very small (especially for iOS). So even if you’re running a lot of different ads, the frequency will still be high if you have a bigger budget.
The problem in such cases will not be the number of ads but the high budget that is used for a smaller audience. Using Ad Set Budget Optimization for those situations can solve this problem.
Next, let’s take a look at the ads data!
Analyzing Data at the Ad Level
You can find data for different ads under the Ads tab.
For the two ads that we ran in this campaign, one ad has the vast majority of this Ad Set’s Impressions and Reach.
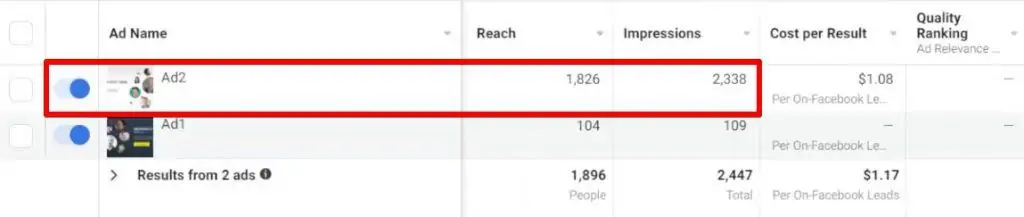
One of the ads has a majority of the impressions in a Facebook ad campaign.
Let’s open the two ads and compare them to see why one might be performing better.

The ads look similar—the most significant difference is the background color. We can see that the white background got more impressions (maybe because the color matches the Facebook platform).
A wise decision here would be to pause the ad with fewer impressions and add more budget and variables to the leading ad.
Moving ahead, let’s open another Ad Set with different ads to analyze it.
We can see that one ad has a higher reach and lower Cost per Result than the other. It’s important to note here that both the ads are running for the same audience.

What could be causing such a dramatic difference in ROI? Let’s open them up to see why.

We can see that again, both the ads have the same information shown, and the same background. However, the ad with a smaller icon of the company logo is preferred by our audience.
This may be because the audience already knows our logo—and when they can clearly identify it on the ad, that particular ad will get more impressions.
Try to figure out why some ads perform better than others so that you can improve future ads! You can test your hypotheses by adding new test ads to the campaigns.
Finally, we’ll also analyze the ad set that has the highest number of ads. We can see that one particular ad had a significantly higher reach than the other 16 ads in the set.

Let’s open that ad to see why.

We know that the MeasureMasters community is data-driven and is familiar with some of these faces. But what could have made the most difference is the featured image.
Since most of the community members know Simo Ahava for his work in this field, it is possible that this ad received the highest impressions.
Once you analyze multiple ads, you can combine characteristics of high-performing ads into a new ad to see if it performs better.
For example, from this guide’s analysis, we can create a test ad with the same featured image, white background, and a clearly visible logo.
Our analysis-informed ad would be successful if it’s able to reduce the Cost per Result.
Analyzing Frequency at Ad Level
Lastly, you can also monitor the Frequency metric at an ad level.
In our sample campaign, the Frequency probably won’t go above 2 to 2.5 because of the high number of ads and short campaign duration.
However, if the frequency increases, we should keep an eye on the Cost per Result.
If the ad is still performing well and generating leads, we might not want to pause it just yet.
On the other hand, if the ad increases our Cost per Result and its frequency is way higher than other ads’, it might be a good time to pause that ad.
In many cases, you can use that ad after making some changes to improve its performance—using data gathered from analysis like we did above. Remember to think about the user perspective when modifying the ads!
FAQ
Which metrics should I focus on when analyzing Facebook Ads campaign data?
The metrics you should focus on depend on the objectives of your campaign and the part of your funnel you are targeting. Upper-funnel metrics such as click-through rate (CTR) and impressions are important for attracting the audience, while lower-funnel metrics like cost per lead are essential for converting leads into purchases or clients. It’s important to align your metrics with your campaign objectives and desired outcomes.
What are some key metrics I should consider adding to my custom view?
Some important metrics to consider adding to your custom view include click-through rate (CTR), cost per 1000 impressions (CPM), cost per link click (CPC), and frequency. CTR helps measure the effectiveness of your ads, CPM allows you to assess the cost of impressions, CPC helps evaluate the cost of link clicks, and frequency indicates how many times a person saw a particular ad on average.
What is the importance of frequency in Facebook Ads analysis?
Frequency refers to the average number of times a person sees a particular ad.
Monitoring frequency is crucial to prevent ad fatigue and ensure the cost per result remains optimized.
High frequency can lead to diminishing returns and increased costs.
It’s recommended to reconsider your ads when the frequency value goes above two and adjust your campaigns accordingly.
Summary
So that’s all you need to know about how to analyze Facebook Ads metrics as a marketer!
As a beginner, you can start with pre-made templates to analyze your Facebook Ads results. But over time, you should start creating your own custom views and even custom metrics to measure your progress.
With more practice, you’ll be able to gather enough data about your audience’s preferences and eventually create tailored ads for them—thus minimizing your Cost per Result.
Before setting up your ad campaigns, you can also unlock some new Facebook audience interest suggestions for a more targeted audience.
What metrics do you include in your custom view? Are there any custom metric that gives you better insights into Facebook Ads results? Let us know how you like to analyze your Facebook Ads data in the comments below!


")