Do you find it hard to work with GA4 data in BigQuery?
Working with Google Analytics 4 data in BigQuery can be a real pain, even for SQL experts. Fortunately, we have a zero coding solution called GA4 SQL by Optimization Up. It is a free tool to query GA4 data without writing SQL code.
With just a few clicks, it will generate the SQL query for building instant reports in BigQuery, saving you time to focus on insights instead.
We’ll focus on querying GA4 data in this guide. If you need general SQL queries or to conduct analysis, go to our guide on How to Use BigQuery with ChatGPT, where we walk you through accessing and starting a project in BigQuery.
For this tutorial, we’ll use both tools, GA4 SQL for querying and ChatGPT for analysis. Whether you’re a beginner or an SQL pro, save time and hassle using GA4 SQL and ChatGPT when working with GA4 data in BigQuery.
Here is an overview of what we’ll cover:
- GA4 SQL Interface Overview
- Running a Basic Query
- GA4 Landing Page Report
- Google Ads Filter
- Cost Control Best Practices
Let’s dive in!
GA4 SQL Interface Overview
We will look at live examples, but first, let’s have a quick overview of the GA4 SQL interface.
To use the tool, head to ga4sql.com.
Optimization Up continues to provide updates for this tool. Now, this tool can query data from GA4 and the Google Search Console.
Select Google Analytics 4.
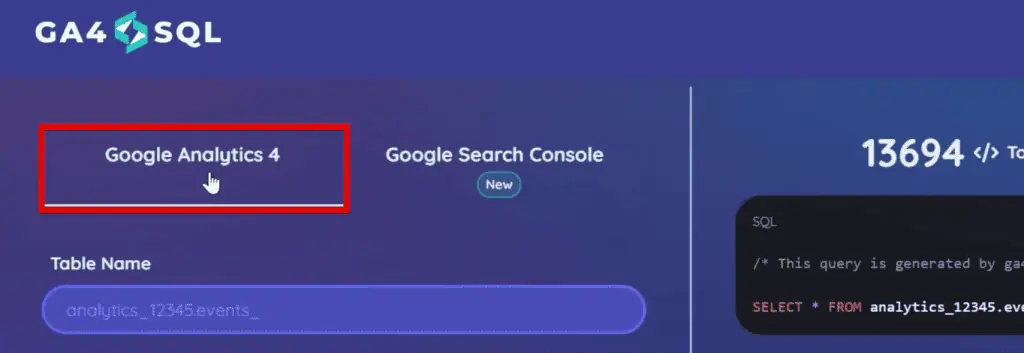
The first field we need to provide is the Table Name. Here, we’ll add the table ID, which we can fetch from the BigQuery details section.

Next, we need to specify the date range. Here, we have multiple date range presets, and we can also select a Custom date range.

Upon selection, we need to provide the exact start and end dates.

To query metrics or dimensions, click on the respective bar and select your metric.
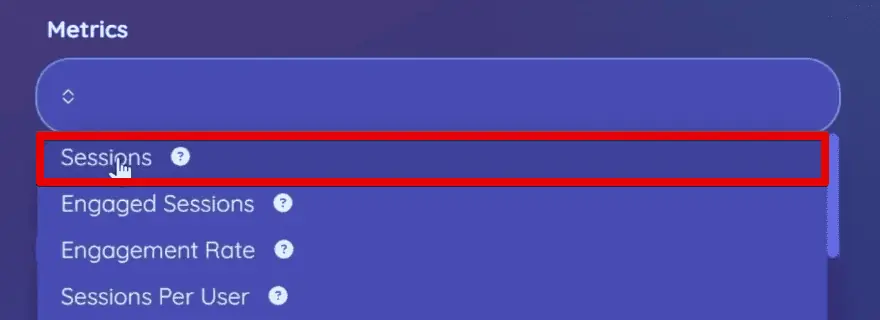
Do the same for dimensions.

Additionally, if you’re unsure what the dimension or metric is about, hover over the question mark beside the dimension/metric name to find out.

Another great feature is the Filters section. It allows you to filter your data based on the dimension or metric that you have added.

You can also Sort your data in ascending or descending order.

Lastly, you can fetch your Custom Metrics, as well.

🚨 Note: You can now import custom dimensions, as well!
Finally, once you have given the tool all this information, click Generate Query.

You can view and quickly Copy the code at the upper-right section of the screen.

Once you’ve copied the code, you can quickly paste this into BigQuery.
Running a Basic Query
In our example query, we’ll be using the BigQuery sample dataset for GA4.

In your BigQuery project, select your table. In the Details tab, copy the table ID.

In GA4 SQL, paste the table ID in the table name field. To avoid conflict with the date range selections, remove the date at the end of the table ID.

Back in BigQuery, let’s look at the available date ranges for our dataset. Click the date selection in between the table name and query button.

Here, you can see the daily dates grouped by year.

Next, we’ll select the date range. Let’s look at December 1, 2020, to January 30, 2021.

For the dimensions and metrics, we’re interested in looking at the number of sessions for each event. Select the Sessions metric and the Event Name dimension.

Generate the query and Copy the code.

Next, let’s compose a new query in BigQuery. Click Query → In New Tab. Next, add a new tab by clicking +.

Next, hide the Explorer section to allow more room to view our query.

Paste the code in the new query. Next, keep watching for the message in the top-right section.

We can check if our code is valid with the green check mark, and more importantly, we can check the size of our query. Since we are still dealing with megabytes, we are still within the free tier.
💡 Top Tip: If the query size is above gigabytes or terabytes, you will have to make edits to your query and make it fall back to the free tier. After trimming it down, if the size is still a gigabyte or more, only query the data you need to minimize costs.
Because we are dealing with a public dataset, we will incur no costs regardless of the size of our query. Think of these tips as best practices for when you query your datasets.
Let’s run our query. We have successfully queried the list of event names and the number of sessions for each.

Let’s move on to the following example, where we’re interested in recreating the landing page report.
GA4 Landing Page Report
We’ll keep the settings for the table name and date range.

Select the following metrics: Sessions, Engaged Sessions, Average Engagement Time Per User, Screen Page Views, Total Users, New Users, and Purchase Revenue.
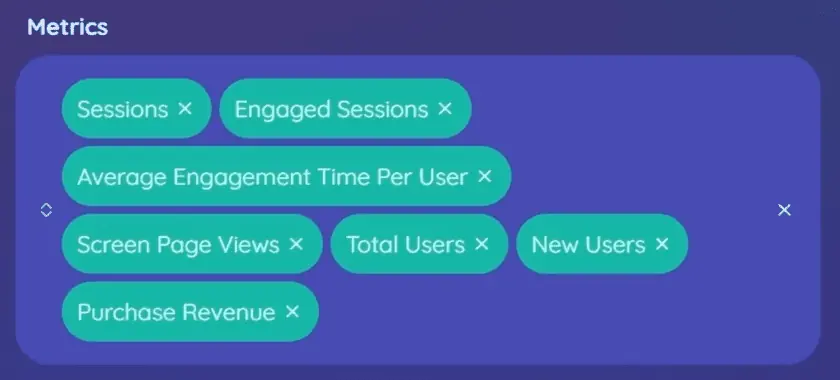
Next, select the Landing Page dimension.

The arrangement of our metrics in GA4 SQL will dictate the arrangement of the columns in our query. You can rearrange the metrics by dragging the metrics to the desired position.

Generate the query and Copy the code.

Paste and run the code in BigQuery. Here, we have successfully queried our landing page report.

So, we want to order our landing page report by the number of page views.
Go to the sort by section. Select Screen Page Views and Descending.

Let’s generate the query, paste the updated code and rerun the query. Now we have successfully sorted our landing page report by the screen page views.

Next, we want to take this further by only focusing on the landing pages receiving traffic from our advertising campaigns.
Google Ads Filter
First, let’s add the Session Source Medium dimension.

Now that we have this dimension loaded, we can use it for our filters. Add the filter: Session Source Medium contains CPC.

Generate the query and paste the updated code to BigQuery. Again, pay attention to the query size message.

Our query is processing around 1,000 MB, close to 1 GB. It is still within the free tier.
Again, don’t worry. We are using a free BigQuery public dataset, so no matter what, you will not pay anything. The constant reminder is to instill best practices so you don’t make mistakes when querying your company’s data.
Let’s run our query. Here are the results for our landing pages filtered by the traffic from our advertising campaigns with Google CPC.

💡 Top Tip: Wondering how to see Google Ads data in GA4? Check out our guide on How to Link Google Ads to Google Analytics 4.
Lastly, let’s look at some ways to limit our costs.
Cost Control Best Practices
Now is a great opportunity for us to look at how to use ChatGPT with the GA4 SQL tool.
We have two ways of limiting our costs: looking at shorter date ranges and limiting the number of columns we have in our results.
🚨 Note: Query costs are usually associated with the data type and the number of columns. The number of rows does factor in the pricing, but reducing the number of rows will not decrease the cost. BigQuery reads all column data first before selecting specific rows.
In this example, we would like to keep the session source medium filter, but drop the column in our results. We also want to limit the date ranges.

The GA4 SQL tool can handle the date range requirement, but it will be difficult to remove the session source medium since we used it in the filters. Therefore, let’s run everything with ChatGPT.
Let’s ask ChatGPT to drop the session source/medium column and only show the data for January 2021. Afterward, paste the code below the prompt.

ChatGPT will return an updated code. Click Copy Code and paste it into BigQuery.

Notice that our query size has been reduced from 1000 MB to 396 MB.

Let’s run the query. Here are our final results.

Summary
That’s how simple it is to use the GA4 SQL tool for BigQuery. We explored its interface and showed examples of how to run a basic query and use the filter and sort options. Finally, we also used GA4 SQL with ChatGPT for more complex queries.
Unlock the full potential of ChatGPT by learning How to Use ChatGPT in Digital Marketing. Here, you receive insights from niche experts and we also provide the prompts they use to get the best results.
Have you used the GA4 SQL tool before? What feature did you enjoy most? Let us know in the comments below!


