
Last Modified on July 5, 2023
Knowing the most popular pages through which visitors enter your website, means being able to improve and facilitate the beginning of their journey or the marketing paths you’ve designed to take them through. Entrances can help achieve exactly that.
Although their usefulness as a metric is sometimes debated, they typically play an important role in optimization by improving the first impression visitors have of your site and the pages where they enter your funnels, which ultimately leads to more conversions.

Master the basics with our FREE GA4 Course for Beginners
We will need some Google Analytics 101 to go over the definition of GA4 entrances and the different functions to clear any confusion you may have. We’ll also look at the meaning of other related dimensions and metrics and solve confusing analytics issues.
An overview of what we’ll cover:
- What Are Entrances in Google Analytics?
- Where Are Entrances in Google Analytics?
- What is the Entrance Rate in Google Analytics?
- Are Entrances and Sessions the Same?
- GA4 Entrances and Exits
- GA4 Entrances vs Landing Page
- What Is an Entrance in Google Analytics Funnel?
What Are Entrances in Google Analytics?
An easy way to understand entrances is that it represents the total number of visitors that entered your site through a specific page. Briefly, entrances reveal the start pages of the user journey. These are the first pages visitors land on when navigating a website.
This is the general understanding of entrances in marketing analytics, and it has been the definition used by the previous version of Google Analytics (Universal Analytics).
The Google Analytics Demo & Tools (a resource to help discover the Google Analytics platform) describes entrances as:
“The number of entrances to the property measured as the first pageview in a session, typically used with landingPagePath.”
However, this definition has been slightly modified in Google Analytics 4. GA4 entrances have been expanded to include the first events in a session that happened on a page or screen. You can read:
“Entrances is the number of times that the first event in a session occurred on a page or screen.”
This may sound a bit confusing since it has broadened the definition, replacing pageviews with events instead.
🚨 Note: In practice, it doesn’t make much difference. Pageview seems to remain the “first event.”
This makes sense since everything in GA4 (including pageviews) is considered an event. Despite the long list of GA4 events, pageview remains the main measurement linked to entrances.
We can easily verify how this works by creating an exploration report showing all events’ names and their associated entrances.
The exploration below was created in the Google Analytics demo, which uses data from the Google Merchandise Store.

Among all the events listed under the Event name, only Pageview or the page_view event is counted as an entrance.
It makes sense that the definition of GA4 entrances has been widened since GA4’s data model revolves around events rather than different hit types in UA (the most common being page-tracking hits, event-tracking hits, and eCommerce hits).
Where Are Entrances in Google Analytics?
You can use Explorations to see GA4 entrances, which should look like the following:

To recreate the report, follow these steps.
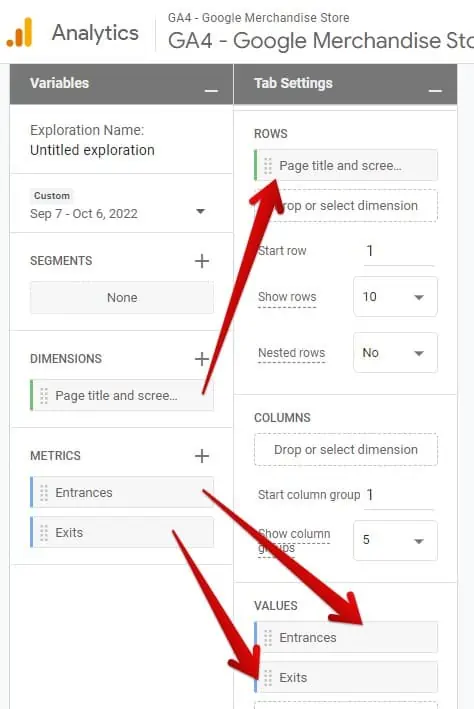
In Reports, use either Free form or a Blank exploration. We’ll use a Blank exploration to start from scratch.

Add the Page title and screen class dimension and the Entrances metrics. You can add Exits if you want to.
To add the Page title and screen class, click on the + sign, in Dimensions.

Start typing your dimension in the search bar and select it in the list of suggestions.
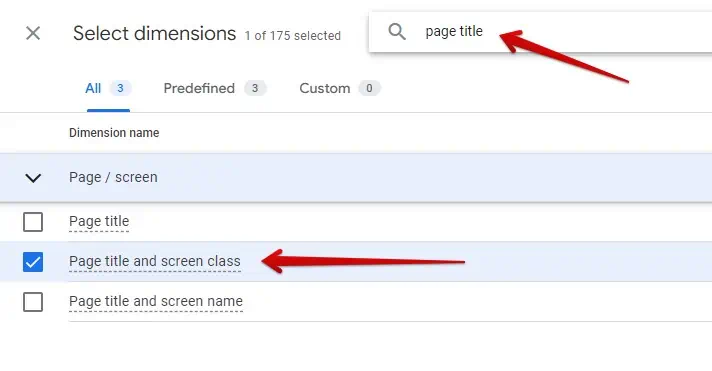
Click Import.

For Entrances, follow the same procedures using the metrics dimensions.
In this order, double-click on the Page title and screen class dimension, then double-click on your metrics. You can also drag Dimensions into Rows, and Metrics into Values.
What is the Entrance Rate in Google Analytics?
The entrance rate is the percentage defined as the number of entrances divided by the number of sessions. Calculation-wise, it’s pretty simple: Total entrances / Total sessions.
This percentage can act as a performance indicator. The higher your percentages are, the higher the number of visitors entering your site through a range of pages.
This metric can help determine if your marketing is working as intended. You can use this metric to assess what contributes to entrances, answering questions such as:
- Which units (traffic sources, devices, countries, etc.) are entering our site the most?
- Which units (traffic sources, devices, countries, etc.) are entering which steps of our funnels?
- Are our funnels working as they should?
The same applies to exits.
Are Entrances and Sessions the Same?
No, they’re not.
As you’re learning more about entrances, some words you’re probably familiar with keep coming up: pageviews, sessions, entrances, and exits. This is why it is important to have a clear understanding of what each term means.
We’ll do a quick recap of what sessions are, but check this post on the 10 metrics to better understand your user behavior for a more complete description of what these are and how they’ve improved from GA4 predecessors.
Sessions are a group of user interactions on a website during a time frame (usually 30 minutes). These interactions can be eCommerce transactions, page views, button clicks, video plays, etc.
To keep it simple, you can think of sessions as a group of pages viewed by a user in a given time frame. This image will help you understand entrances and exits in their proper context:

Number Differences Between Entrances and Sessions
Many Google Analytics users wrongfully assume that the number of sessions and entrances should be the same. After all, if a user enters your site, doesn’t that mean they’ve started a new session? Well, not necessarily.

In many cases, you will notice discrepancies between the two metrics. That occurs because sessions, as opposed to entrances, don’t require pageviews to be counted. An event can start a session. Some sessions can even begin without a page being viewed.
Let’s look at an example of a user on Page A who clicks on a link to download a file.
If the file URL is on another location, let’s say page B, then an event from page B will be triggered. A session will start from page B and start a session, even though the user has not viewed page B.
Another example is when a tag is fired before a pageview tag. In both cases, a session is started because there was an interaction although there weren’t any pageviews.
🚨 Note: GA4’s new data model considers every measurement option as an event, including pageviews. This section uses terminology related to GA3 (Universal Analytics). They both work similarly.
We will discuss and clarify the entrance and exit metrics in detail later in the funnel visualization section.
GA4 Entrances and Exits
Exits are the last pages that visitors see before leaving your website. You can think of exits as the end of a journey, and it’s important to understand why they are occurring.
As we saw with entrance rates, you can use exit rates to understand how specific pages are performing. Use this metric to ask questions such as:
- Does it make sense that people are leaving the website on this page?
For example, a contact page with a high exit rate makes sense. Visitors filling out a contact form are not usually incentivized to stay on the website.
On the other hand, a page where users begin the checkout process with a high exit rate might indicate a red flag, since they’re not completing the steps needed to purchase a product.
GA4 Entrances vs Landing Page
Some wonder why landing pages and entrances differ. Don’t they measure start pages the same way?
The main difference is that GA4 entrances are a metric, and the landing page is a dimension. Secondly, entrances and landing pages deal with pages from different viewpoints.
- The landing page looks at the pages through which visitors entered your website.
- Entrances look at all the pages of your website, whether visitors entered through those pages or not. It tells you how many times each was the starting point of a session.
Entrances should also not be confused with pageviews. In one session, pages can be viewed and counted multiple times. Entrances on the other hand are registered once per session.
In the example below, page A is the entrance page, it is where the session started. However, before exiting the site, the visitor viewed Page A multiple times.

In this scenario:
- Entrances for page A: 1
- Pageviews for page A: 3
How Do You See Landing Pages in GA4
GA4 doesn’t have a dedicated landing page report as GA3 did.
However, you can find that information by building an exploration. There is another way to create a Landing page report, but the one we’ll show you is recommended.
Follow these steps to build a landing page report.
Go to Explore and create a new exploration as we did earlier in the ‘Where Are Entrances in Google Analytics section.’ Add a Landing page dimension by clicking on the + sign.
Start typing ‘landing page‘ in the search bar and select Landing page.

Repeat the same for metrics. Add these metrics:
- Views
- Sessions
- Engaged sessions
- Total users
- New users
- Returning users
- Engagement rate
- Average Engagement Time per session
- Conversions (or Purchase, it’s up to you)
- Total revenue
🚨 Note: You may be limited to only 10 metrics.
Double-click on the Landing page dimension or drag it into Rows under Tab Settings.
Repeat the same, but this time for all the metrics we selected. Double-click on each or drag them into Metrics under Tab Settings.
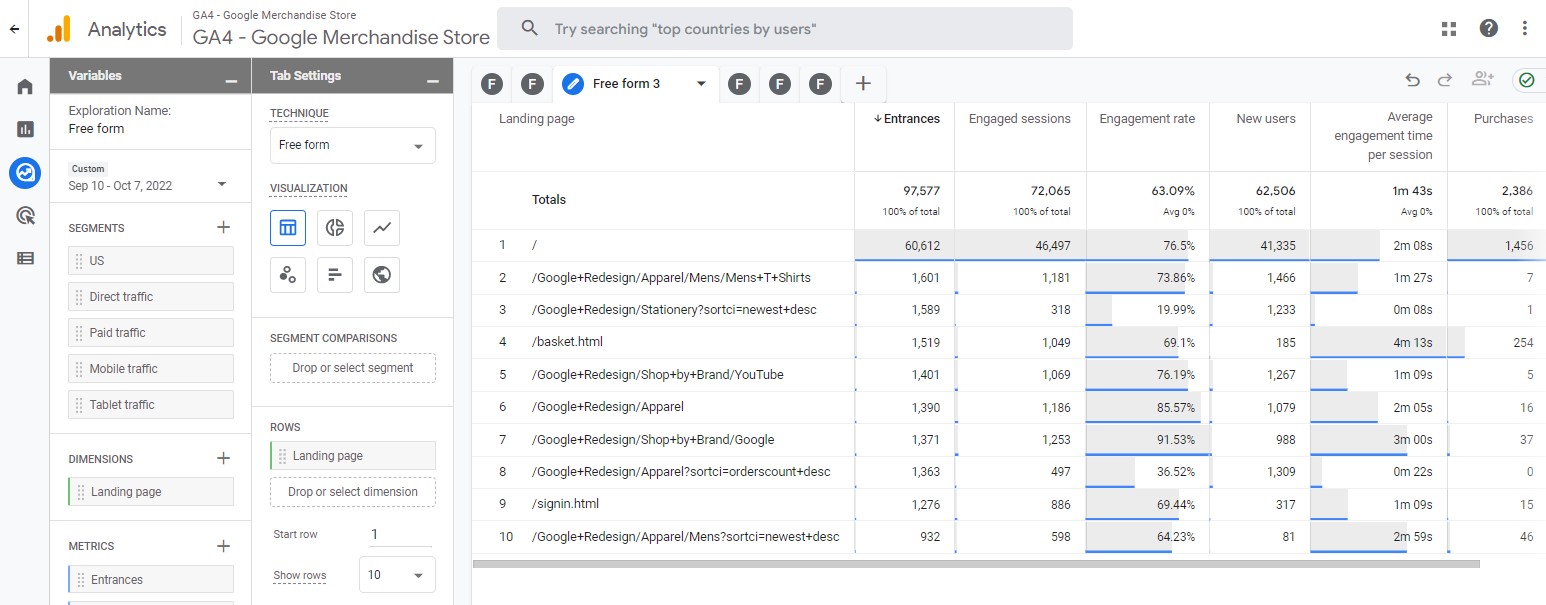
Here’s the report that you’ll get:

This landing page report is very similar to the one used in Universal Analytics (GA3). This is why we didn’t add entrances here, as well as being limited to 10 metrics.
However, you could use entrances. Here’s a quick Landing page report with GA4 Entrances.
Here we can see the number of times users entered a page, how engaged they were on these pages, and where they completed a purchase. We can also see which pages brought the most revenue (optional).
Add these metrics:
- Entrances
- Engaged sessions
- Engagement rate
- News users
- Average Engagement Time per Session
- Purchases (optional)
- Total revenue (optional)
What Is Entrance in the Google Analytics Funnel?
The funnel visualization is a visual representation of the conversion process. Each step of that process represents either a pageview or an interaction you expect visitors to take.
Starting from making them aware of your offering, visitors are led through the steps until the last one, which consists of taking the action you want (e.g., a purchase, subscribing, sending a form, etc.).
In this context, GA4 entrances and exits let you see where (which pages) visitors enter and exit the conversion funnel.
Entrances and Exits Issues in Google Analytics Funnels
Although the focus of this post is GA4, some may still be using GA3 or other platforms with similar models.
While very useful to identify conversion opportunities and bottlenecks, It is worth noting that the Funnel Visualization report (not available in GA4) doesn’t show the exact steps users take in your funnel.
This implies that entrance and exit pages sometimes won’t appear in the funnel steps the way you’d expect, leading to a lot of confusion. This is mainly due to issues such as backfilling, how GA assigns the order of funnel steps, and timed-out sessions.
In the case of backfilling, GA will fill the steps of your funnel that were skipped. This happens also with tools other than GA like Matamo.
When it comes to the order of funnels, GA states: ‘The entrance to the funnel is always assigned to the step in the user’s path that was highest in the funnel (i.e., the step with the smallest number), even if the user actually entered lower in the funnel.’
In other words, GA reorders the steps of the user journey into the order of those you initially configured for your funnel.
Lastly, sessions that timed out can explain strange entrances. For instance, when coming back to complete your purchase, the page where you left can be counted as an entrance, even though this isn’t where you started.
Pretend that entrances occurred at a Review.

That wouldn’t look right, correct? This is the second to last step before the purchase. Before reviewing their order users must select a product, add it to the cart, fill in their info, etc. So how could this be?
Dead sessions (like navigating away from the site for more than 30 minutes) or visits from different traffic sources can be responsible for unusual entrances.
The goal flow report in GA3, however, will show you the actual back and forths of users without these ‘forced’ adjustments.
Check out the funnel visualization reports in Google Analytics for more details.
Do not wear yourself out trying to figure out the perfect funnel, as the users probably won’t navigate through it exactly as expected. Instead, focus on identifying the biggest drop-offs and fixing them.
FAQ
Where can I find entrances in Google Analytics?
You can view entrances in Google Analytics by using the Explorations feature. By creating a report with dimensions such as Page title and screen class, and metrics such as Entrances, you can analyze the entrances to your website.
How are entrances different from sessions?
Entrances and sessions are not the same. Sessions refer to a group of user interactions on a website during a specified time frame, while entrances represent the specific pages through which visitors entered the website. There can be discrepancies between the number of entrances and sessions due to events triggering sessions without pageviews.
What are entrances in Google Analytics 4?
Entrances in Google Analytics 4 represent the total number of visitors who entered a website through a specific page. It is the first page that visitors land on when navigating a website.
How are entrances defined in Google Analytics 4?
In GA4, entrances include the first events in a session that occurred on a page or screen. Although the definition has broadened to include events, pageviews remain the main measurement linked to entrances.
What is the entrance rate in Google Analytics 4?
The entrance rate is the percentage calculated by dividing the number of entrances by the number of sessions. It indicates the proportion of visitors who enter a website through various pages. Higher entrance rates can be a positive performance indicator.
What are exits in Google Analytics 4?
Exits are the last pages that visitors see before leaving a website. Analyzing exit rates can help understand if specific pages are performing as expected and identify potential issues or opportunities for improvement.
How do entrances and exits relate to the funnel visualization in Google Analytics 4?
In the context of the funnel visualization, entrances and exits help identify where visitors enter and exit the conversion funnel. This information can be used to analyze the performance of specific funnel steps, identify bottlenecks, and improve the user journey.
Summary
The perceptions you’re creating the first time you meet others can have a big impact on your future success and interactions. The same goes for websites and apps.
GA4 entrances are important and can tell you a lot about the first impression users have of your site overall, or how they’re entering the funnels you have set.
Check out our guide on how to create a funnel exploration report in GA4 to draw more important insights from your data.
You can use this information to improve different areas of your site to create opportunities and improve user experiences.
Master the basics with our FREE GA4 Course for Beginners


")