
Last Modified on January 7, 2025
Have you ever seen zeros, unknowns, or no data in your Looker Studio dashboards?
These are indicative of missing values in Looker Studio. Other examples include null and N/A. While these are common, they aren’t the most desirable thing to see on your reports.
Your first reaction may be to remove them from your reports, but this may introduce more issues than leaving them in. Depending on how you handle the missing values, your changes can significantly impact your analysis and lead users to incorrect conclusions.
In this tutorial, we’ll explore the safe methods to handle null values in Looker Studio. We’ll look at how to deal with them to ensure your analysis is as reliable as possible and share a few tips to avoid traps.
Here is an overview of what we’ll cover:
- Identifying Missing Values
- When to Keep/Remove Missing Values
- Using Filters to Remove Null Values
- Adding a Control to Remove Null Values
- How to Convert Null Values into Zeros
- Null Values Data Types
Let’s dive in!
Identifying Missing Values in Looker Studio
Missing values, like duplicates, are known to be troublemakers for data analysis, and they can show up as different names. Here are a few examples:

The best way to deal with missing values is to go to your data source and clean the missing data. However, there may be various reasons why you may want to do it within your visualization tool.
You may only have a small data set or don’t want to use another tool. You could also not have access to the data set or only need to edit the report.
Now, let’s jump into Looker Studio to start the process.
We first need to identify if we have missing values or not. A quick way to do this is to have a global view of your dashboard and find if there is any information referring to missing data.
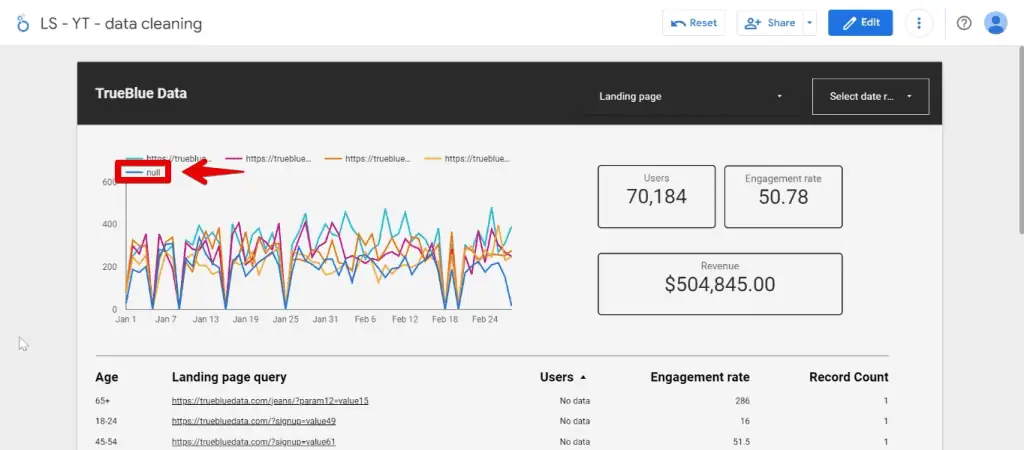
For example, inspect the time series chart that breaks down the campaigns by their URLs.
If you pay attention to the legend, you’ll see this null value, which represents missing values in Looker Studio. So we know that we have missing values in this chart.
Identifying missing values in Looker Studio tables is trickier because they can have different names in the same column. To find them, sort the dimension or metric you need by clicking on the header.
For example, let’s look at the Age dimension. Click the header.
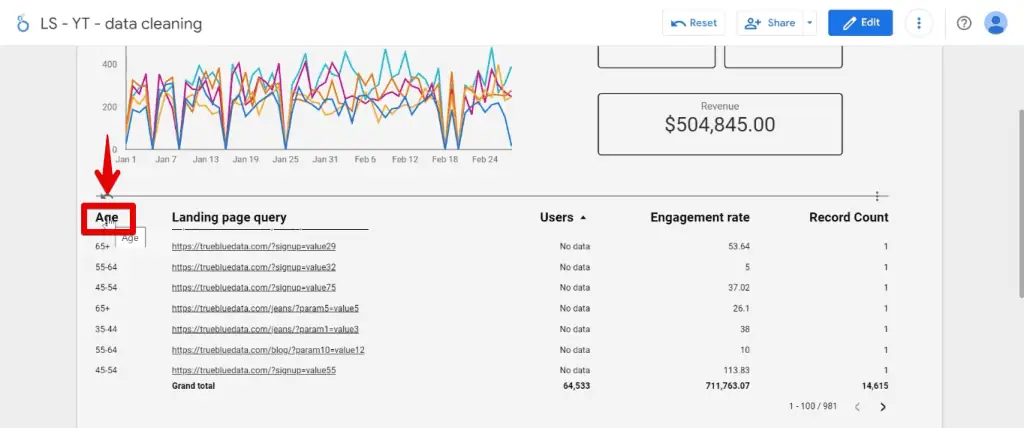
Here, we see that we have the No data value type.

Here comes the tricky part. If we click on the header again, we can see another type of missing value, which is unknown.

It is imperative to identify if there are missing values in Looker Studio and understand the makeup of your data before making any changes. Afterward, we must decide what to do, either keep or remove them.
There are different rules of thumb for this. Usually, it’s safe to keep any missing data that make up less than 20% or 30% of your dataset. A higher percentage would necessitate removing those data.
You should know that each business has different standards for this. Some may have 50% of missing data and still decide to keep it because you can still get good insights despite a large margin of error.
When to Keep/Remove Missing Values
In our case, should we keep or remove these missing values in Looker Studio?
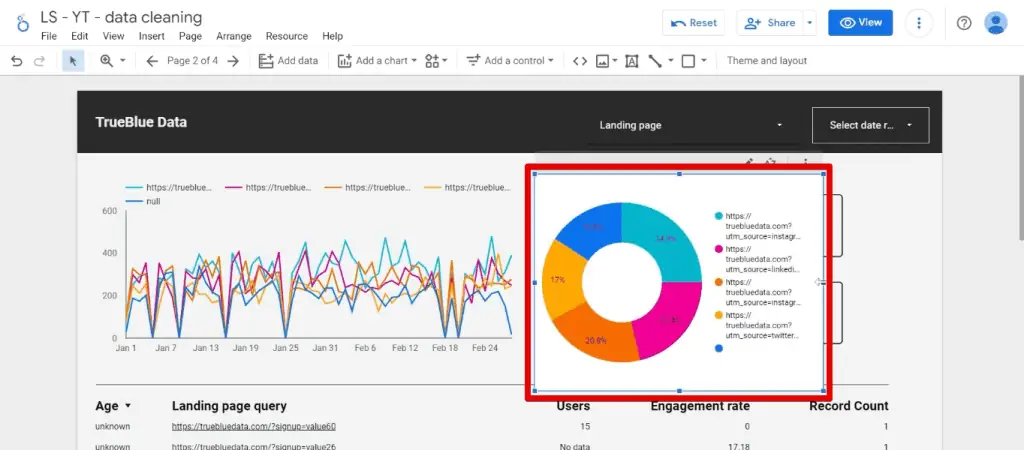
A good trick I use to aid in this decision is to use a chart to identify the proportion of missing data. What I like to do is use either a pie or donut chart.
The donut chart below reflects the proportion of landing pages shown in our time series chart.
Looking at the legend, you’ll find a blue dot at the bottom with no data, representing missing values in Looker Studio. Once we select this, we can see that our missing values take up 15.8% or around 16% of our dataset.
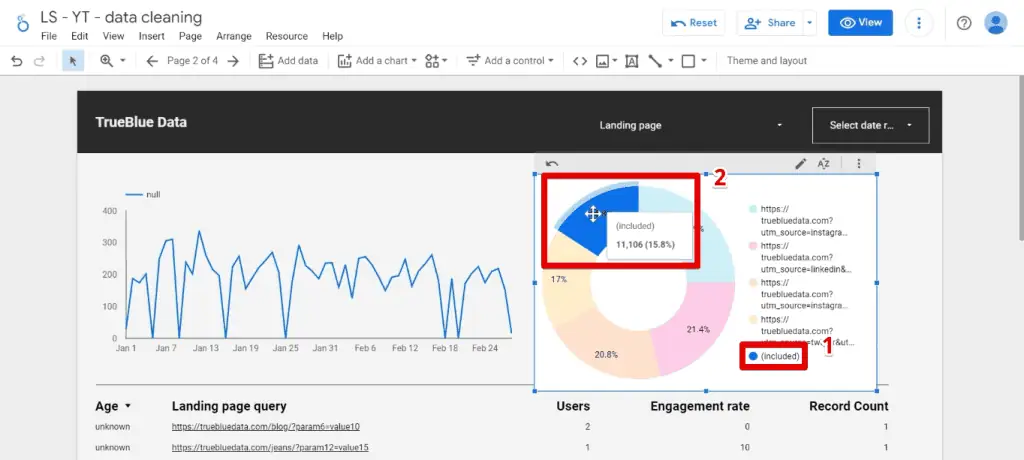
This percentage is less than our 20% or 30% threshold, so it’s safe to keep these values for our analysis.
There are two ways to fix missing values in Looker Studio: a cosmetic solution that will not impact your data and one that will.
Next, we’ll explain two ways to remove null values in Looker Studio.
1. Using Filters to Remove Null Values
There are two remove null values in Looker Studio:
The first method includes using a filter to remove values from the display.
1. Adding a filter to the chart entails selecting it, then clicking Add a Filter.
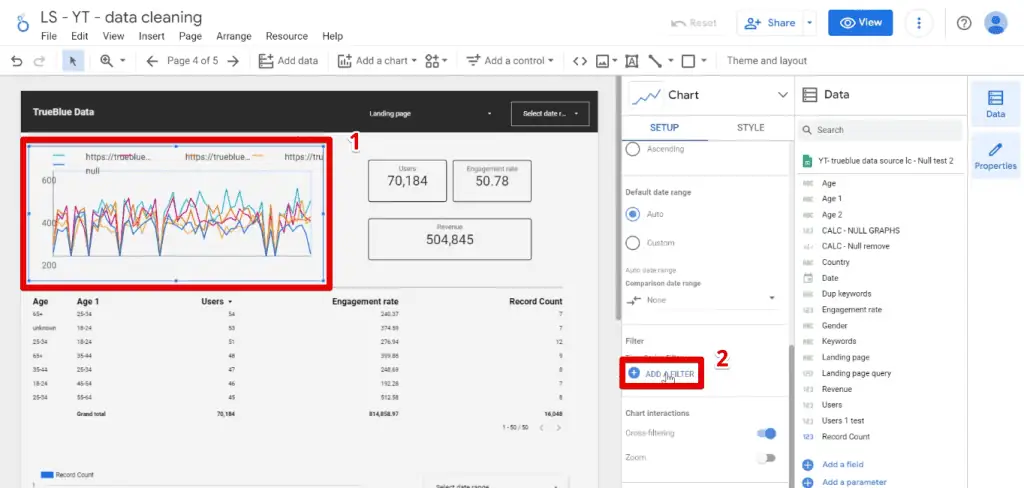
2. Next, we’ll use the following formula for our filter:
Exclude Landing page Equal to (=) Null3. Provide a name to the filter, input the above formula, then click Save.

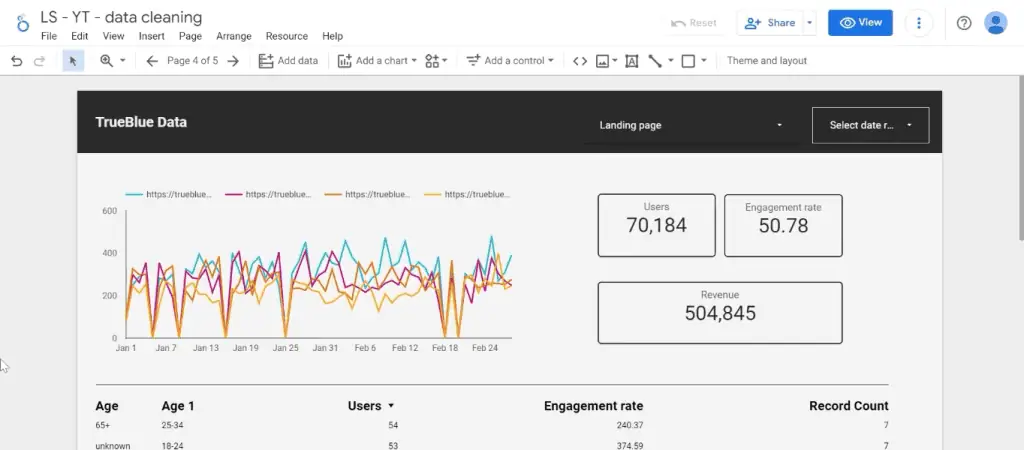
We have removed the null values from the chart and its legend while retaining metrics values such as revenue and the number of users.
Next, let’s look at the second method.
2. Adding a Control to Remove Null Values
Let’s pretend we have 30% of the missing data we want to remove.
1. A quick way to do this is to use data controls. Click Add a Control → Drop-down list.

2. Next, add the dimension you want to analyze. For our example, this is the landing page dimension.
We already have this created beside our date range control.
💡 Top Tip: Check out our guide on How to Make Looker Studio Dashboards Interactive to learn more about data controls, date range filters, and data source controls.
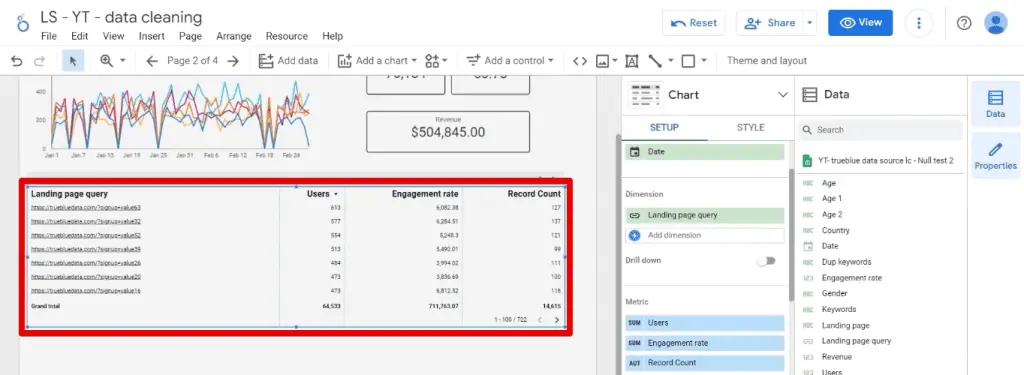
3. When we select the data control drop-down list, we will see a list of the different landing page URLs in our report. Unselect the null values to remove missing values in Looker Studio.
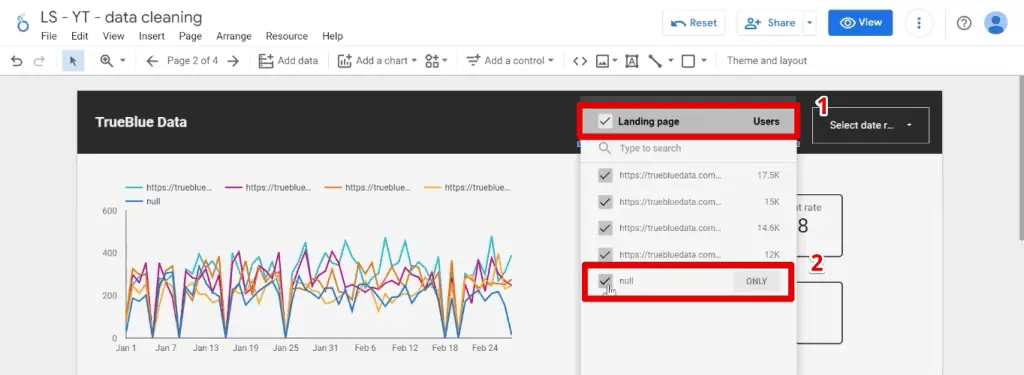
Notice the null values removed from the time series chart, and that the number of users, engagement rate, and revenue have dropped.

Please be cautious with this method because you may exclude other insightful data.
Let us see how excluding missing values this way works and its implications. Because we use data from Google Sheets, we will use it to understand what is happening in the background.
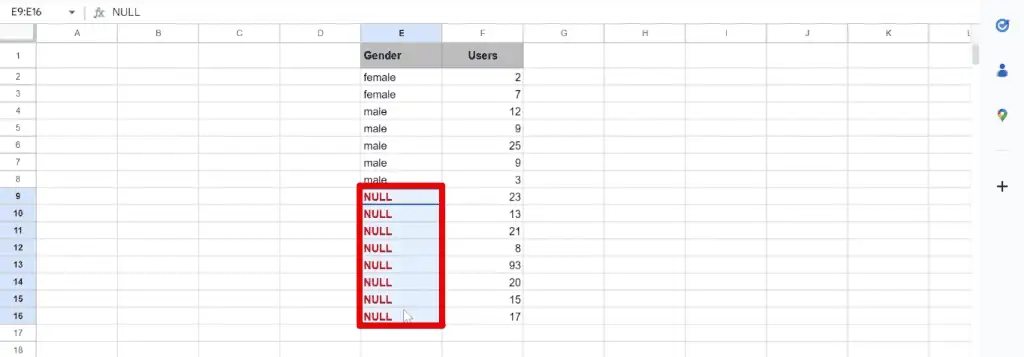
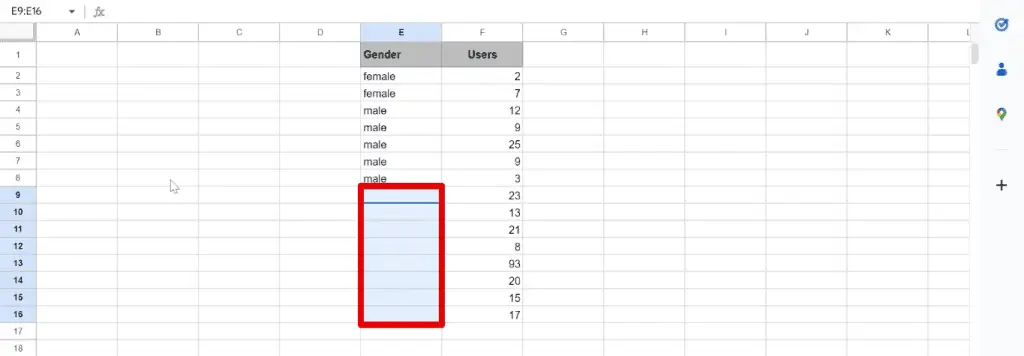
We have two columns: one for gender and another for the number of users. This sheet lists how many users we have for males and females.
In the gender column, you will see the NULL values in red.
Ideally, what we expect to happen when we use the data control method is to delete the null values, and keep the number of users similar to how it is displayed below:
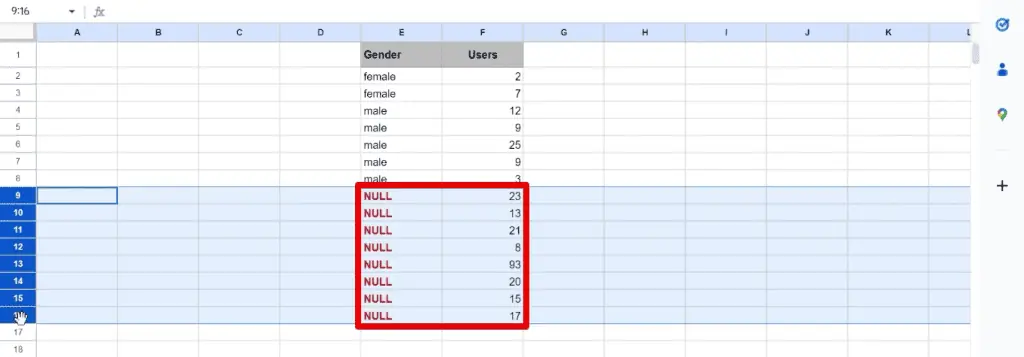
However, this is not the case for data controls. Instead, Looker Studio looks at all the rows containing null values and removes the row contents entirely.
Deleting rows of values will not be much of an issue if you use a variable like an ID number because they are irrelevant to your analysis.
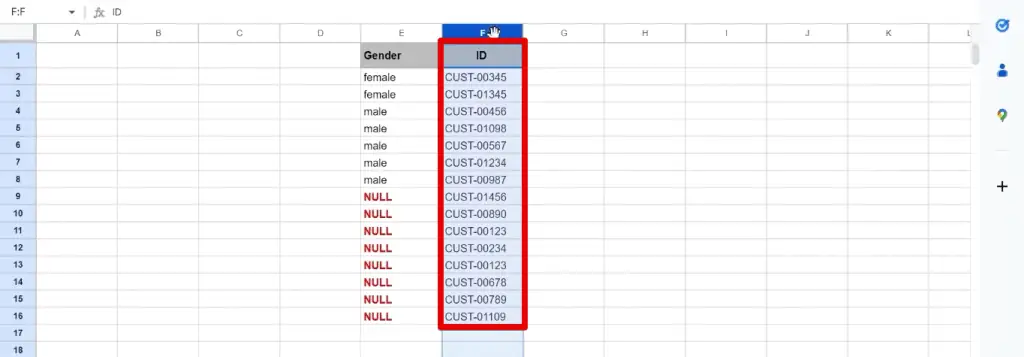
Since you cannot use these ID numbers for your calculations, removing null values will have no consequences. In the case of revenue, however, deleting rows of data would be problematic.
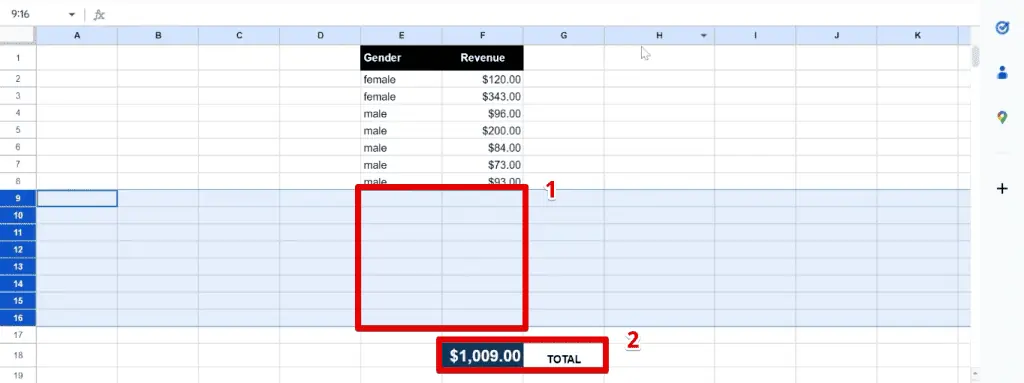
For example, this table shows the revenue generated per gender. Similarly, there are null values for gender. We have $3,000 in total revenue.
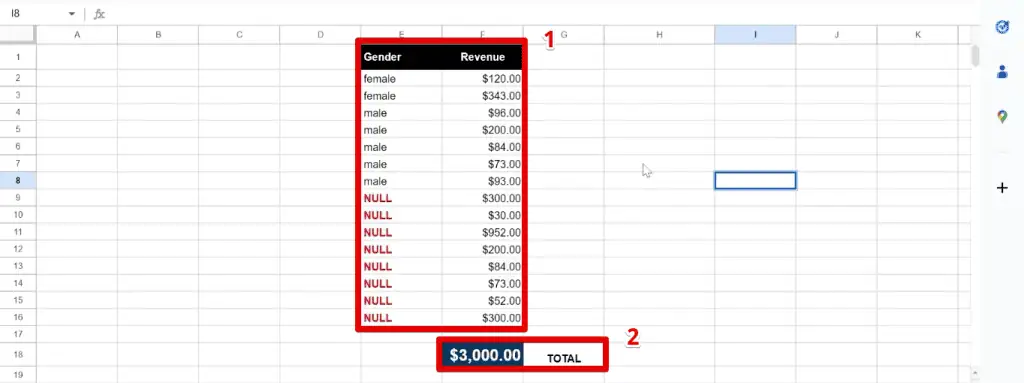
If we remove null values using data controls, we will significantly impact the total revenue, reducing it to a third of its original value. The new total is now $1,009.
Now, let’s bring back our null values to see our total numbers.
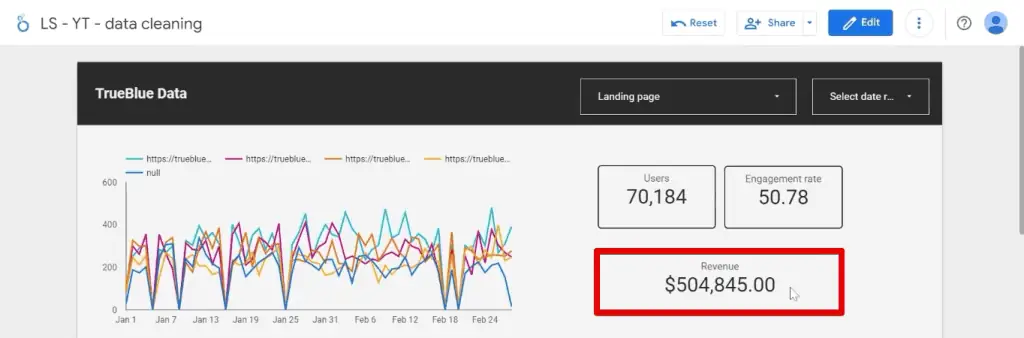
We have around $500,000 in total revenue. After excluding null values, this number drops to nearly $400,000, a decrease of approximately 16%.
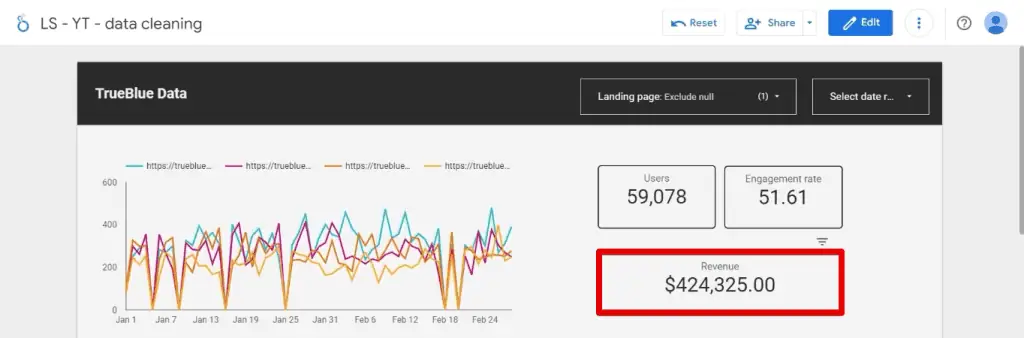
In web analytics, some decrease is okay because analytics platforms will never give you an exact number as precise as those you will find in your CRM or shopping cart.
Still, we do need thresholds when it comes to revenue. Usually, removing missing values in Looker Studio that account for less than 5% of your data is acceptable. Since we are above this threshold at 16%, we must keep our null values.
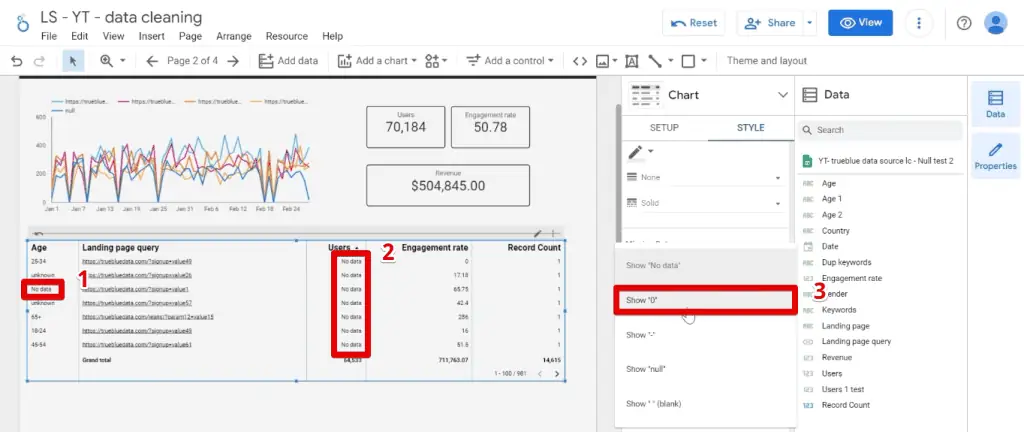
Looker Studio has a native way of dealing with missing values. Look at the table to see how this works and sort the Users column. Notice our missing values showing as no data.
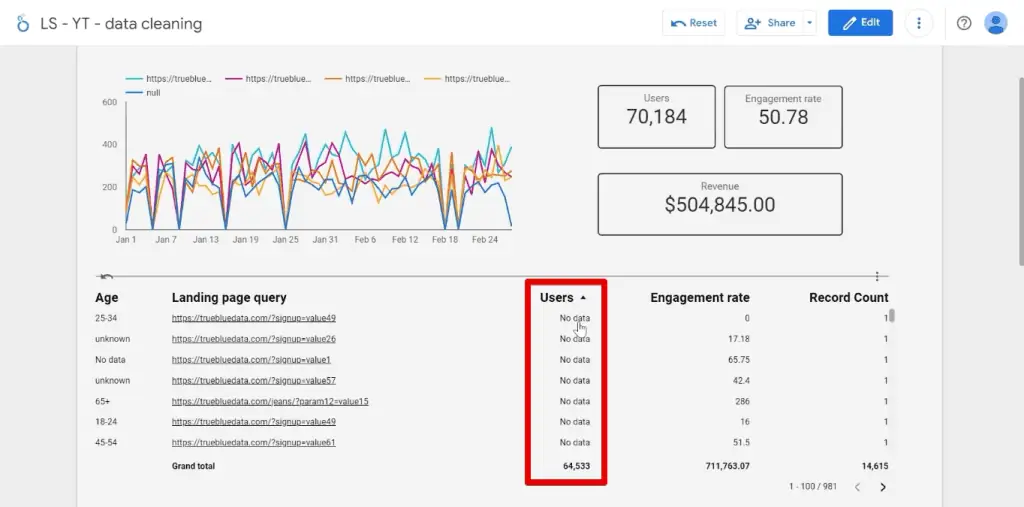
It is best practice to show missing values as zeros, particularly for metrics.
How to Convert Null Values into Zeros
Here’s how to convert null values into zeros in Looker Studio:
1. Select the table, go to Style, and scroll down to the Missing Data section.
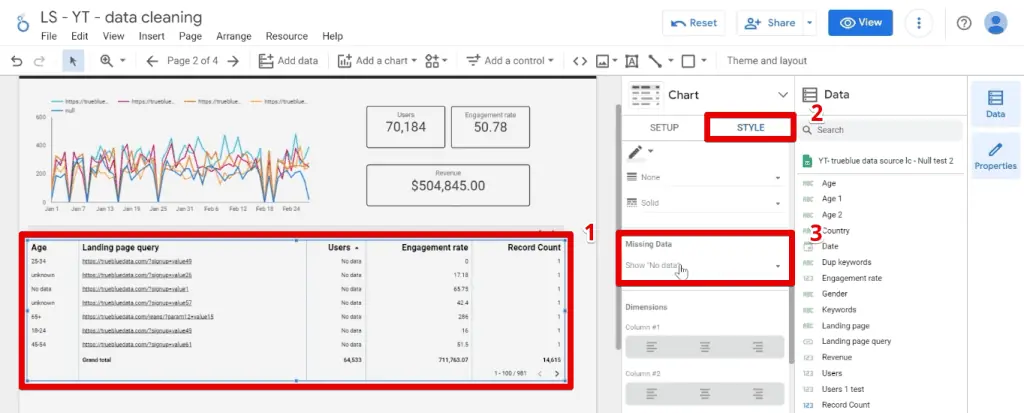
This section allows us to choose how missing values should show up. We currently set it to show no data. If you go to the age and users column, you will see this no data value type.
💡 Top Tip: To learn more about Looker Studio charts, their properties, and types, check out our Google Looker Studio Charts to Create Stunning Reports guide.
2. To change how missing values in Looker Studio tables show up, select Show 0.
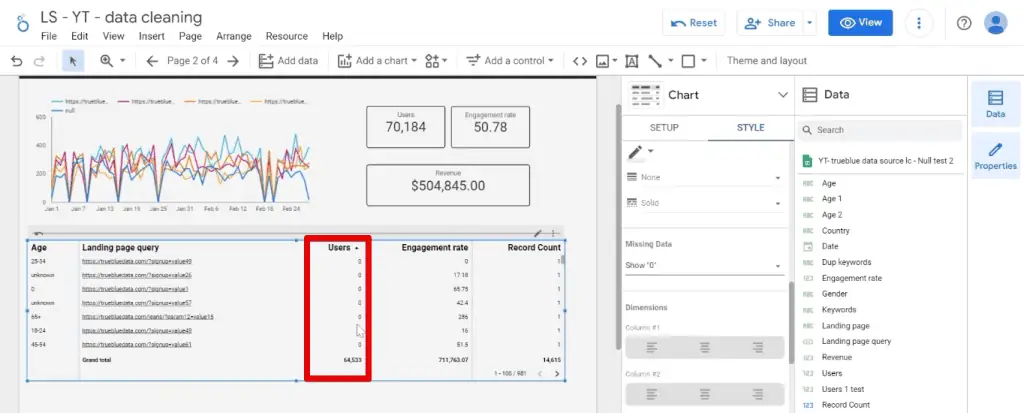
The missing data now show as zeros, while the total number of users remains the same.
When deciding whether to remove missing values, you should consider values that become irrelevant. Let’s have a look at the age dimension again.
For this, we inserted a pie chart to show the distribution of ages.
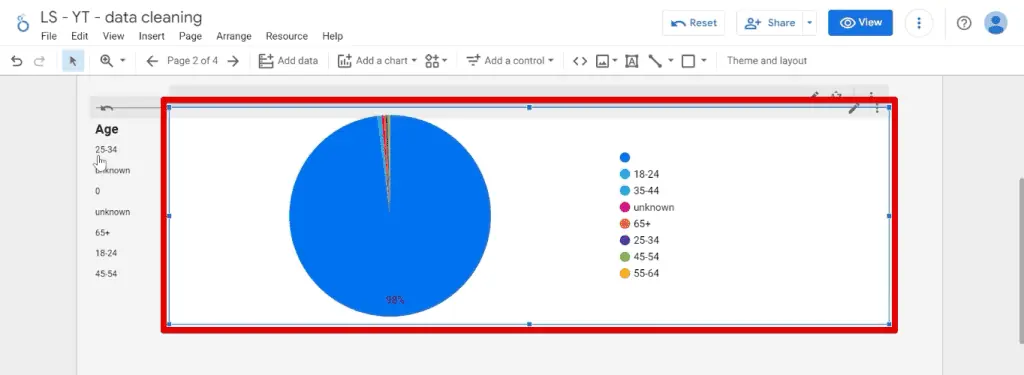
We can find our null values by clicking the blue icon indicating no values. Here, an overwhelming majority of the data, around 98%, is missing data. We have unknown values, as well.
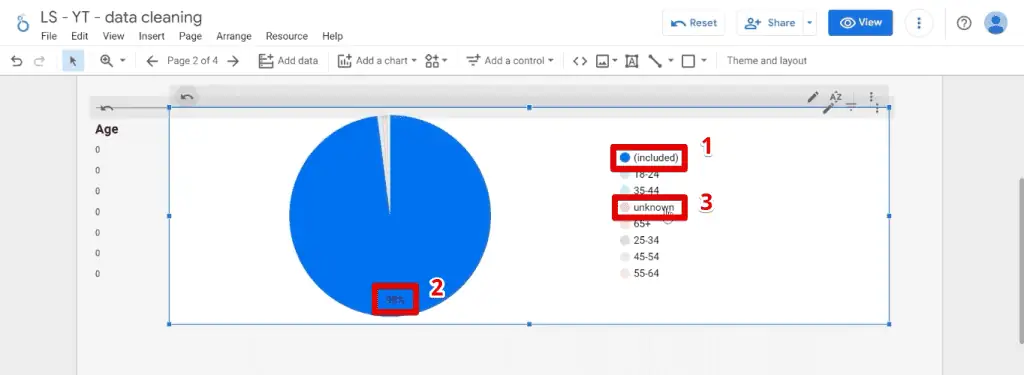
Since nearly 100% of our data is missing/empty, the age dimension is irrelevant, and we should remove them from the report. Remove the pie chart and the age dimension from the table.
The last thing to pay attention to is data types.
Null Values Data Types
When dealing with missing values in Looker Studio, there are times when the column data type is stored incorrectly, which often leads to wrong conclusions or odd results.
We’ll inspect this scatter plot by looking at the relationship between the number of sessions and the total revenue.
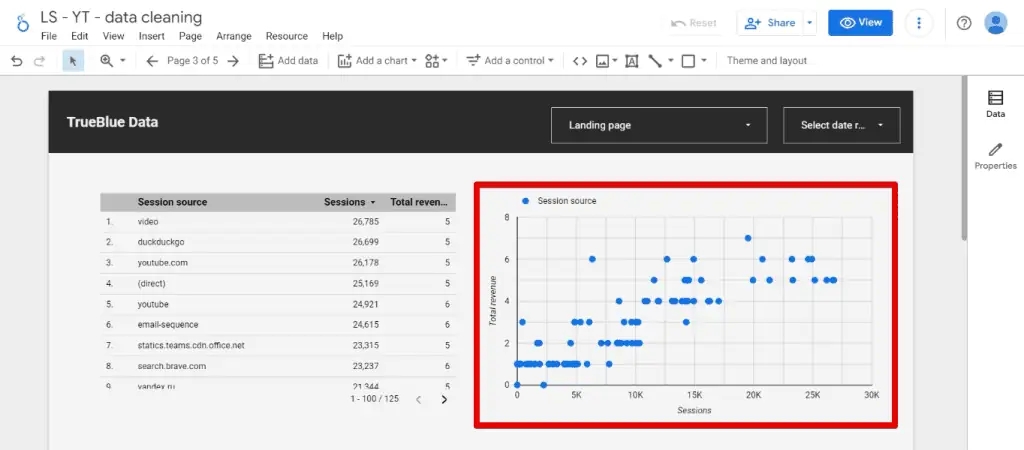
Even if your business is struggling, it is odd to have single-digit revenues. We pulled this data from a spreadsheet where we highlighted missing values in blue.
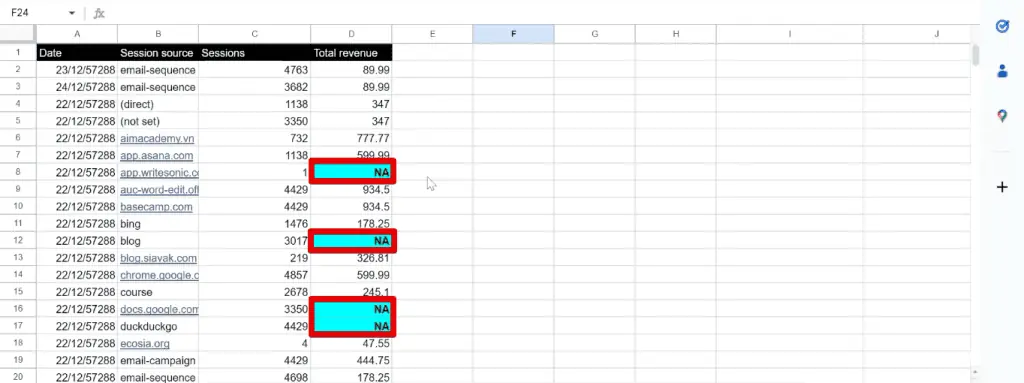
If we select the chart, the total revenue has the ABC icon, which indicates values assigned as dimensions. Since we have NA values in the spreadsheet, Looker Studio mistakenly stored the column as a dimension.

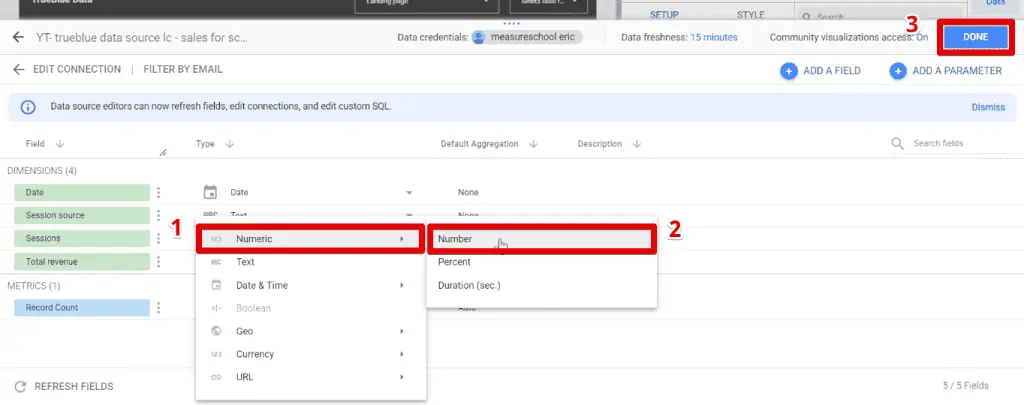
Metrics, like Sessions, will have 123 icons. To change how the total revenue is stored, select Edit data source.
Go to total revenue and click Text under the type column.

Next, select Numeric → Number. Save the changes by clicking Done.
Changing data types does not result in immediate changes. Sometimes, your charts might also break. What we need to do is replace the old value.
Here, we have the Total revenue in the metric section with the CTD icon.
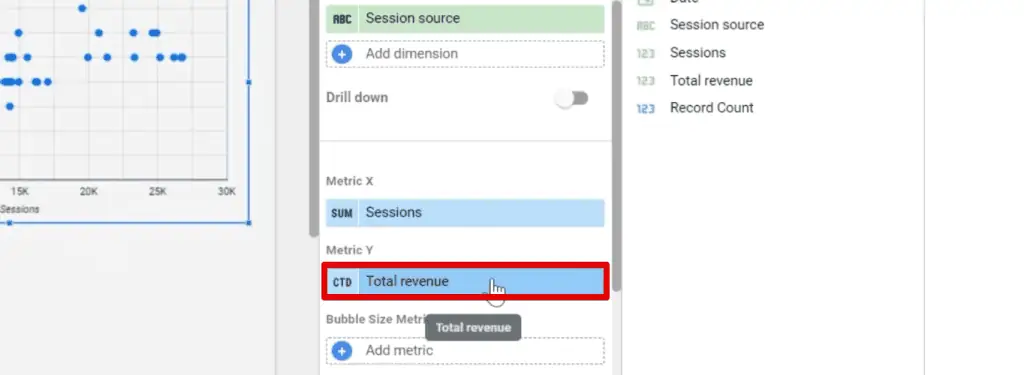
Looker Studio aggregates dimensions or non-numeric data using Count Distinct (CTD). Replace this dimension with Total Revenue with the 123 icons.
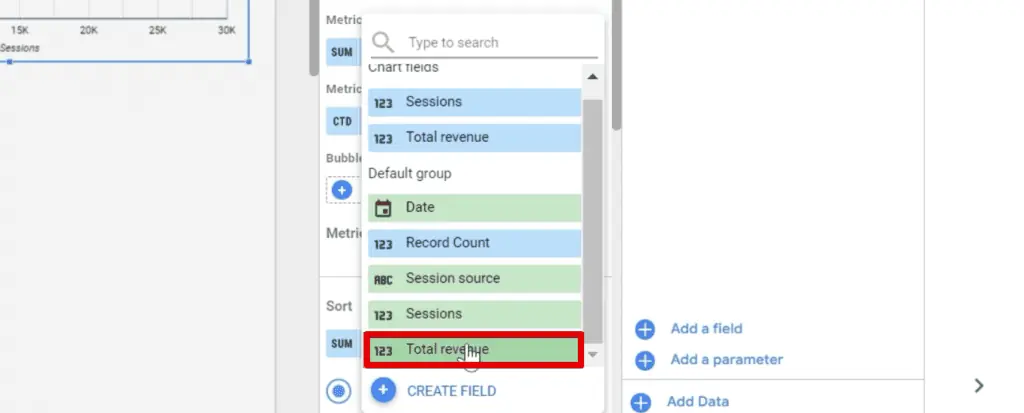
To see the changes we made, refresh the page. We should now see the correct numbers in our scatter plot.

If you prefer, another option is to rebuild the chart.
FAQ
Should I keep or remove missing values in Looker Studio?
The decision to keep or remove missing values depends on various factors. Generally, it’s safe to keep missing data that makes up less than 20% or 30% of your dataset. However, different businesses may have different standards based on their specific needs and analysis requirements.
How can I remove null values from a chart in Looker Studio?
You can use filters to remove null values from a chart. Add a filter to the chart, specifying the condition “Exclude Landing page Equal to (=) Null” (adjusting the condition based on your specific use case).
Can incorrect data types affect the handling of missing values in Looker Studio?
Yes, incorrect data types can lead to wrong conclusions or odd results. It’s important to ensure that the data types are set correctly. Looker Studio provides options to change the data type and replace incorrect values with the appropriate ones.
Summary
Great! We have covered how to identify missing values in Looker Studio. Next, we looked at different approaches to handling them, one aesthetic solution and another that impacts your analysis.
There are other improvements that we could make to this dashboard. We discussed some of them in our guide on How to Overcome GA4 Limitations with Looker Studio. These techniques can apply to other datasets, not just from GA4 data.
Do you have missing values in your dashboards? Which approach will you be using? Let us know in the comments below!


")