Last Modified on February 5, 2025
Do you want to know the difference between Microsoft Clarity vs Google Analytics?
Microsoft Clarity is arguably the most complementary tool to Google Analytics 4 (GA4) outside of those in the Google Marketing Platform.
Clarity is designed to help you understand exactly what your visitors are doing on your website; whereas GA4 provides a broader overview of your website’s performance, focusing on metrics such as user acquisition, engagement, and conversions.
🚨 Note: We will explore the essential aspects of these tools without covering installation. Please check the FAQ section at the end to learn more about the tools or read their documentation.
We are going to cover these key points to differentiate Microsoft Clarity vs Google Analytics:
Let’s dive in!
Cost
Both tools are free to use. However, Google Analytics has a paid version known as GA4 360 for enterprise-level businesses.
Although very similar to the free version, GA4 360 allows you to collect, report, keep, and export more data. It also includes dedicated technical support.
Microsft Clarity remains free for all. Both tools can be tried via their free demos. Clarity is accessible without registration.
The Google Analytics demo account requires a Google account; once registered with your Gmail, you can access the Google Merchandise Store (web data) and Flood-It! (app and web data).
Integration
Microsoft Clarity offers third-party integrations, including GA4. We’ll focus on this integration in this article. To enable this integration, you’ll need to install Clarity on your website first.
There are different ways to install it, but here is the recommended method.
Connecting GA4 creates a GA Dashboard in Clarity, letting you analyze GA4 data with Clarity’s features.
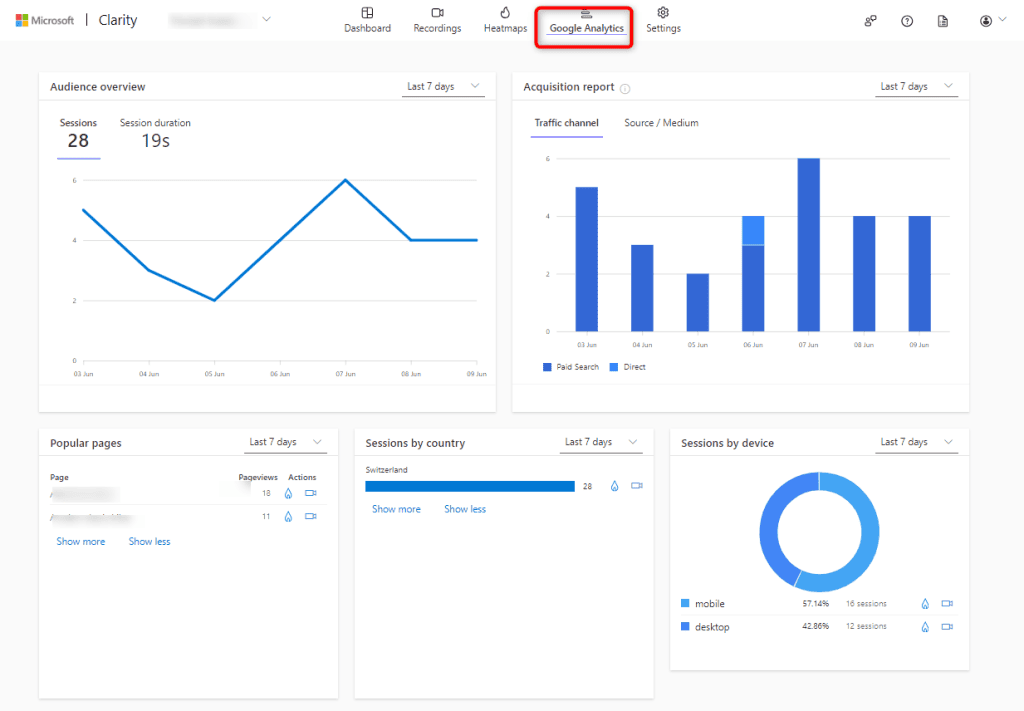
The Google Analytics dashboard in Clarity contains five cards for the following:
- Audience overview
- Acquisition report
- Popular pages
- Sessions by country/region
- Sessions by device
How to use the GA4 dashboard in Microsoft Clarity
Each card in the dashboard has Clarity features that can be used for selected data points.
To illustrate, we have a page for server-side tracking services and we would be interested in knowing where there might be opportunities, curiosity, or even frustration from visitors who land on this page.
We can go to the Popular page card, locate our page path being /services/server-side-gtm-services, and click either the session recordings or the heatmaps icons under the Actions column, to get a deeper understanding of your user’s behaviors.
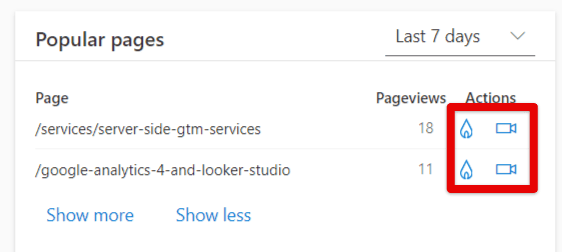
You’ll be directed to a report specific to that page where you can use AI to make sense of all these interactions, especially if there are many – more on this topic in the Artificial Intelligence section.
Alternatively, you can also identify problematic pages in GA4 and then examine them more closely in Microsoft Clarity using filters.
The Interface
The new data model and overwhelming interface of GA4, with its many settings and reports, can frustrate users of Universal Analytics and discourage newcomers.
Microsoft Clarity cuts through the complexity by focusing on specific behavior analytics data. Clarity has a clear and well-spaced interface with fewer options, making it straightforward to find what you need.
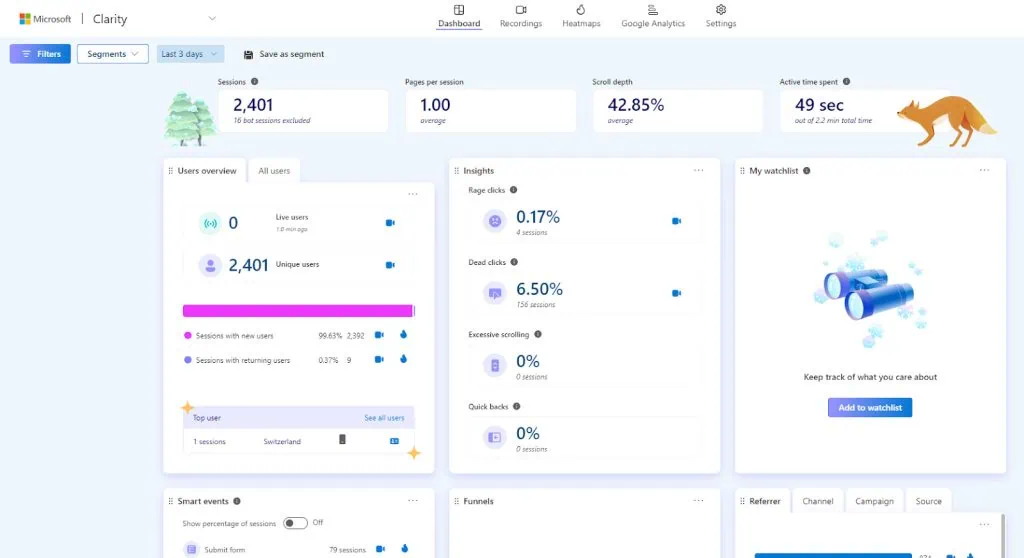
Clarity’s menu organizes reports into four sections:
- Dashboard
- Recordings to observe user sessions
- Heatmaps to see user activity patterns
- Settings for customization
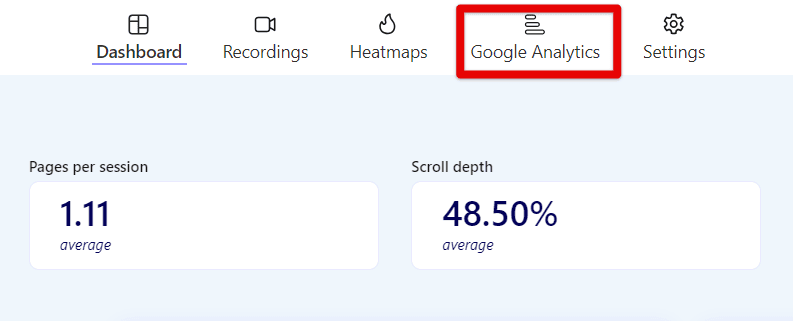
Integrating GA4 adds a dedicated “Google Analytics” section for analyzing GA4 data within Clarity.
Filters
Both Microsoft Clarity and GA4 have filters that let you view reports for a subset of data. For example, you can view a report specifically for Google organic traffic. Both largely share similar filtering features.
However, Clarity is more focused on user behavior and performance metrics. These distinct features are highlighted in bold in the table below, which includes the filter groups available in Microsoft Clarity.
| Filter Group | Filters |
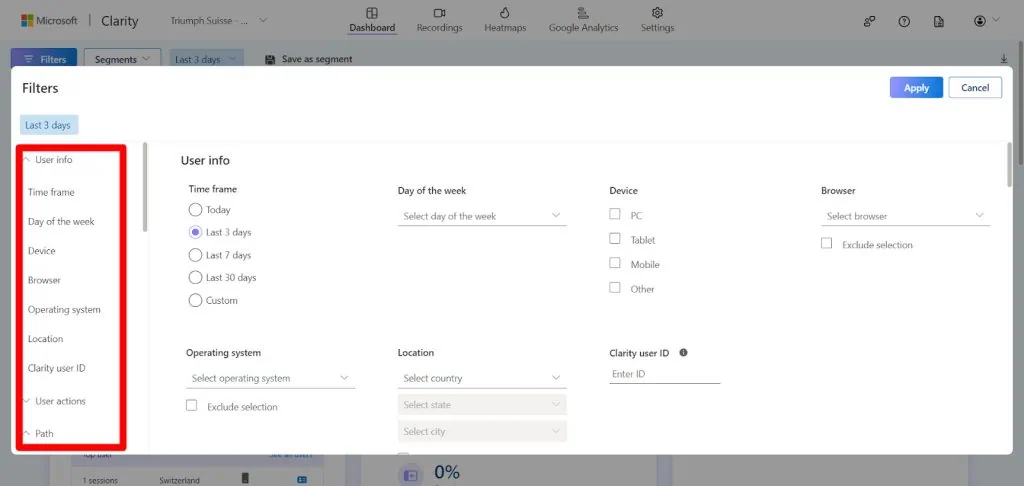
| User info | Time frame Day of the week Device Browser Operating system Location Clarity user ID User type |
| User actions | Rage clicks, Dead clicks Excessive scrolling Quick backs Cursor movement Entered text, Selected text, Clicked text Resized page Page scroll depth Smart events Funnels Reader type, Reading behavior |
| Path | Entry URL Exit URL Visited URL |
| Traffic | Referring site Source Medium Campaign Channel |
| Performance | Performance score Largest Contentful Paint (LCP) First Input Delay (FID) Cumulative Layout Shift (CLS) |
| Product | Price Brand Product name Availability Rating Number of ratings Purchases Checkout abandonment |
| Session | Session duration Session click count Session page count |
| Page | Page duration Page click count JavaScript errors Click error Page size Screen resolution Visible page Hidden page |
| Custom | Custom tags Custom IDs Custom labels |
On the other hand, GA4 provides detailed eCommerce filters, general test data filters, and user lifetime filters, which are not available in Microsoft Clarity.
You can see these highlighted in bold in the table below, which lists the filter and comparison options in GA4.
| Type | GA4 Filters & Comparisons options | ||
| Custom | Member ID | UTM content | UTM keyword |
| member_level | search_term | search duration | |
| Demographics | Age | Gender | Session source/medium |
| eCommerce | Item ID | Item affiliation | Item Brand |
| Item category | Item category 2 | Item category 3 | |
| Item category 4 | Item category 5 | Item coupon | |
| Item list ID | Item list name | Item list position | |
| Item location ID | Item name | Item promotion ID | |
| Item promotion creative name | Item promotion creative slot | Item promotion name | |
| Item variant | Local item price | ||
| General | Test data filter name | ||
| Geography | City | Country | Region |
| Page / Screen | Hostname | Landing page + query string | Page path and screen class |
| Platform / Device | App version | Browser | Device |
| Device brand | Device category | Device model | |
| Language code | Os with version | Operating system | |
| Platform | Screen resolution | Stream name | |
| Time | Date | Date + hour (YYYYMMDDHH) | Day |
| Hour | Month | Week | |
| Year | |||
| Traffic Source | Session campaign | Session campaign ID | Session creative format |
| Session default channel group | Session medium | Session primary channel group (Default Channel Group) | |
| Session source | First user source/medium | Session source platform | |
| First user campaign | First user campaign ID | First user creative format | |
| First user default channel group | First user medium | First user primary channel group (Default Channel Group) | |
| First user source | First user source / medium | First user source platform | |
| User | Audience name | ||
| User Lifetime | First session date | First visit date | |
Clarity Segments vs Saved Comparisons
Microsoft Clarity allows you to save your filter selections, name them, and easily apply them later in your reports. There’s no need to recreate the same filters from scratch every time.
In Clarity, these saved filters are called Segments.
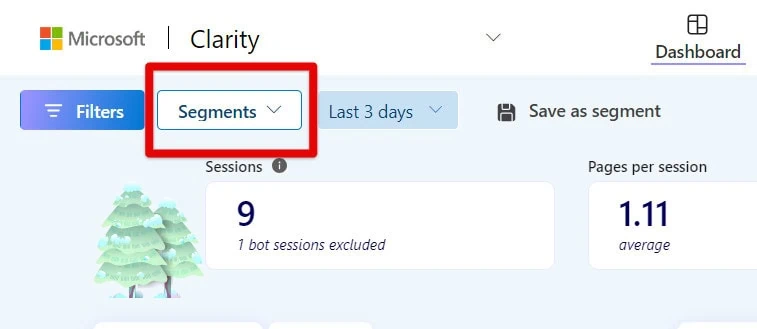
However, they are different from GA4 Segments. The equivalent in GA4 is Saved Comparisons. GA4 Segments are very similar to GA4 Comparisons and Microsoft Clarity’s Segments.
However, they can only be used in GA4 Explorations to explore data deeper than standard reports. They have additional conditions the others don’t have such as Sequence conditions, Condition scope, and Dynamic evaluation.
Clarity Segments cannot be compared one to the other; whereas GA4 Saved Comparisons enable you to compare your filters side by side.
Where Are Filters in Microsoft Clarity vs Google Analytics 4?
To use filters in Clarity, click the Filters dropdown at the top of the page.
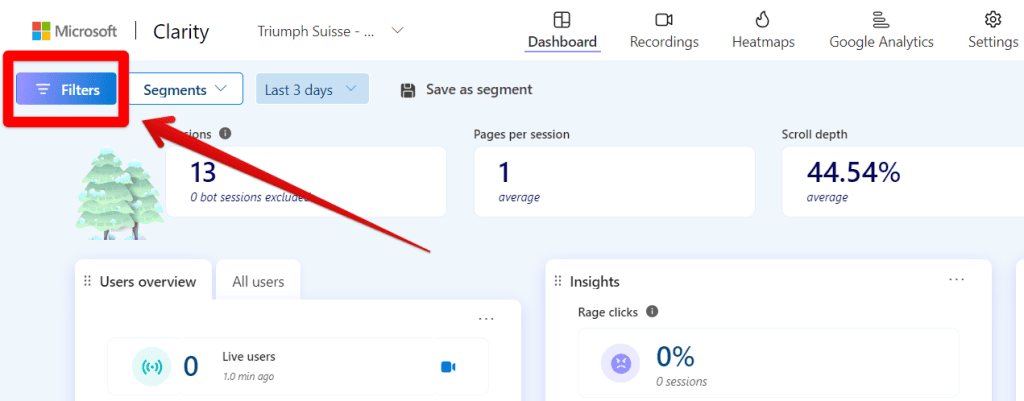
Then, make your selection.
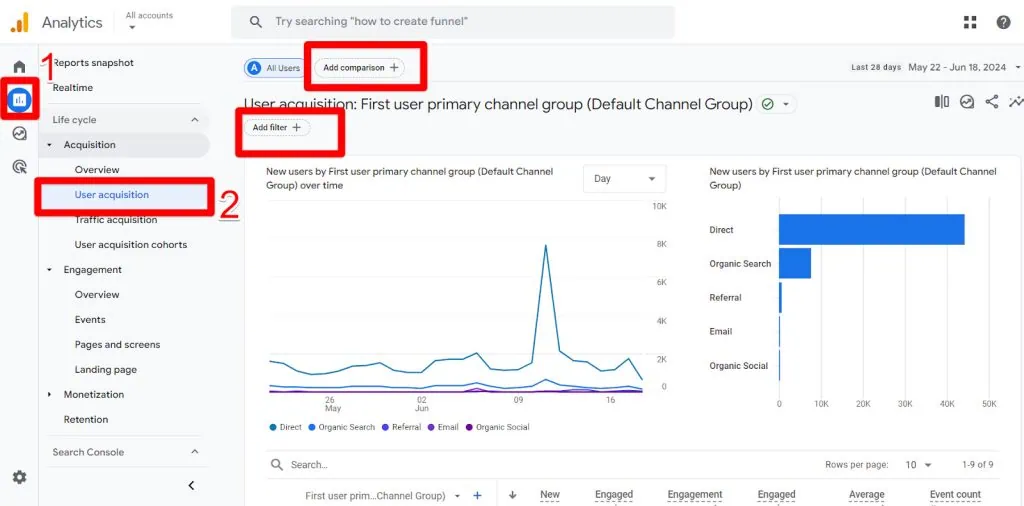
Here is where you can find GA4 filters and comparisons.
- Go to Reports.
- Select a standard report except for Overview reports.
See Comparisons and Filters at the top of your report’s page.
Events
Before the introduction of GA4, website interactions that communicated data to Google Analytics were known as hits. This remains the case for many analytics platforms.
In Universal Analytics (UA), the predecessor to GA4, hits were categorized into seven hit types, with the four most common being Page View, Event, Ecommerce, and Social.
However, GA4 has eliminated this distinction by consolidating all hit types into “events.” Everything in GA4 is considered an event.
| Universal Analytics property hit types | UA hit types in a GA4 property |
| Page View | Event |
| Event | Event |
| Social | Event |
| Transaction/e-commerce | Event |
| User Timing | Event |
| Exception | Event |
| App/screen view | Event |
Smart Events vs GA4 Events
Both GA4 and Microsoft Clarity use events to track user interactions. However, their capabilities and approaches to event categorization differ slightly.
GA4 categorizes its events into Automatically Collected Events and those that require your implementation to appear in GA4.
Clarity’s Smart Events are fewer in number compared to those available in GA4. In comparison to GA4, Smart Events blends elements of GA4’s event types, though they are not exact comparisons.
Clarity’s “Defined by Clarity” events resemble GA4’s Automatically Collected Events, Enhanced Measurement Events, and Recommended Events. Clarity’s API events align more with GA4’s Custom Events and require code, unlike the other event types.
🚨Note: About Smart Events:
– The Purchases feature is only available on Clarity projects of Shopify sites.
– The Checkout Abandonment feature is only available on Clarity projects of Shopify Plus sites.
– The Product Information is only available for sites that use Product Json LD.
Smart Events are automatically generated and include:
- Purchase
- Add to Cart
- Begin Checkout
- Contact Us
- Submit Form
- Request Quote
- Sign Up
- Login
- Download
They work by automatically identifying and responding to specific HTML elements on a website, such as links and forms.
Let’s take the “Contact Us” Smart Event to illustrate. When a link containing “mailto:” is clicked, Clarity detects this action and defines it as a contact event.
Similarly, it recognizes form elements based on the website’s HTML code, and when these forms are submitted, Clarity captures the submit event triggered by the browser.
Since Clarity provides heatmaps, it can track scrolling percentages, which are Scroll on the page.
However, GA4 only tracks when it reaches 90% by default. For other percentages, you have to configure them manually using Google Tag Manager. See this in How to Set Up GA4 Scroll Tracking.
Sampling
Microsoft Clarity does not use sampling, meaning it captures all user interactions without reducing the data set to make statistical estimations.
In contrast, GA4 applies sampling once the event quota limit (10 million events for a standard property) is exceeded.
Artificial Intelligence (AI)
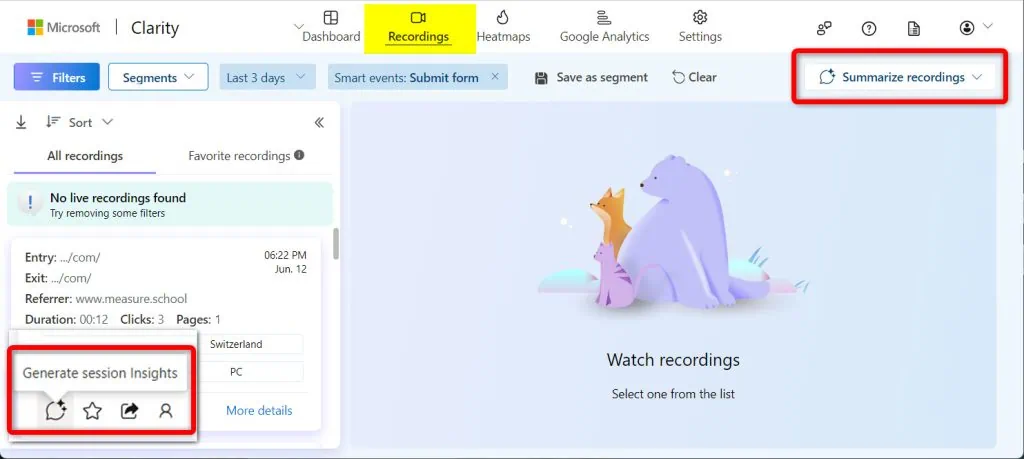
Microsoft Clarity simplifies session recording analysis by generating summaries and insights in seconds. This increased efficiency comes courtesy of Copilot, Microsoft’s generative AI chatbot.
Copilot analyzes recordings to understand user intent and identify potential issues, reducing the need for guesswork.
Clarity tackles a common difficulty in behavior analytics tools: the time-consuming task of reviewing and interpreting vast amounts of session recordings and heatmaps.
Regardless of the platform you use (Hotjar, Clarity, etc.), reviewing hundreds of recordings can be overwhelming.
While focusing on 20 recordings is a common suggestion, the process still requires significant time for selecting, viewing, and taking notes on each session.
Here are options to either generate insights for one session recording or summarize multiple recordings:
Google Analytics uses AI-powered capabilities to help you make faster decisions and uncover new insights from your data. These include advanced modeling techniques and insights, which come in two forms: automated and custom.
Automated insights detect unusual changes or emerging trends in the data and notify users automatically; while custom insights are based on user-defined conditions to highlight important changes.
To set them up, follow our guide on How to Set Up GA4 Custom Insights.
FAQ
Discrepancies Between Microsoft Clarity vs Google Analytics 4
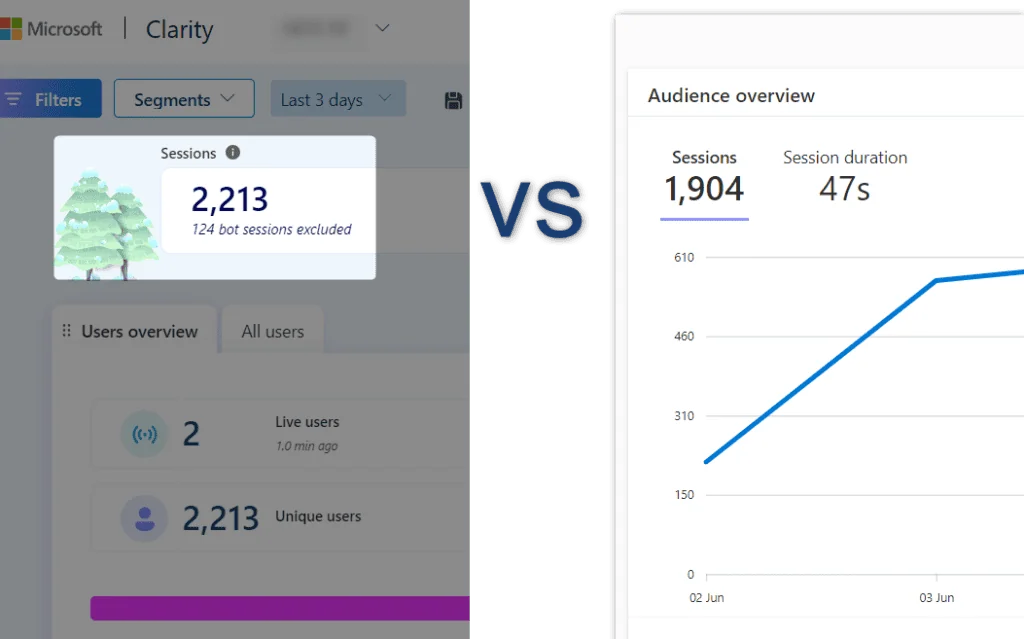
This article details key points on discrepancies between Microsoft Clarity and Google Analytics. To summarize:
- Time Zone Differences: Clarity uses UTC, while GA4 uses the user’s local time zone.
- Tracking Code Placement: Ensure all pages have the Clarity tracking code.
- IP Address Blocking: Clarity may block certain IP addresses that GA4 tracks.
- Session Definitions: Sessions expire after 30 minutes of inactivity in Clarity. The default session timeout in GA4 is also 30 minutes, but it can vary since it can be changed.
- Filters and Settings: Clear filters except for the timeframe to ensure consistent data comparison.
Is Microsoft Clarity Useful?
Indeed, Microsoft Clarity is a valuable tool for understanding user behavior on your website. While other measurement tools like Google Analytics (GA4) excel at providing data about “what happened” and “how many,” Microsoft Clarity goes a step further by explaining why it’s happening. This makes Clarity particularly useful for those seeking to address conversion rate issues.
Does Microsoft Clarity Affect Performance?
Unlike other similar tools, Microsoft Clarity won’t slow down your website. Its JavaScript code is asynchronous, meaning it loads and runs in the background without interrupting the rest of your website’s content.
Summary
Despite similarities, Microsoft Clarity and GA4 are not alternatives but complementary tools.
We’ve examined key features, overlaps, and differences, showing how together they can help website owners improve conversions and better serve users.
If you find this comparison useful, we also have a comparison between GA4 and Hotjar, another behavioral analytics tool like Clarity.
Have you used Clarity in your analytic work? What are your thoughts on how Clarity compares to GA4? Let us know in the comments below.


