
Last Modified on February 5, 2025
In this post, we’ll do a comparison of Google Analytics vs Hotjar.
Google Analytics is obviously the standard for web analytics for many website owners out there.

Master the basics with our FREE GA4 Course for Beginners
And you might be asking yourself, why would I even switch to something like Hotjar?
This is actually the wrong question to ask because these tools are quite different, but also quite complementary to each other—you may even find that you want to use them both!
Here’s an overview of what we’ll cover in this guide:
- Using Google Analytics
- When to Use Hotjar
- Special Hotjar Features
- How to Use Google Analytics & Hotjar Together
Using Google Analytics
Here we are inside of our Google Analytics account.
If you haven’t already, go ahead and get Google Analytics Installed using GTM.
We have the Google Analytics tracking code installed on our page and it’s gathering all this data for us.
Before diving into data, start with a question. For example: How are users engaging with my website? or Which pages drive the most conversions?
GA4 organizes insights into different categories like Acquisition, Engagement, Monetization, and Retention, providing a holistic view of your website’s performance.
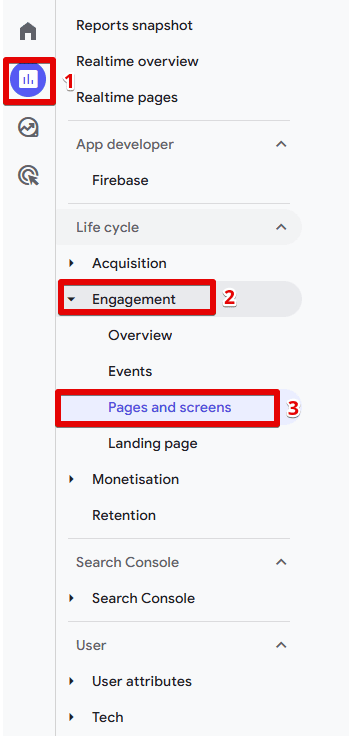
To analyze page performance:
- Go to the Reports section.
- Select Engagement > Pages and Screens.
It shows us which pages are the most used by our users, which ones do they visit most often?
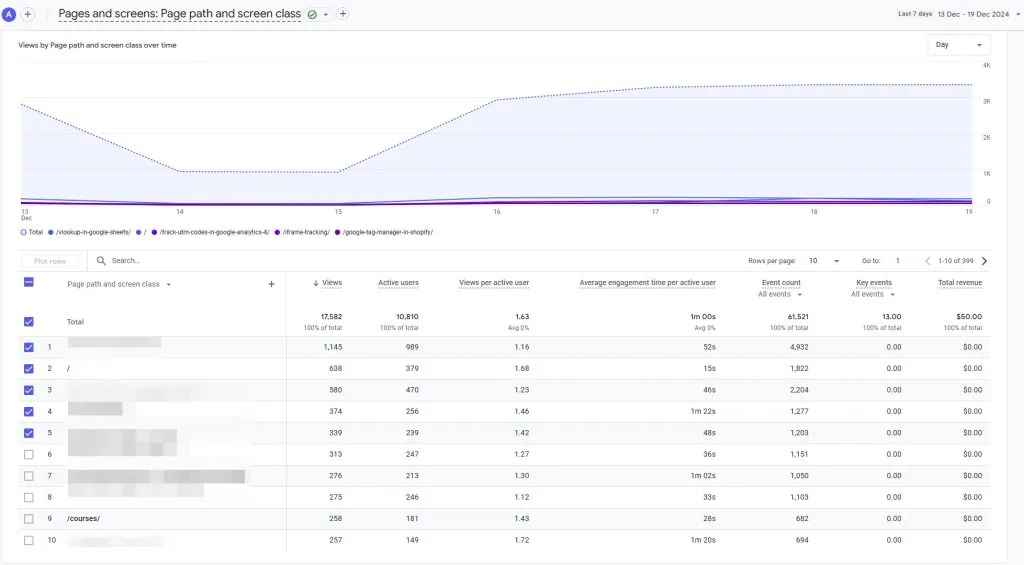
In the 2nd spot we have our homepage.
You can also see our courses page and other pages below.
Page that I’m interested in is the page with a high Page Value.
To find those pages, we can filter by Total Revenue and identify which pages are bringing revenue.
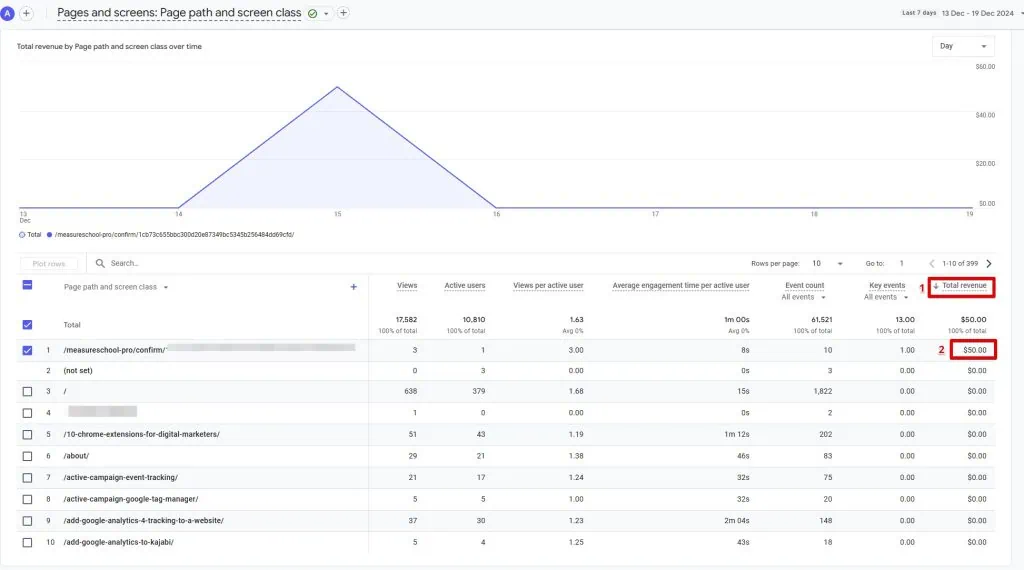
Those are the pages that help convert users and naturally, for us, this is our premium product /measureschool-pro/.
We have a landing page that explains this product.
Further on how to sign up to it and then the user converts from there.
This is a very important page for us.
What we can do with GA4 is find out what the page referrer was that made this happen.
Special Features in Google Analytics 4
Google Analytics 4 (GA4) provides advanced capabilities that go beyond basic tracking. Here are some key features:
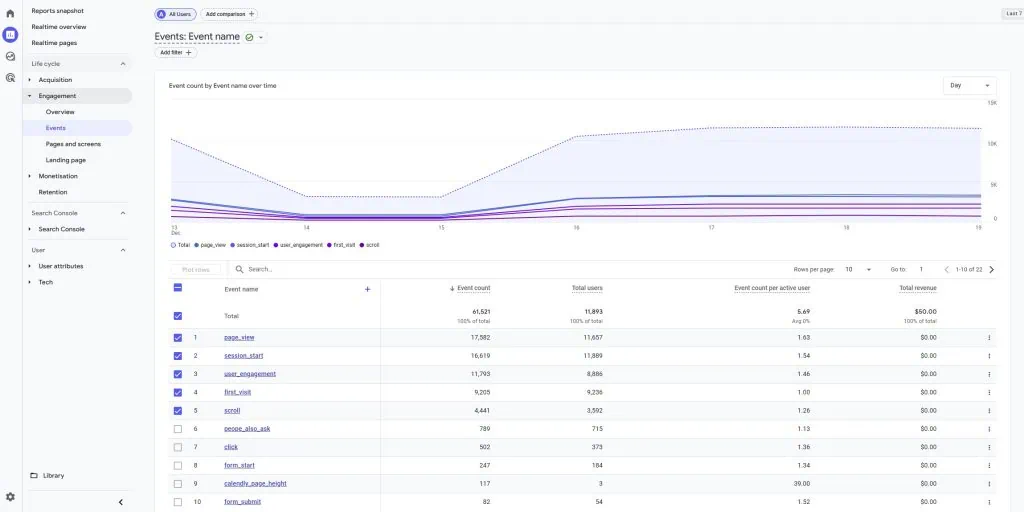
Event-Driven Insights
GA4’s event-driven tracking lets you measure user interactions like scrolls, button clicks, video plays, or downloads. For example, by enabling scroll depth tracking via Google Tag Manager, you can measure how far users engage with your page content.
Funnel Exploration
The Funnel Exploration tool under Explore allows you to define user journeys and identify drop-off points. For example, you can analyze how many users move from landing on your homepage to completing a purchase. This helps pinpoint where users abandon their journey and informs optimization strategies.

Funnel Exploration is just one of numerous useful reports in explorations. If you want to learn more, check out our guide to top 10 GA4 exploration reports.
When to Use Hotjar?
You might be thinking that’s all great data that we have right here, but it really just shows us what is happening on the website, but not really why it is happening.
For that, we would need to have some more context to understand the behavior of the user on the website correctly.
Google Analytics can’t really give us that data. It doesn’t have the tools, but behavioral analytics tools like Hotjar can actually show us this data quite nicely.

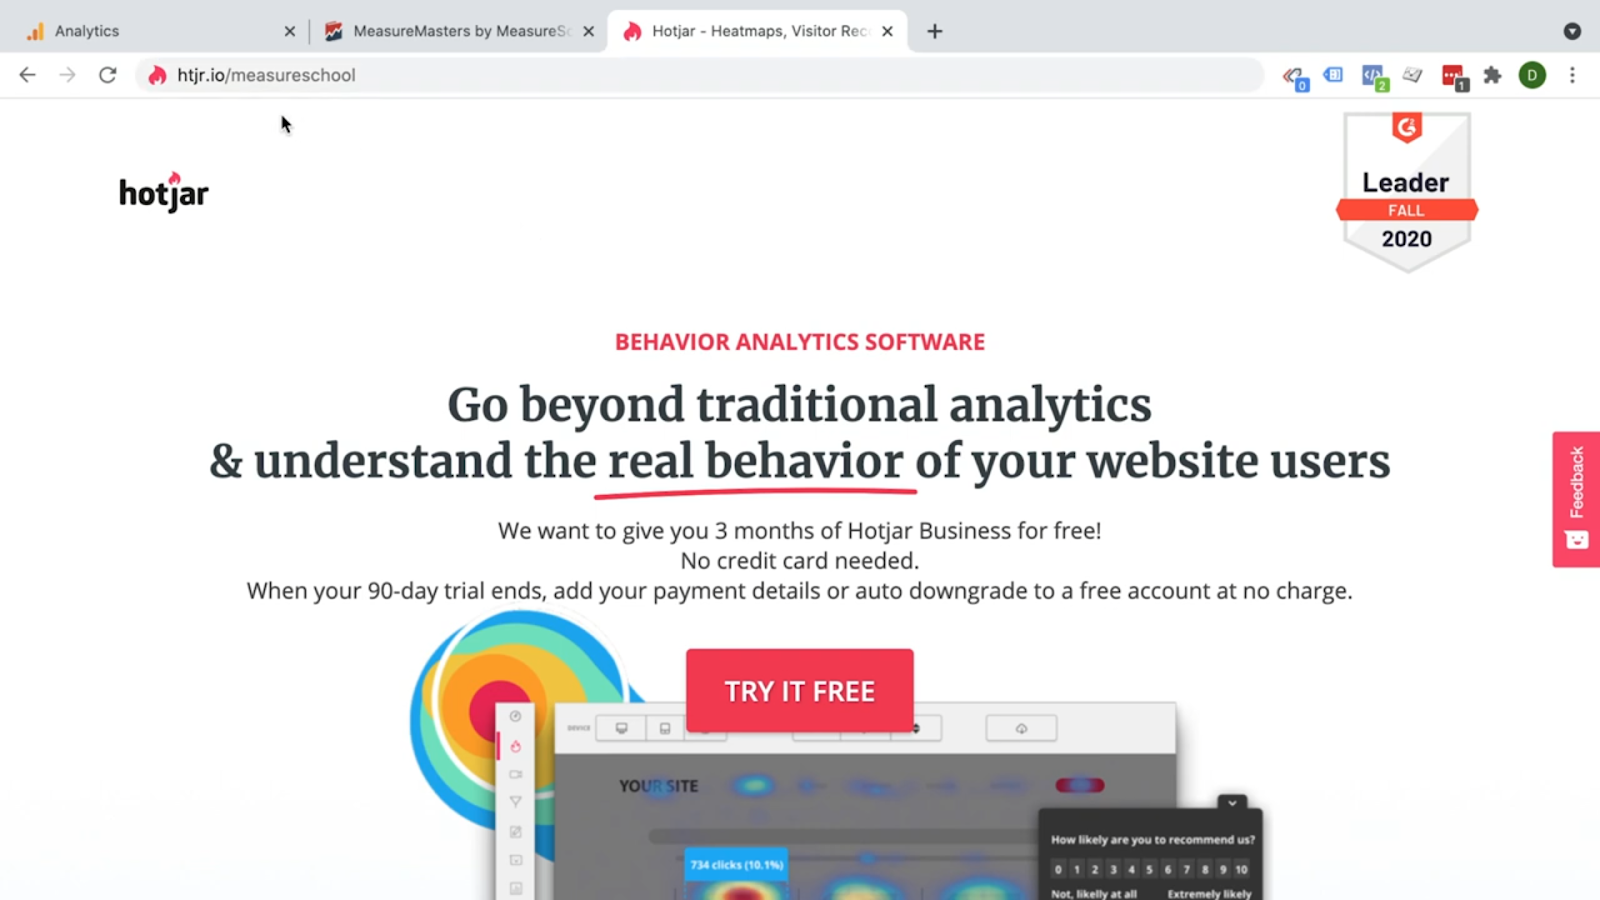
Here we see the Hotjar homepage.
You can use Install with Google Tag Manager method.
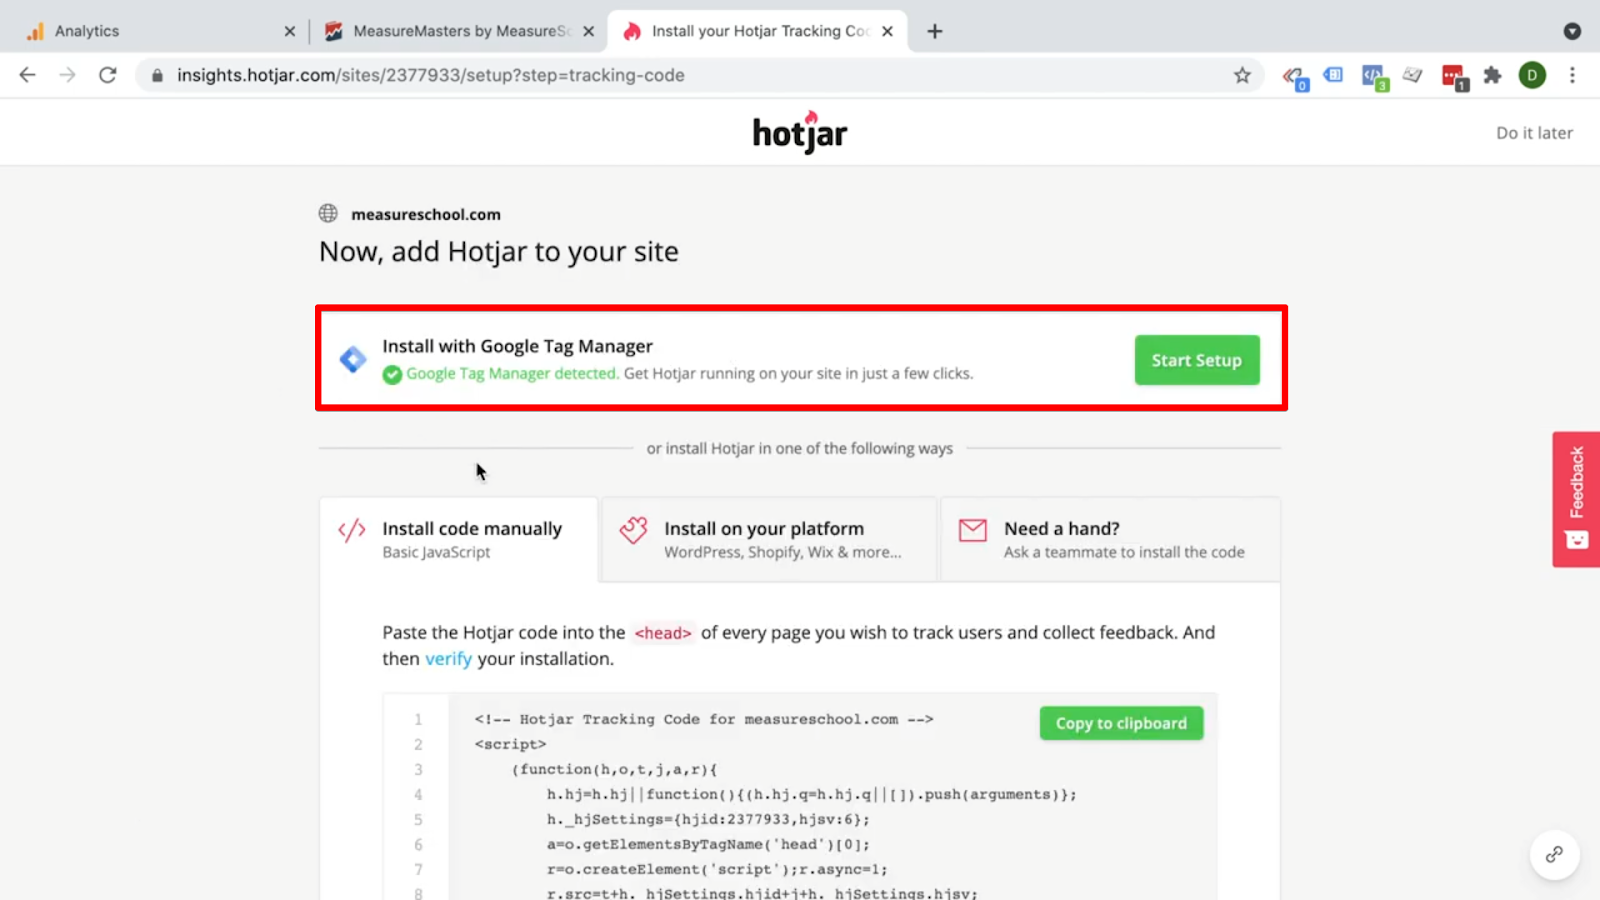
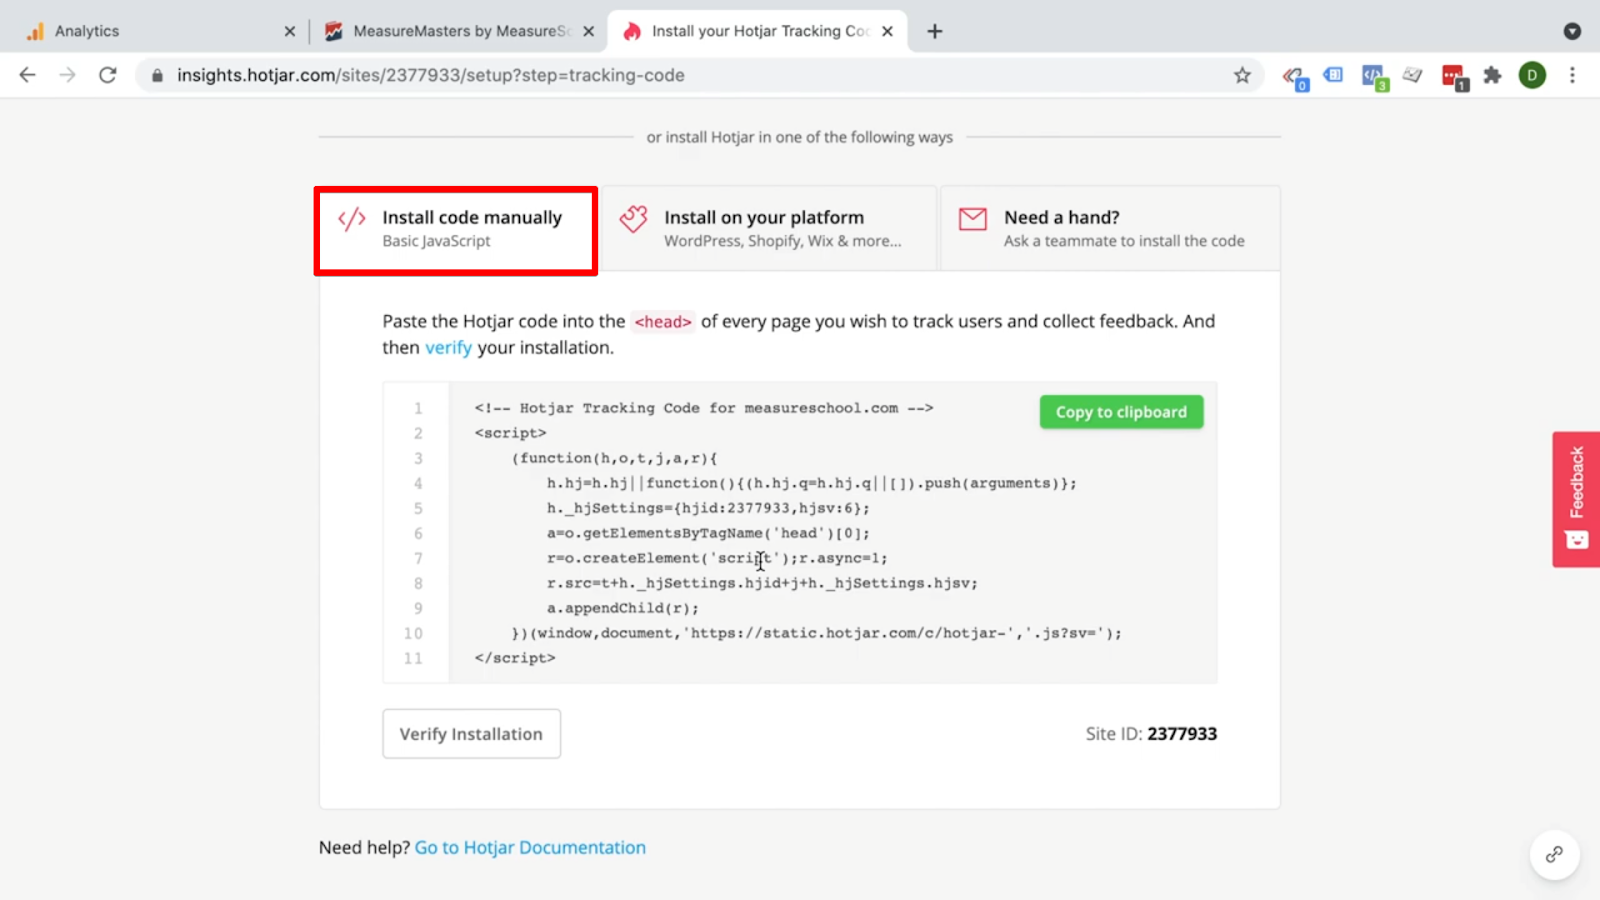
For example, I have installed code manually.
You should be entering your Hotjar dashboard.

I have Hotjar installed already on my account.

Special Hotjar Features
Heatmaps
In my account here, we can see what Hotjar has available. We get access to various reports.
It might seem quite small, but in the end they hold a lot of value.
Let’s see what we can find out about our Measure Masters page and the users who visited.
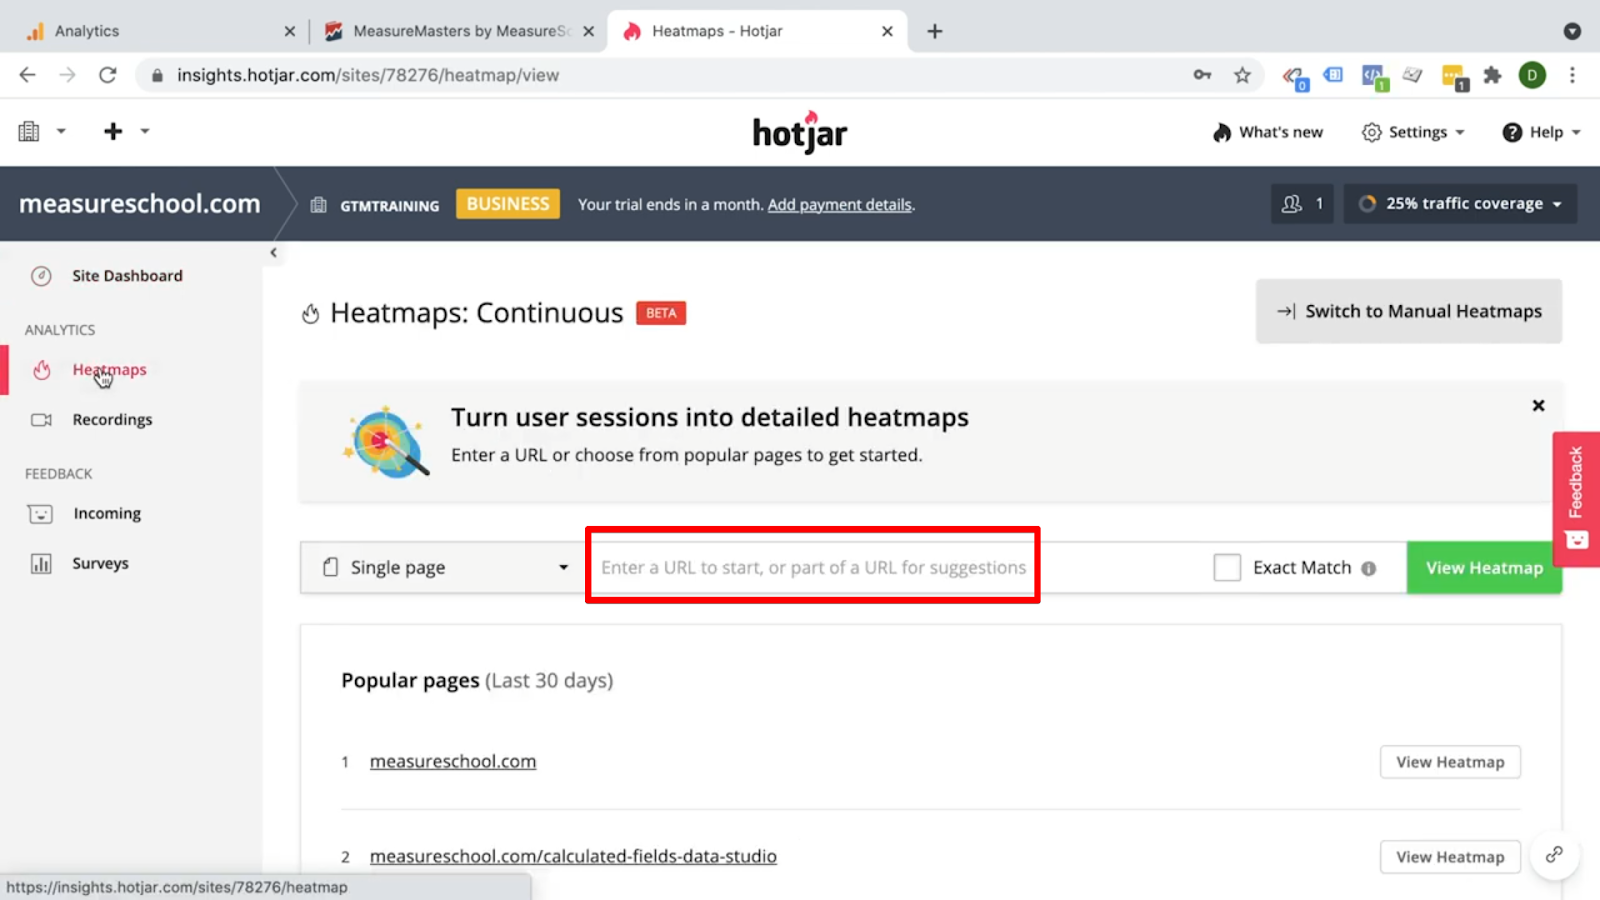
Let’s go over the Heatmaps.
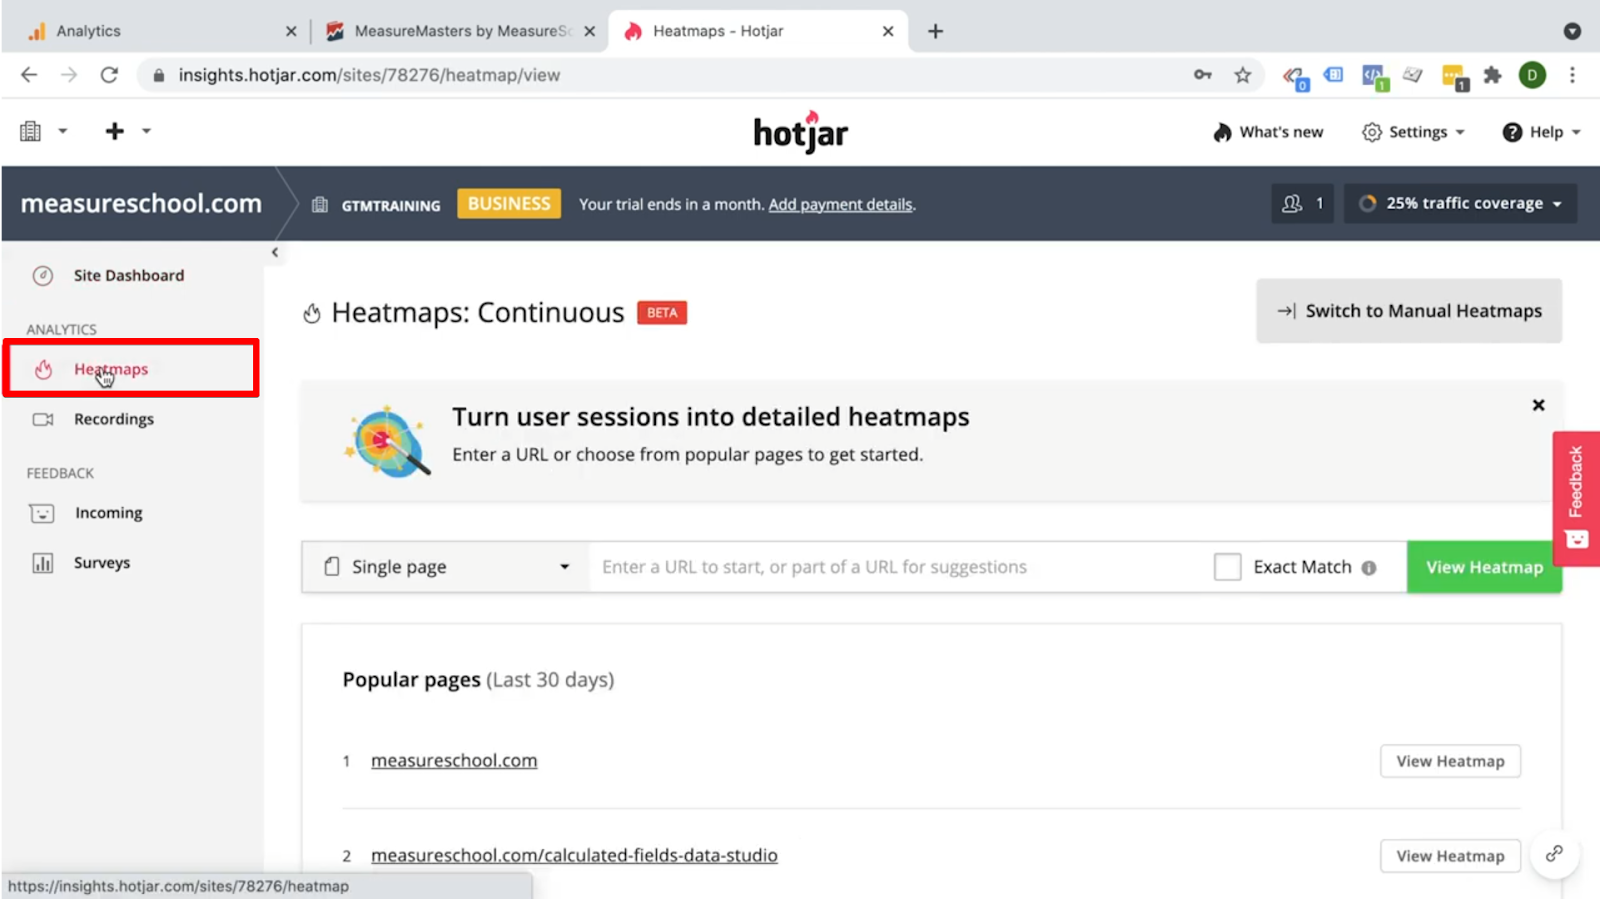
This is the first visualization tool that they have available, where we can look at Heatmaps of our page.
We can filter based on what page we are interested in.
Then we see our website overlaid with different data points that make it clear what is happening on the website.
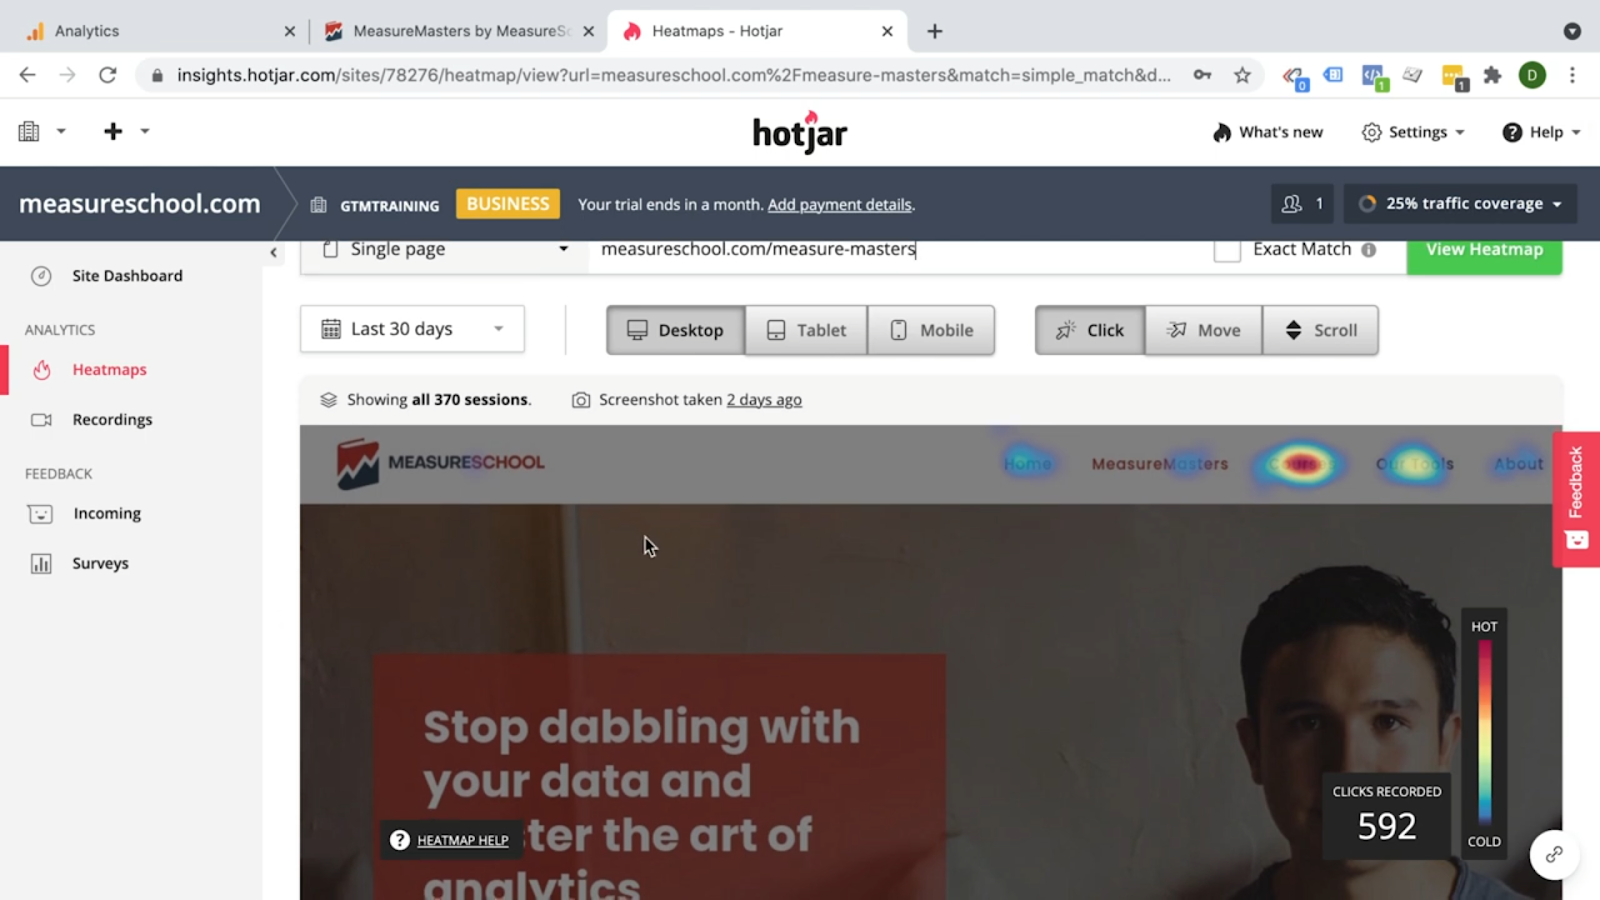
We have Click, Move and Scroll.

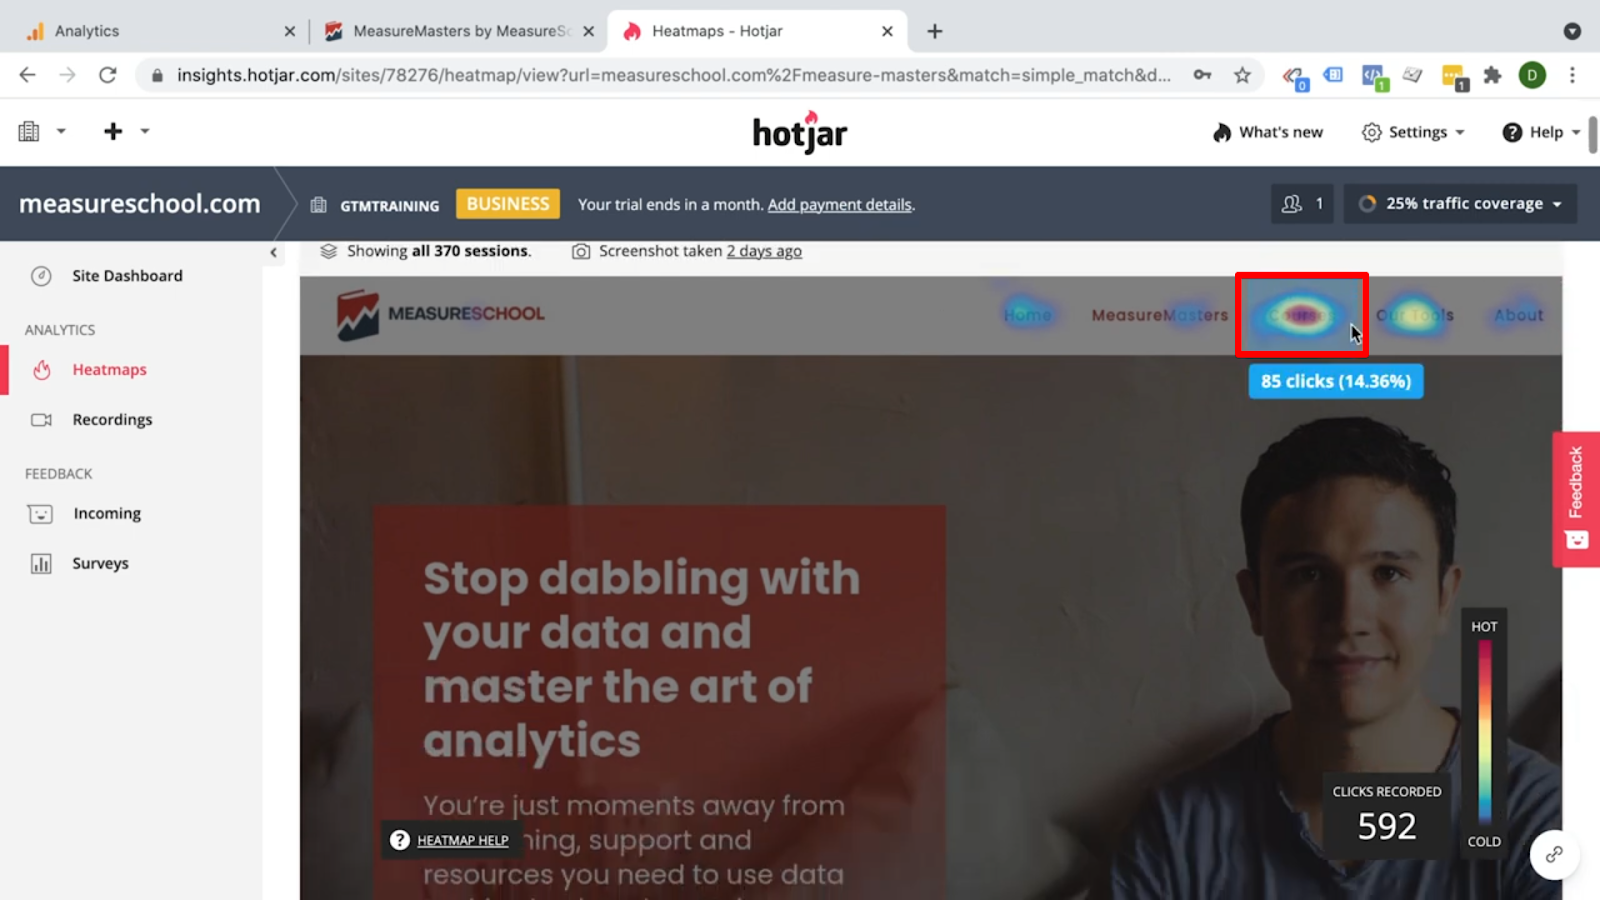
Click shows us which part of the website did users click on and in what quantity.
For example, we can see that the navigation is used quite a bit.
We have our call-to-action button here, which is nicely clicked.

However, note that Hotjar can’t track our videos because they are in an iframe.
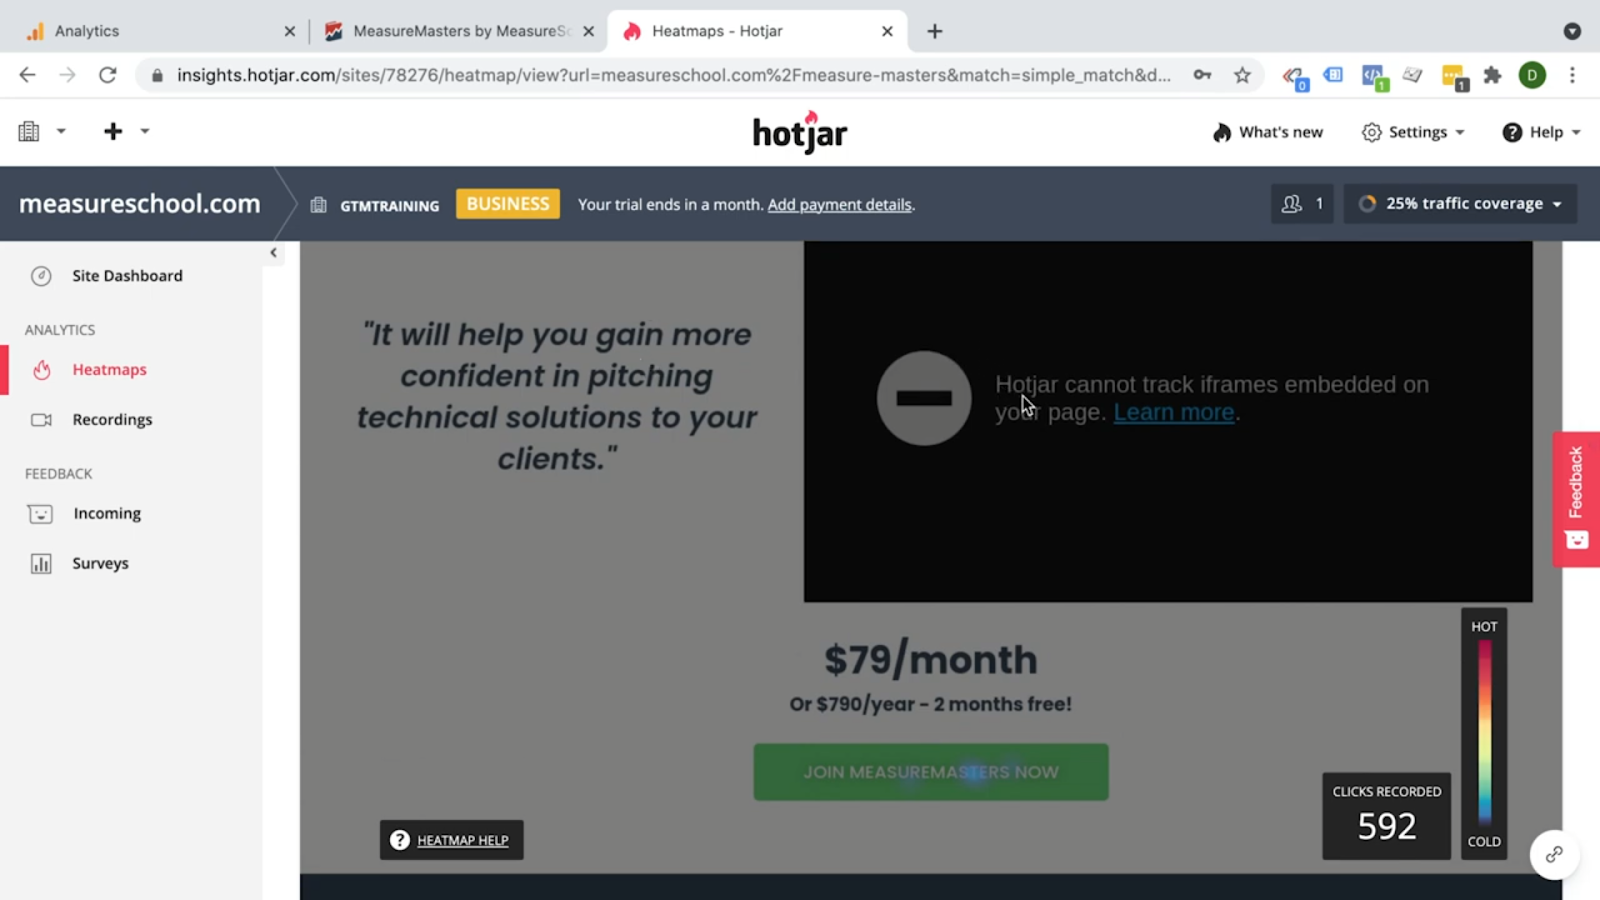
Then we also have our call-to-action button here, which makes it seem that our website is used correctly.
Move shows where the users moved their cursor across our website.
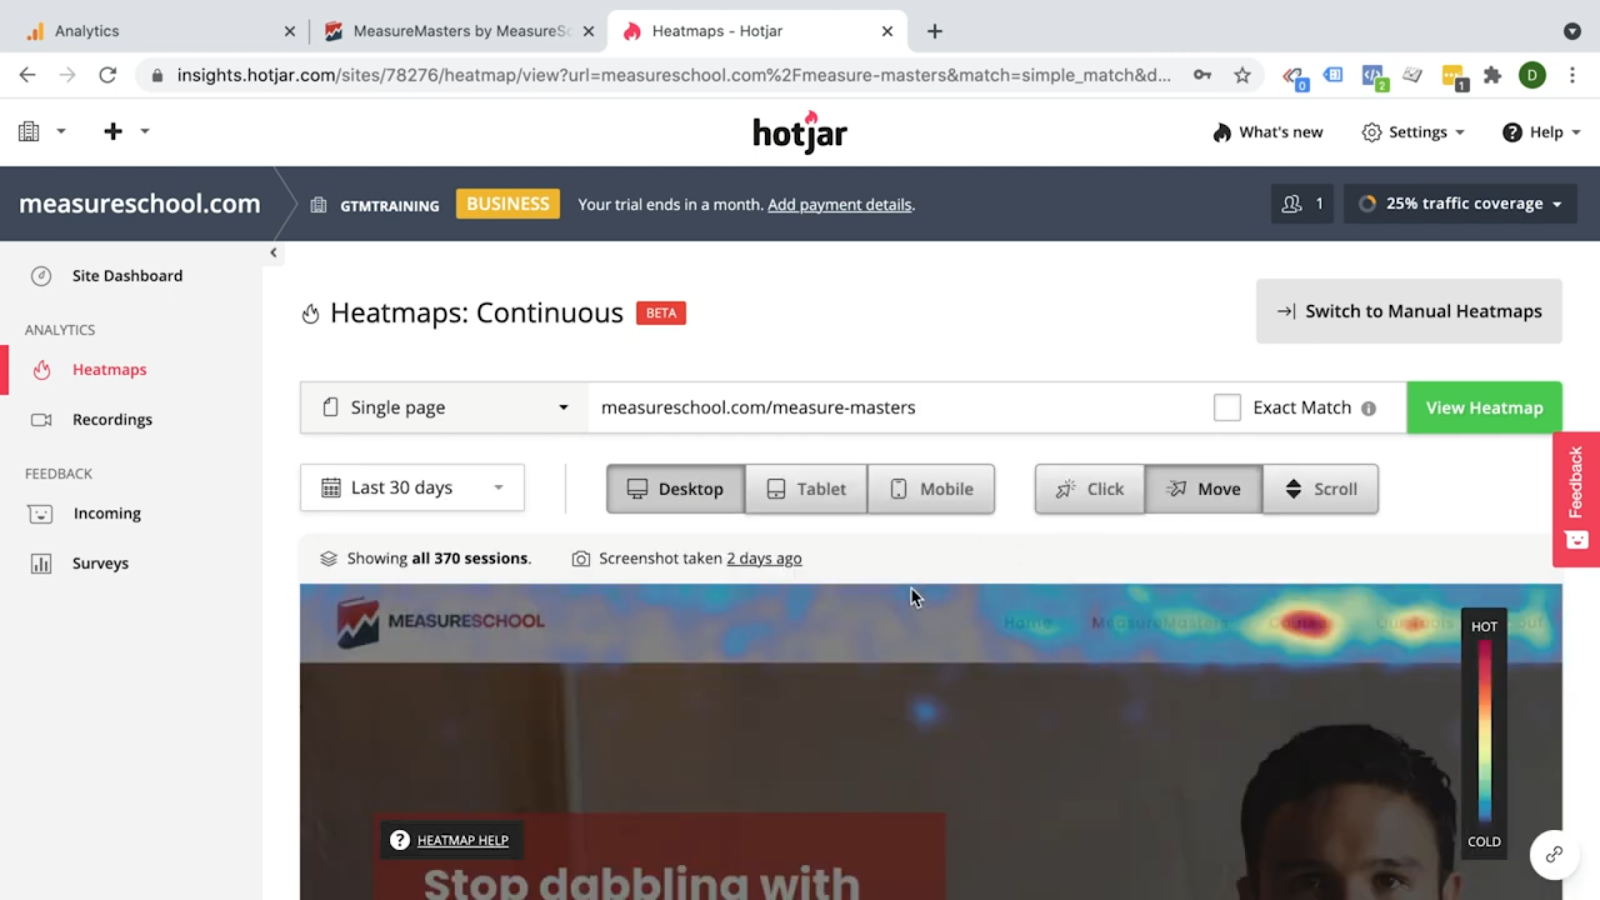
This is helpful because sometimes users use their mouse to read certain things on the website.
Finally, Scroll shows us how far users scroll down our website page.
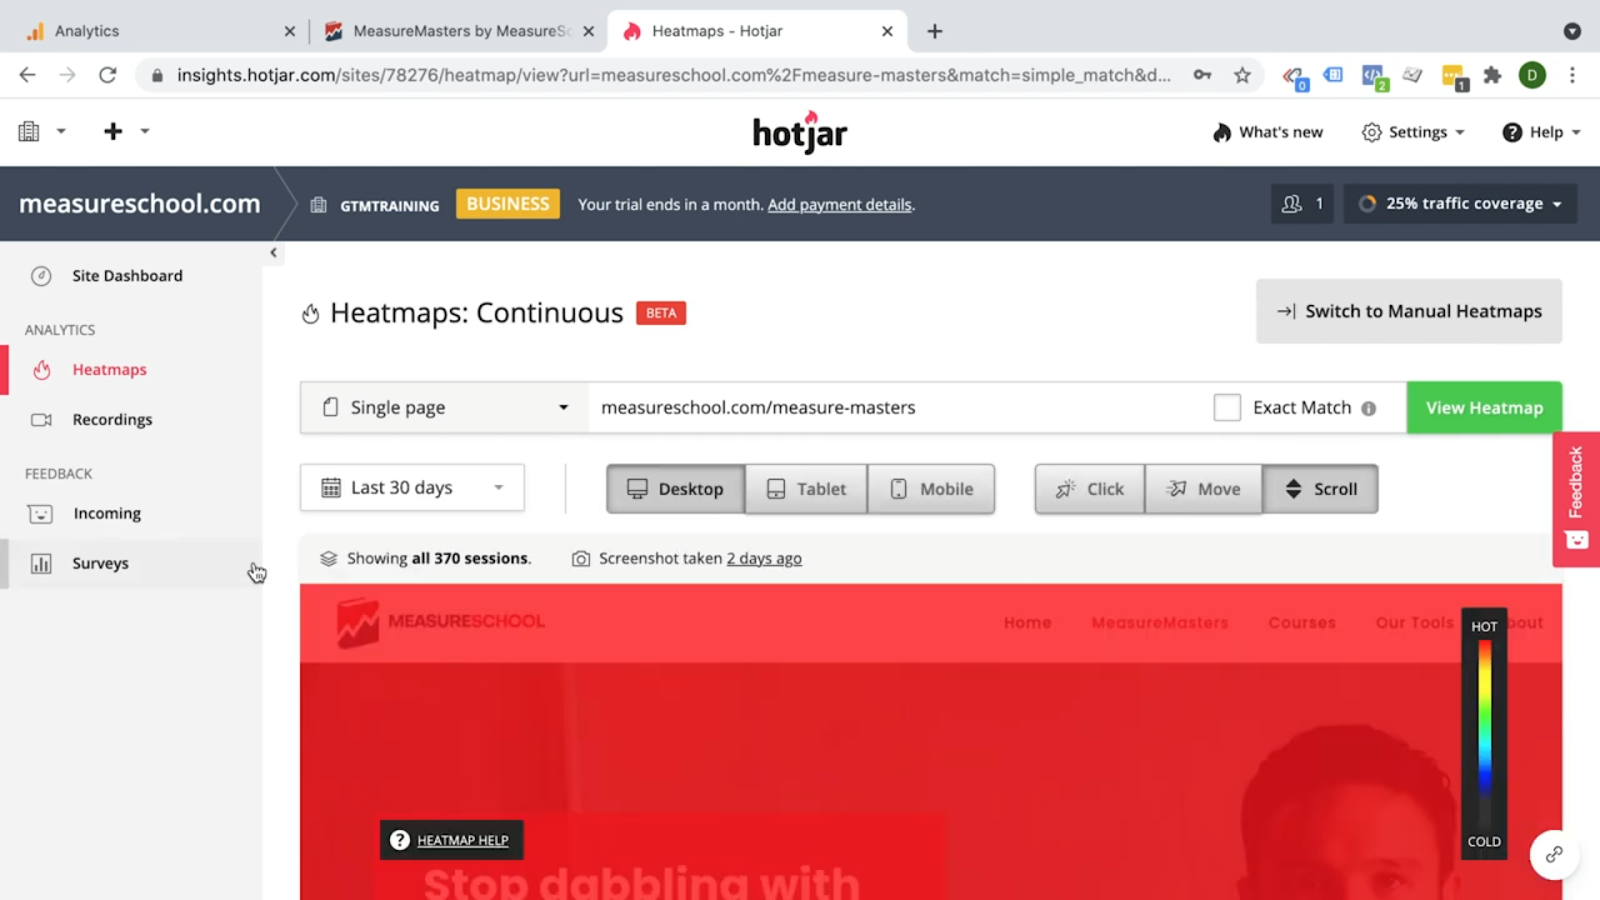
So how far do users scroll down the page?
You could be using Google Tag Manager and Google Analytics to track that data, but it isn’t as visual as we can see it here, which for landing page optimization makes it quite clear where you should place the call-to-action.
You want to put your call-to-action button above the Average fold.

If you find out that this is not the case for your landing page, then you might have a really good argument to move the call-to-action around.
In the Heatmaps, you can really find some evidence if you’re suspecting your page structure is not conversion optimized.
If you find anything that’s out of balance, then it’s a great argument to show to your client to change something here.
For us, it seems to be working and let’s dig deeper into the other tools that we have available.
The users actually have different pathways to that page which might also influence how they use it.
Live Recordings
We can look at these pathways by looking at Recordings.
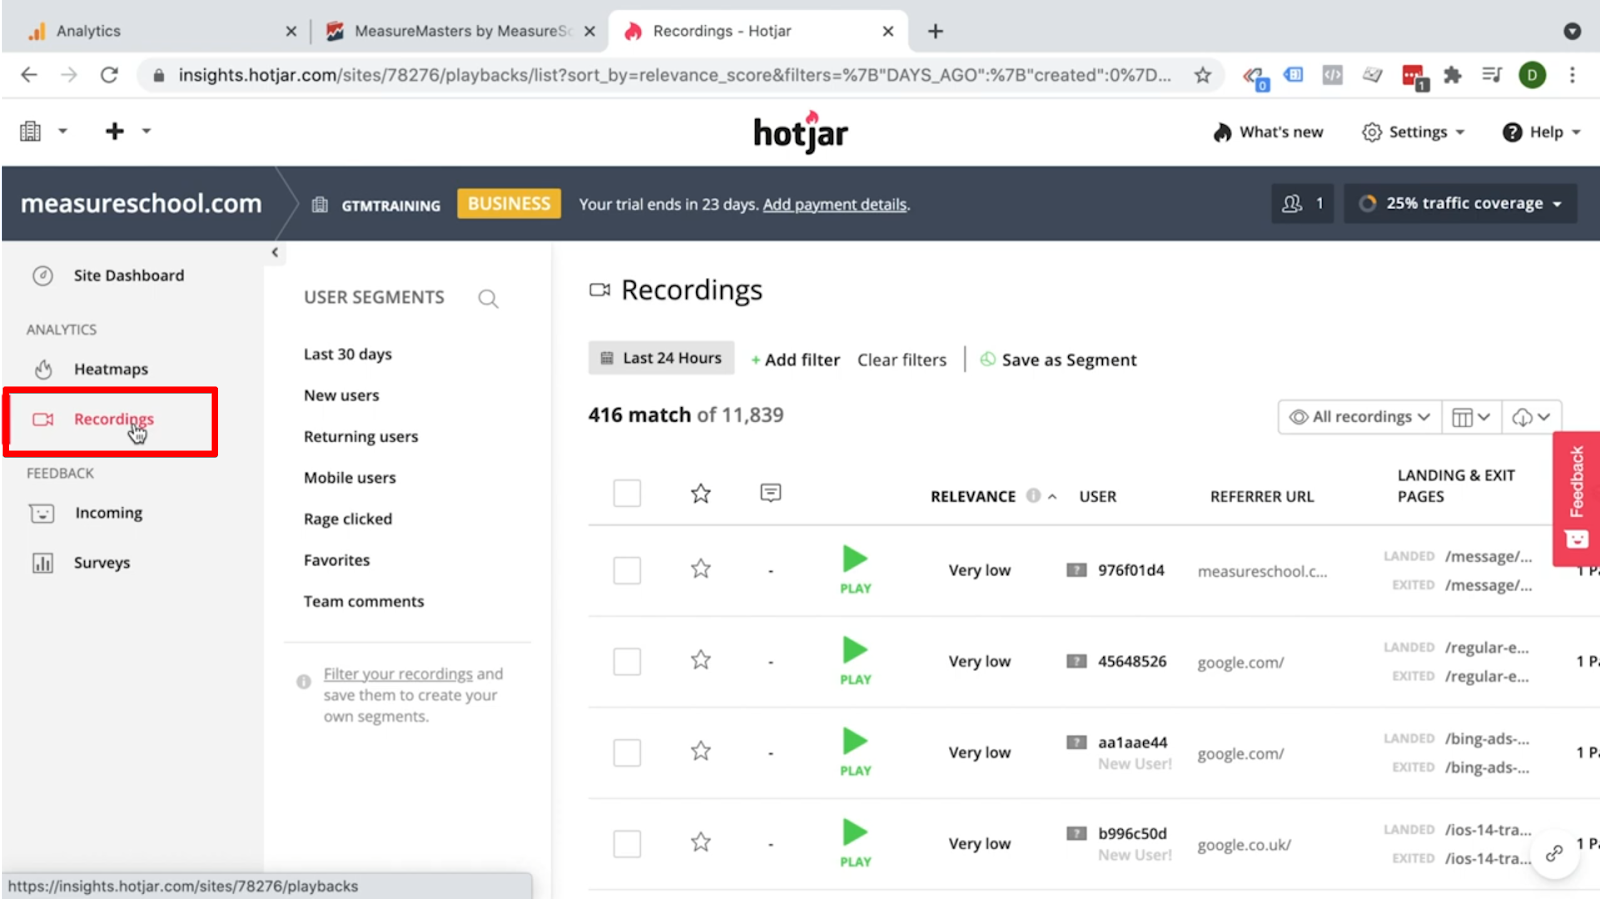
Recordings are videos of your user going through your website.
You can see the exact path that he texts through the website or the clicks, the scrolls and whatever he’s seeing on the screen.
It works on both mobile and desktop devices, and this can yield really great information, because you can view your website from your visitors perspective.
That can help you understand the experience that the user goes through and how he interacts with the website.
Also if there are any blockers that prevent him from moving through your desired funnel.
Hotjar has the ability to let a Segment right here.
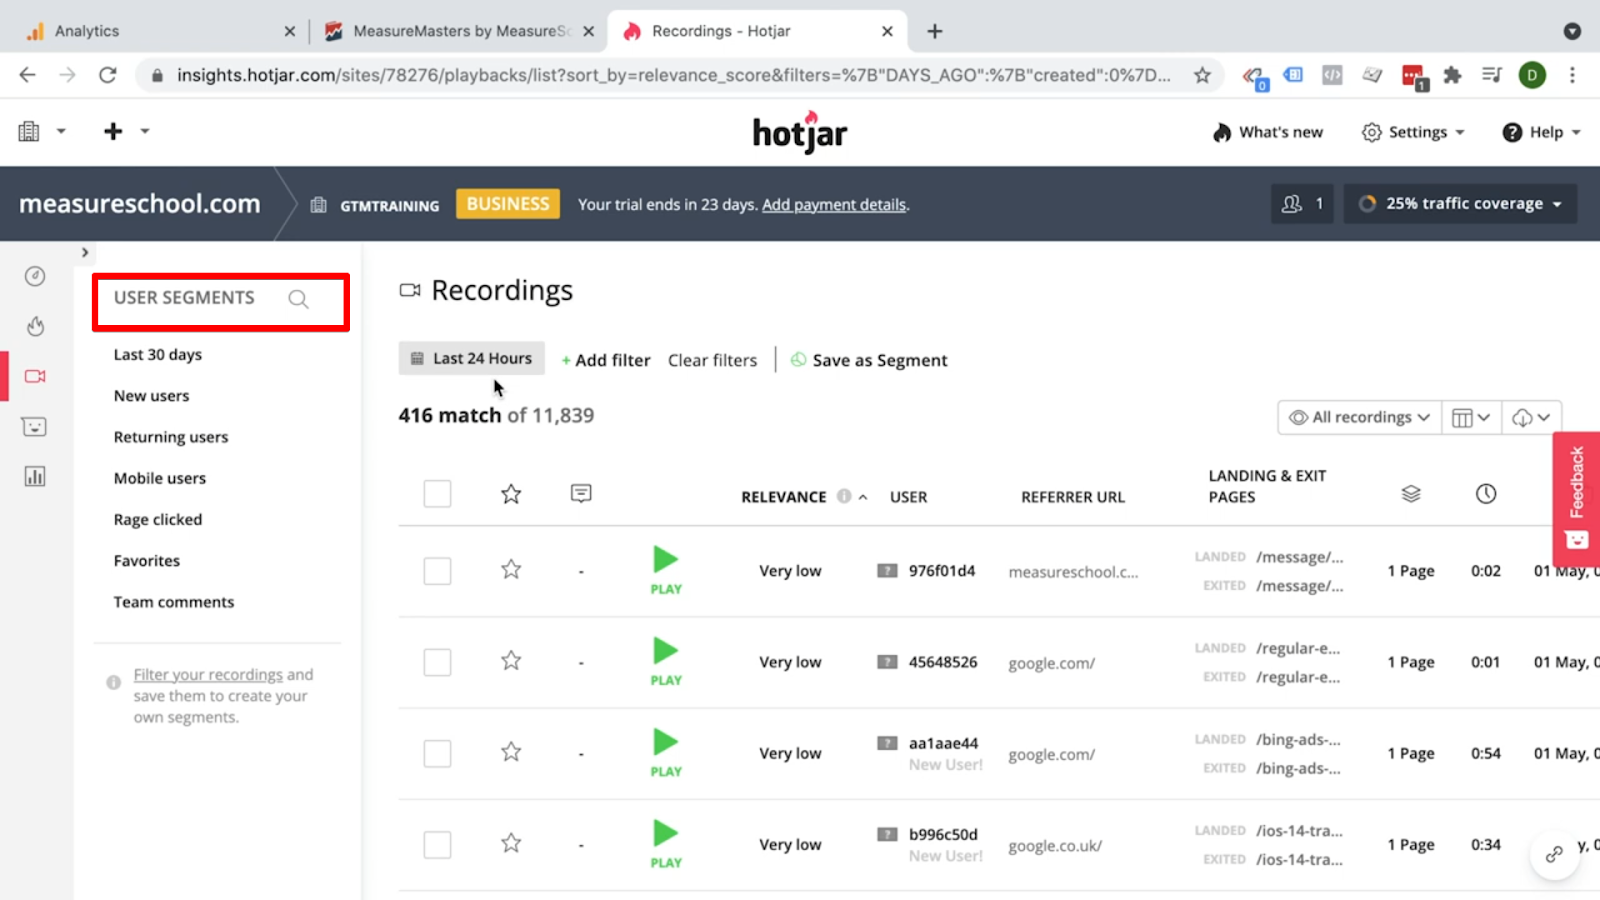
Hotjar also has a great filter functionality.

If you’re looking at a specific page that the user visited, click Visited URL.

There are also some Technology filters.
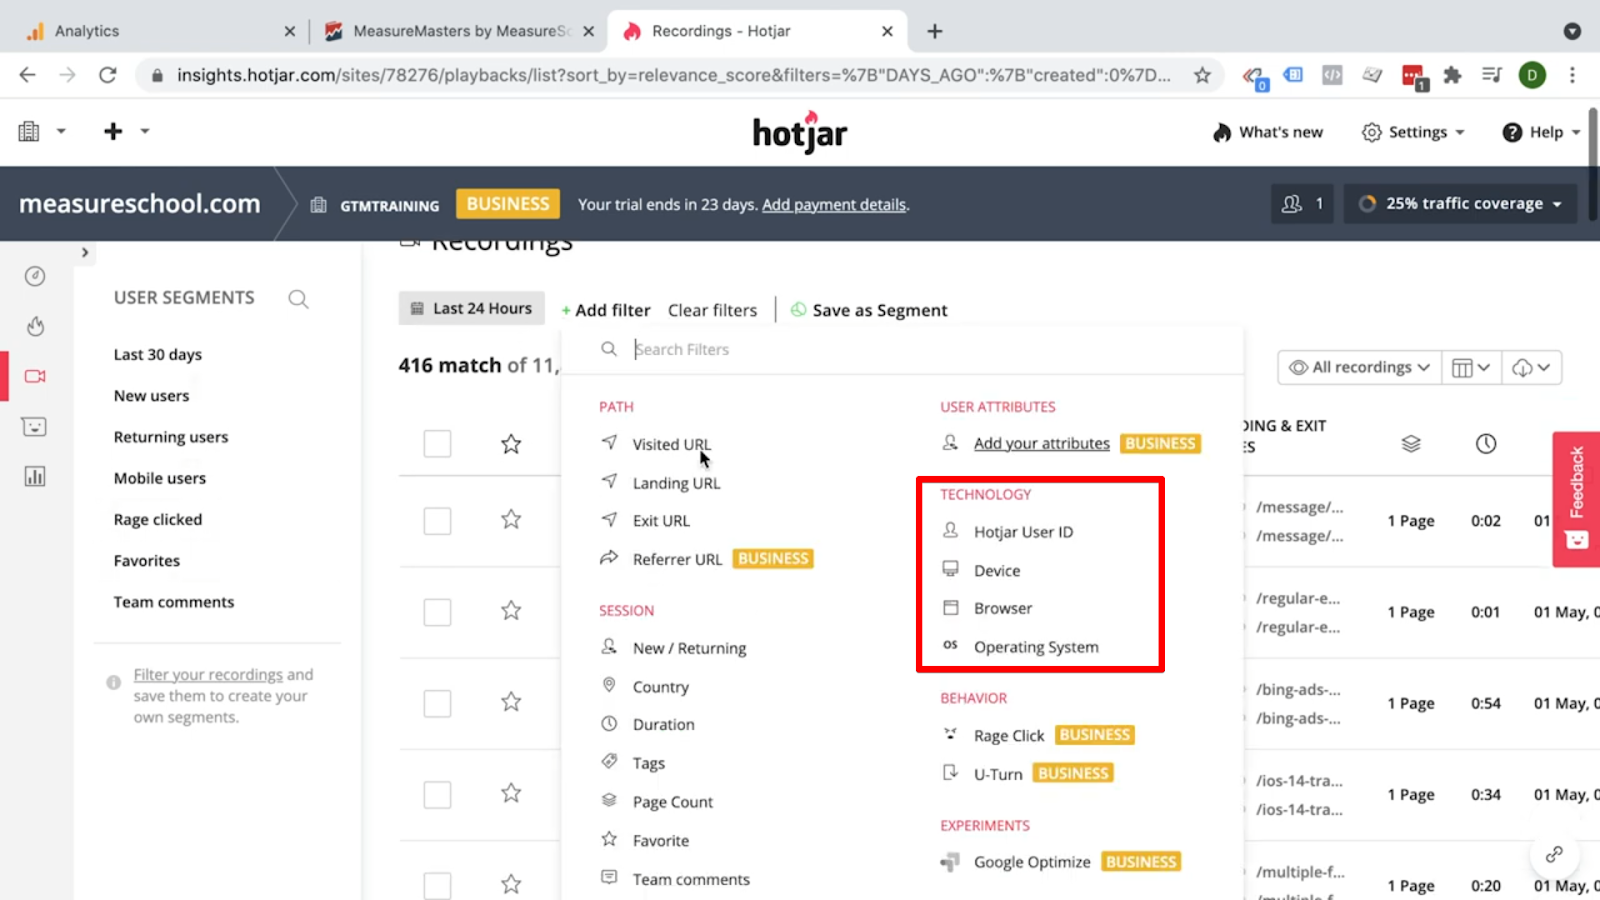
Then also Behavior filters like Rage Click or U-Turn.
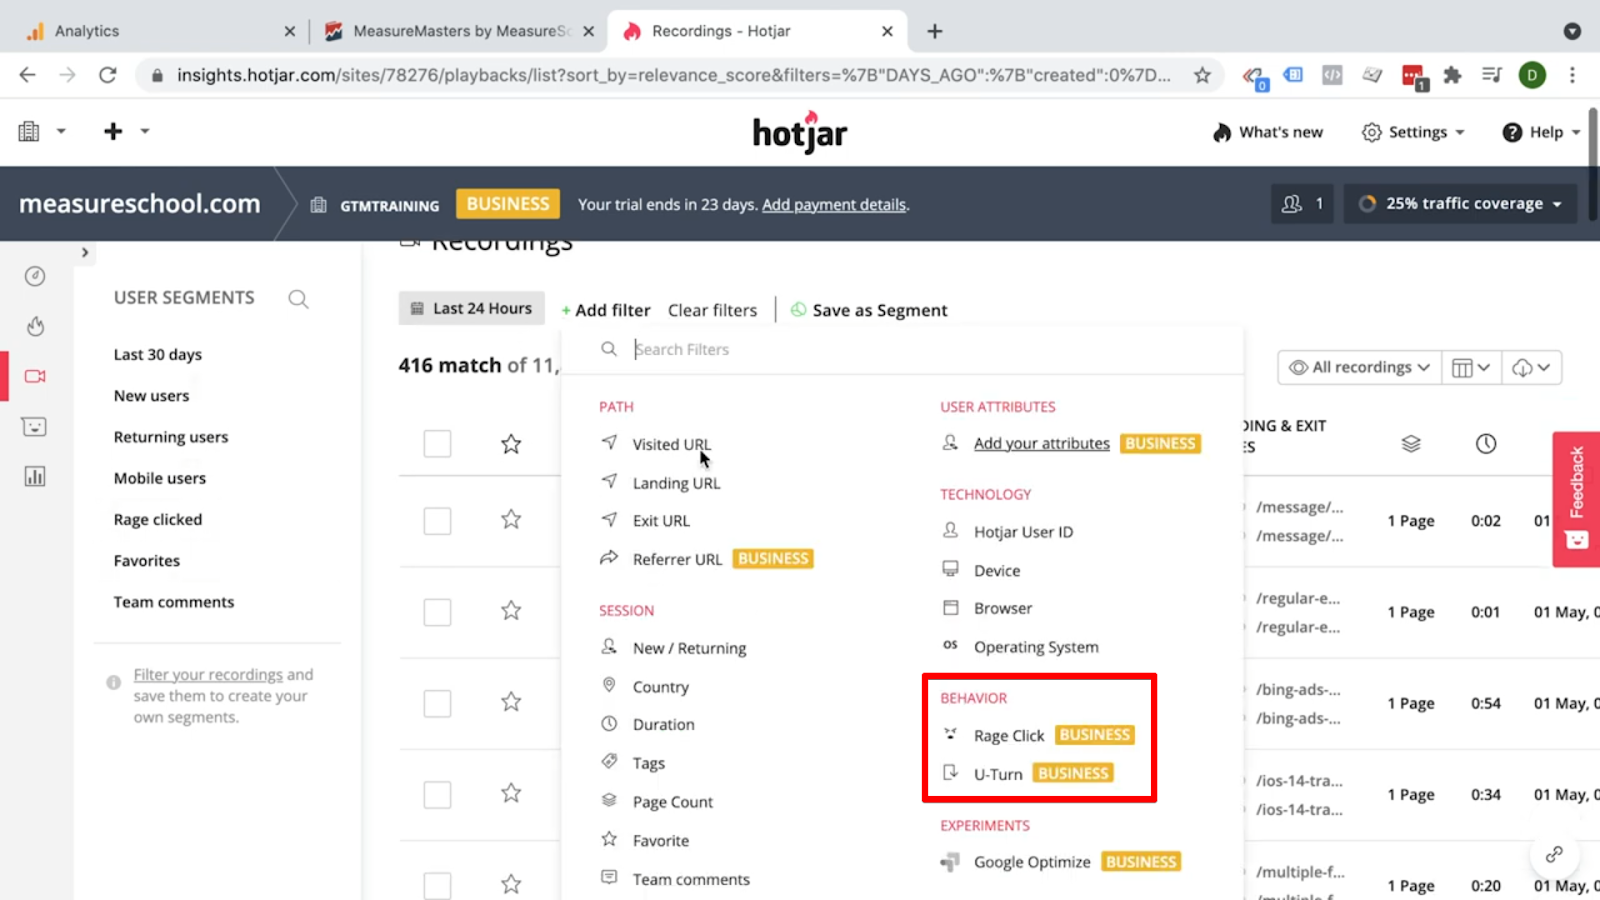
All of these can be quite insightful to watch.
I’m interested in our Measure Masters page.
So I will click the Visited URL, put in measure-masters and click Apply.
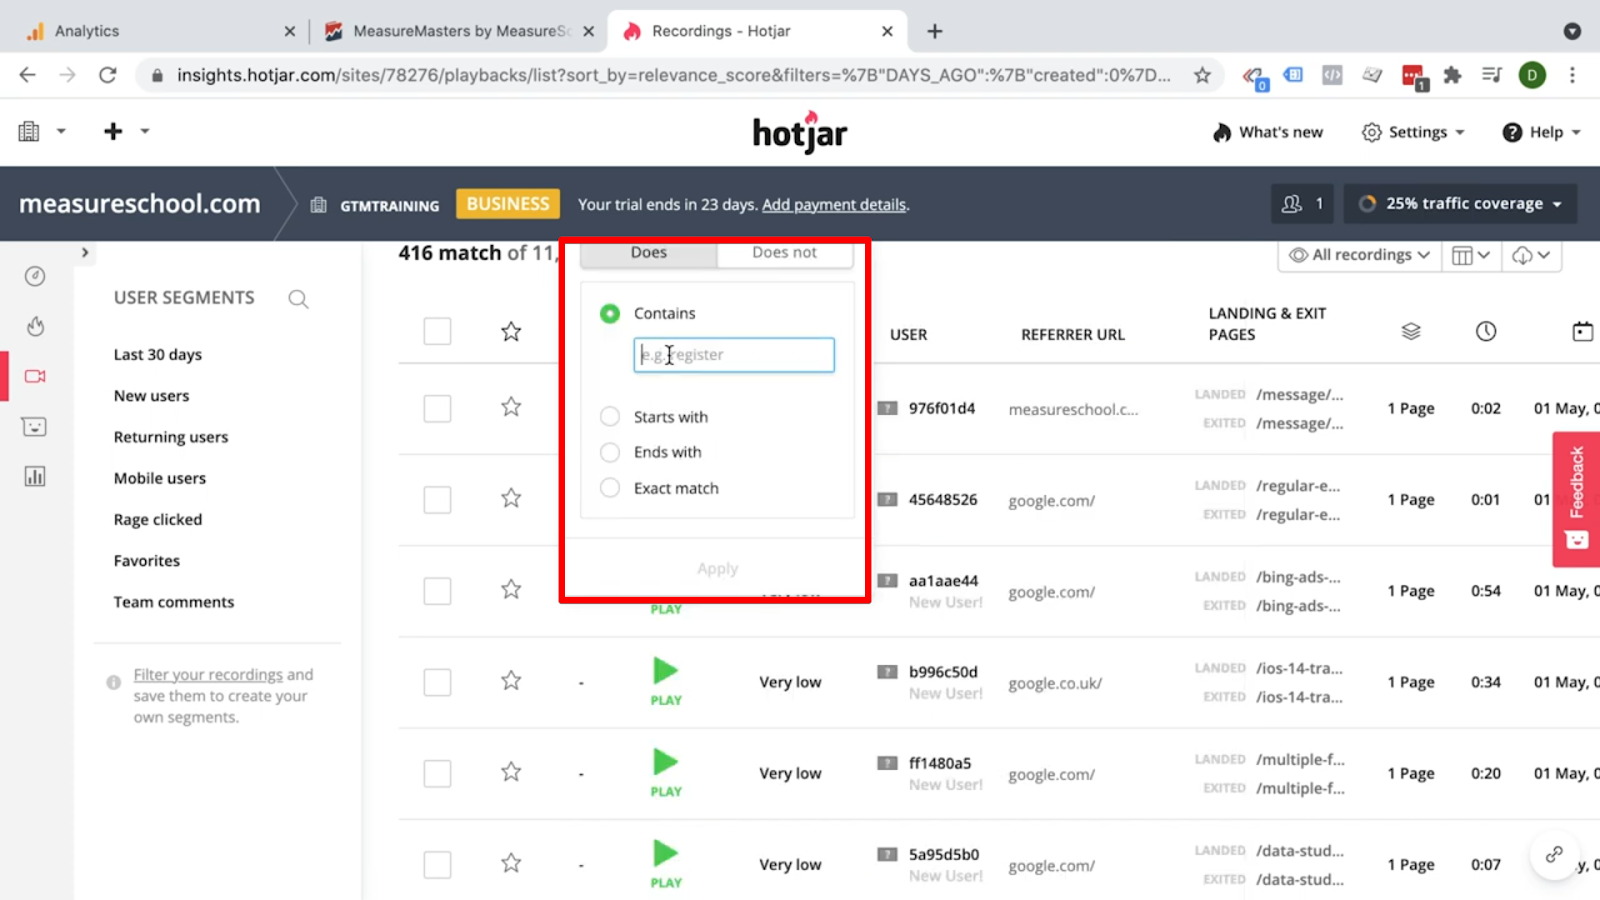
And then you have your recordings here available and you can start watching a video.
I have one recording already here. Let’s take a look at it.

You can see how the user is going through our website. You can see his mouse movements.
Then he goes over to our landing page scrolls a little bit down and then reads this text with his mouse pointer.
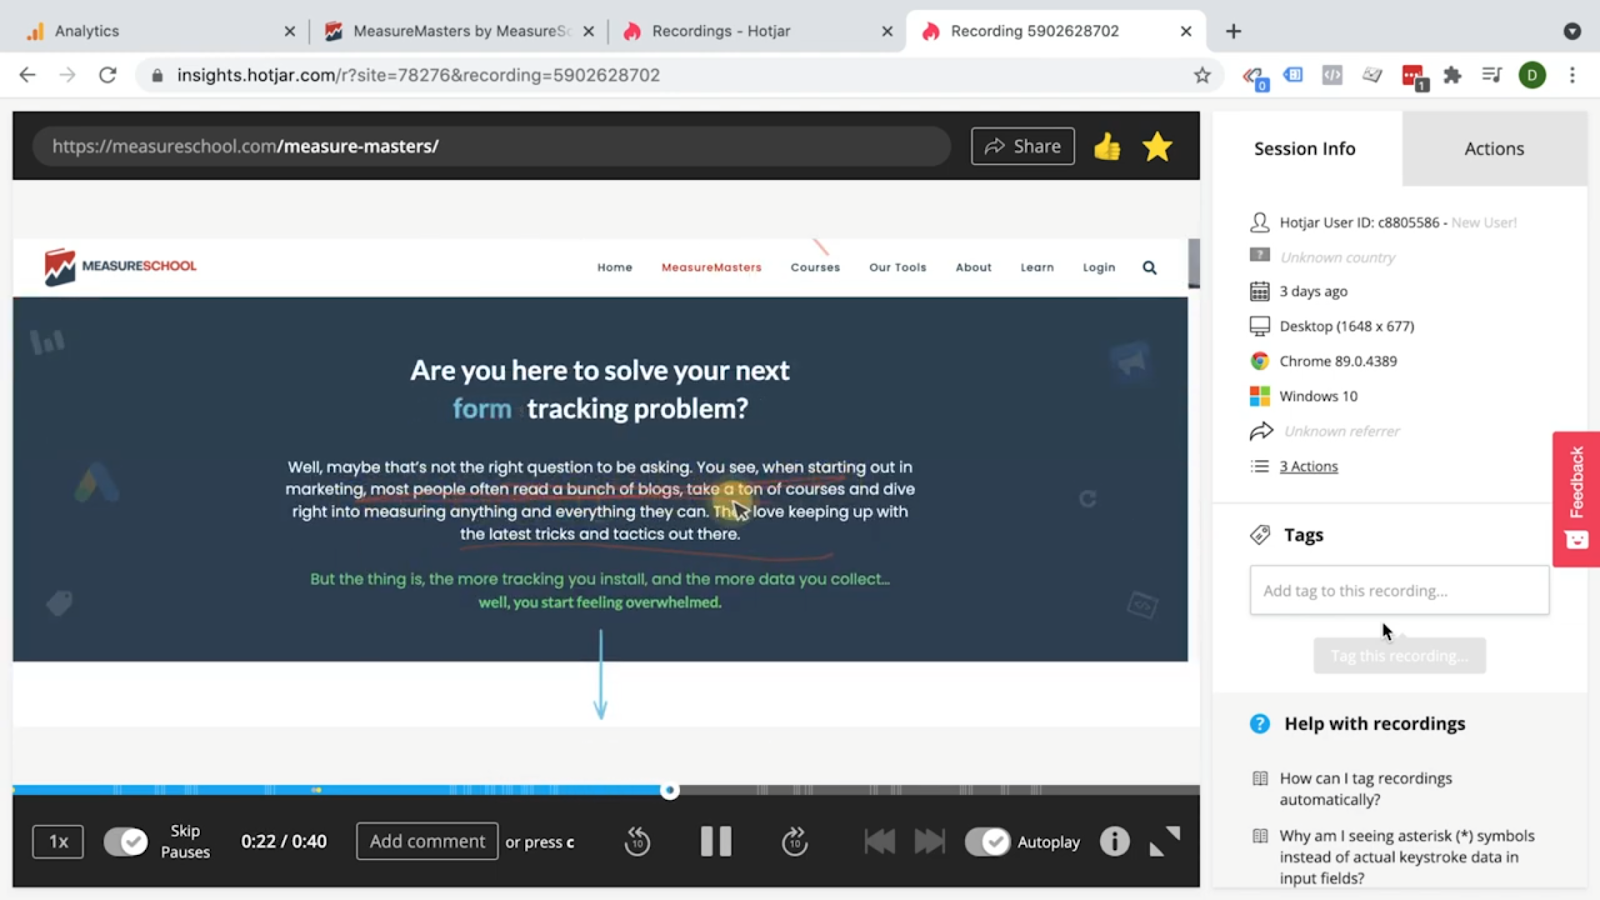
Obviously, it’s pretty important to get that text right.
And then on the third element, the user leaves the website.

So that might be something we want to be making others aware of.
You can at any point Share a recording to the parties involved or to your stakeholders.

We can also go ahead and any time, stop the recording at the point where we see that our funnel is failing and input a comment.

Later on that can help us to identify our recordings and find the evidence that we are looking for to form a proper hypothesis.
You can also input Tags to your recordings.

With Tags you can batch them up and look at them all together.
This player also has the added functionality that you can toggle the recording speed.
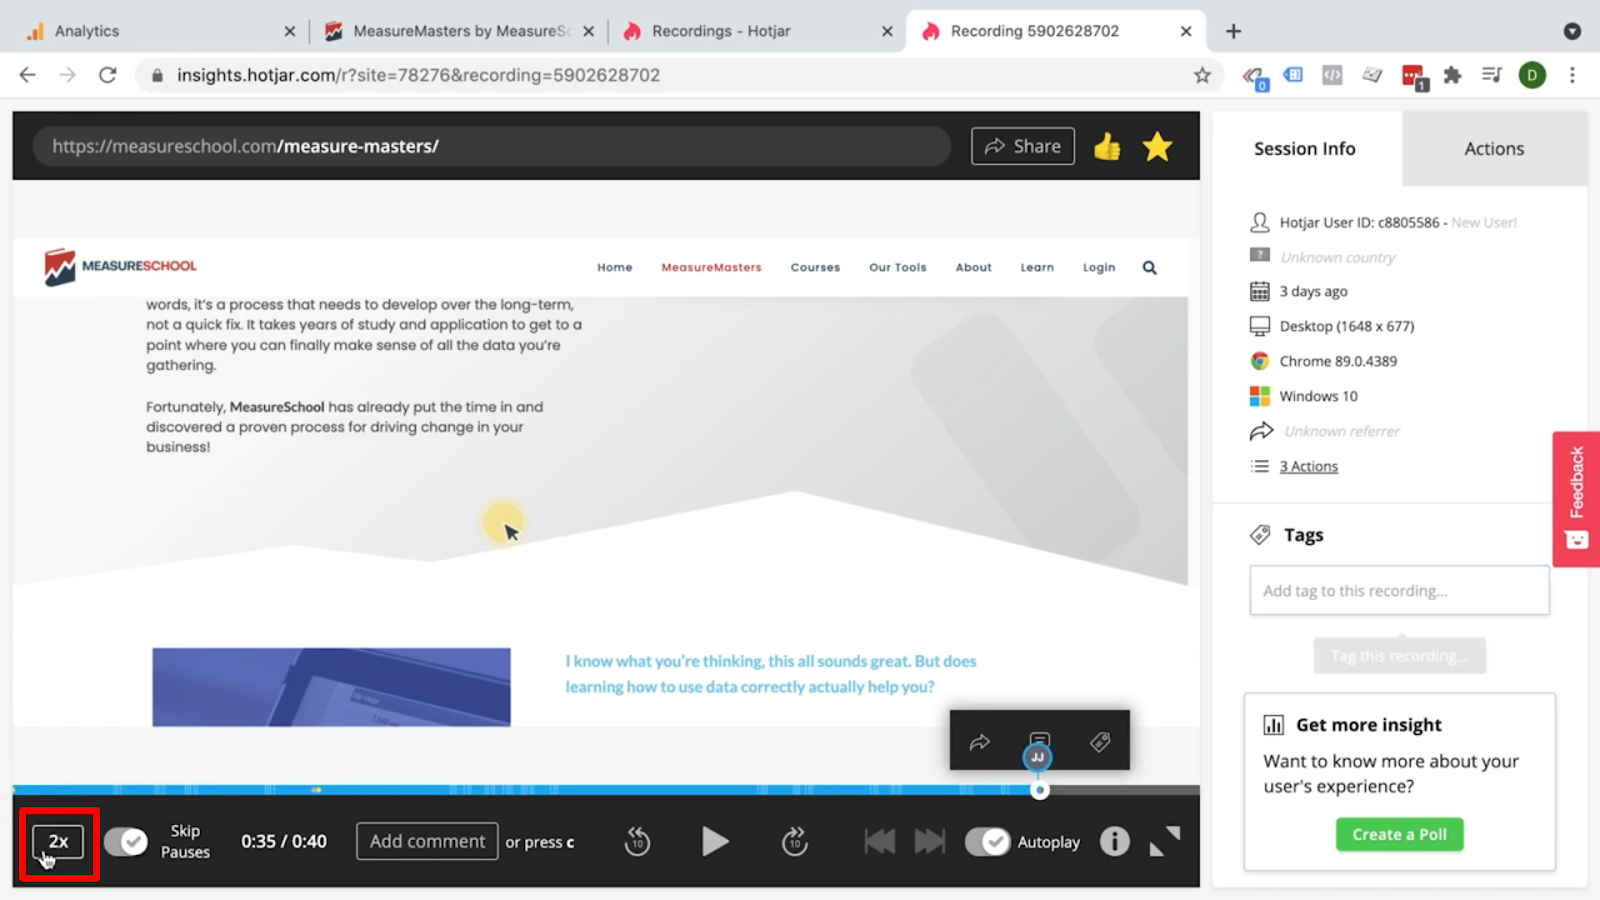
So you can go through many recordings in rapid succession.
You’ll be able to see any kind of patterns in many of these different recordings.
You can see how recordings can be super valuable because we get an over the shoulder view of the users going through our website.
So now we have a pretty good understanding by looking at Heatmaps then also at our Recordings, what is happening on the website, but that’s always an outside view and we form our own opinion.
Surveys
To gather even more conclusive evidence.
Why not just ask the user about his experience and that’s what we can do with the Surveys feature.

So Surveys are a crucial part, I’d say in your analytics stack, because here you can actually walk up to the user and ask them a question.
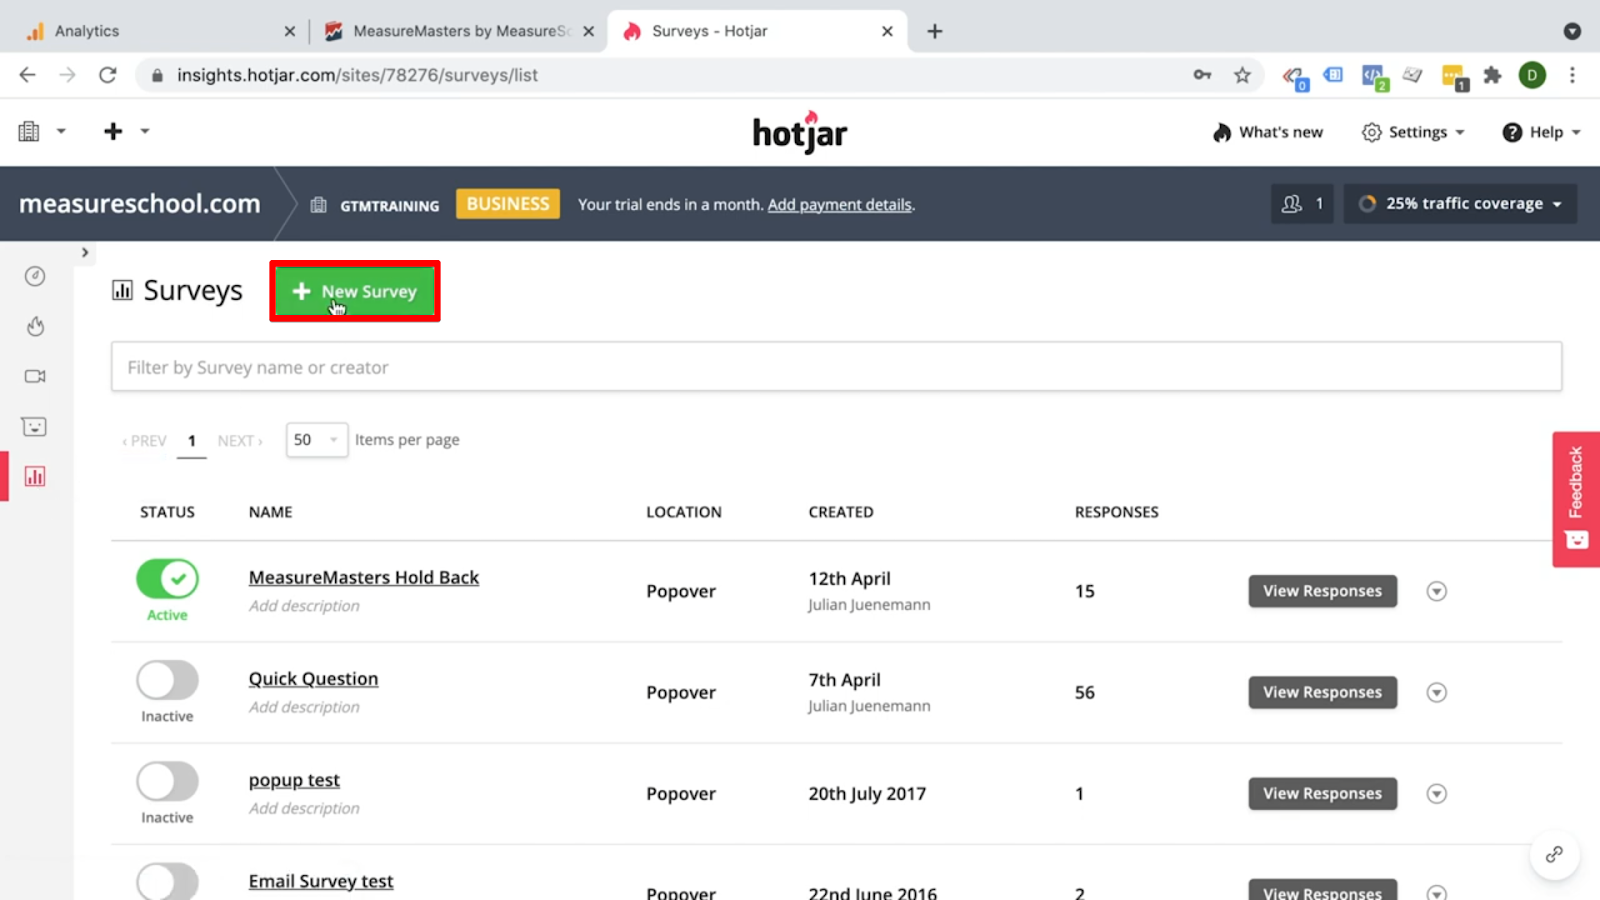
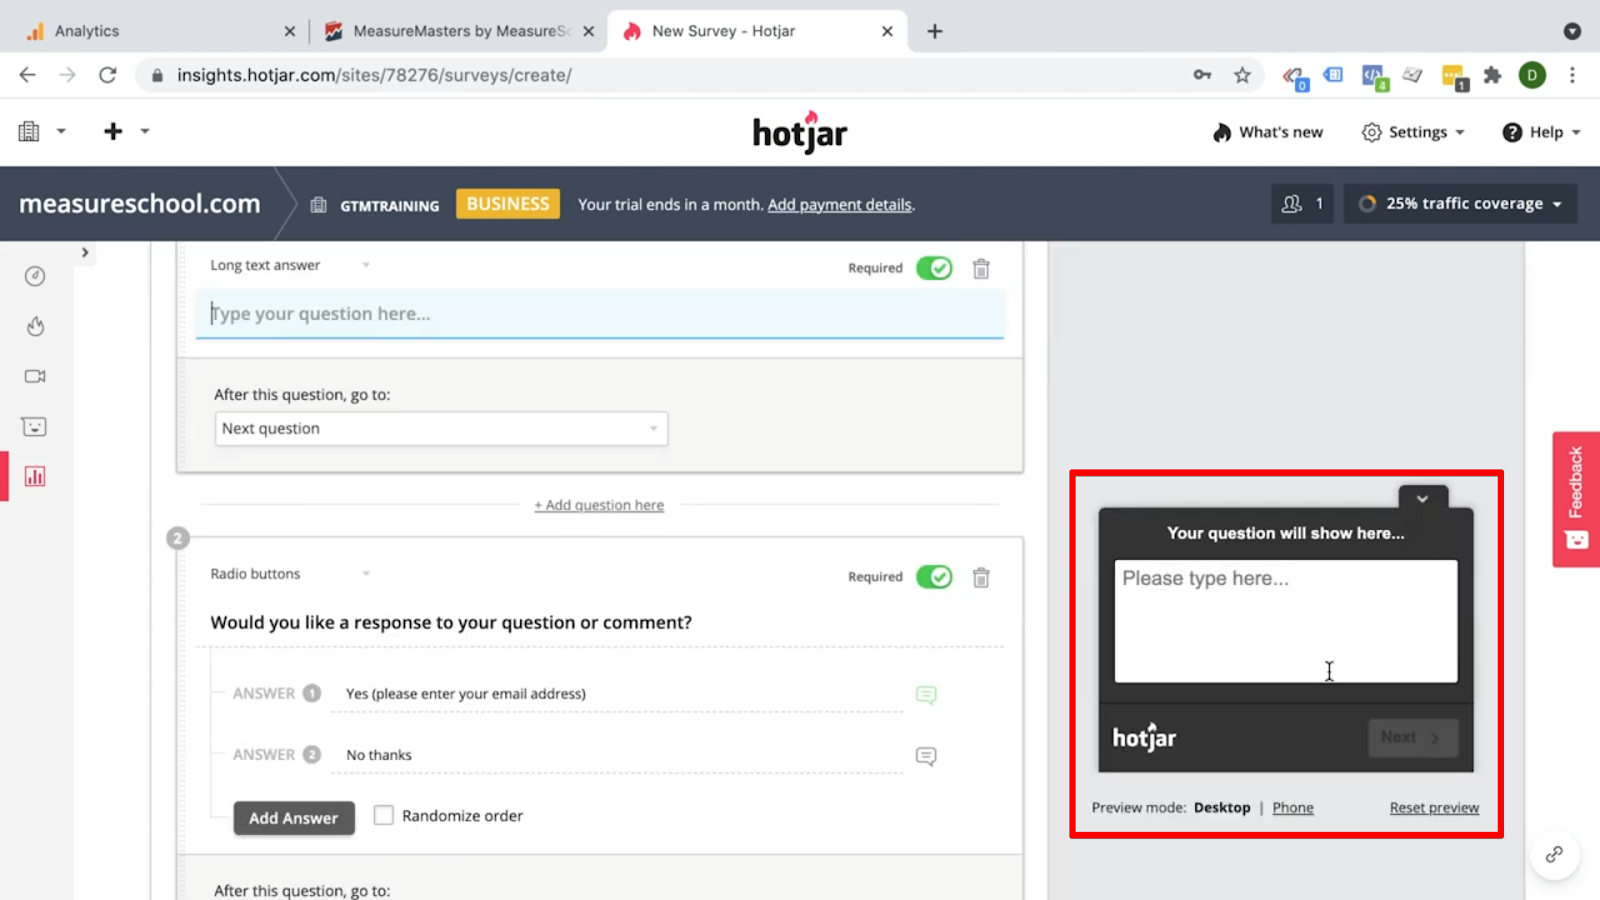
That can be quite powerful when you try to get an insight and all you need to do with Hotjar to run little surveys, especially pertaining to when the user is actually on your website is to click the New Survey here.
Put in a name here.
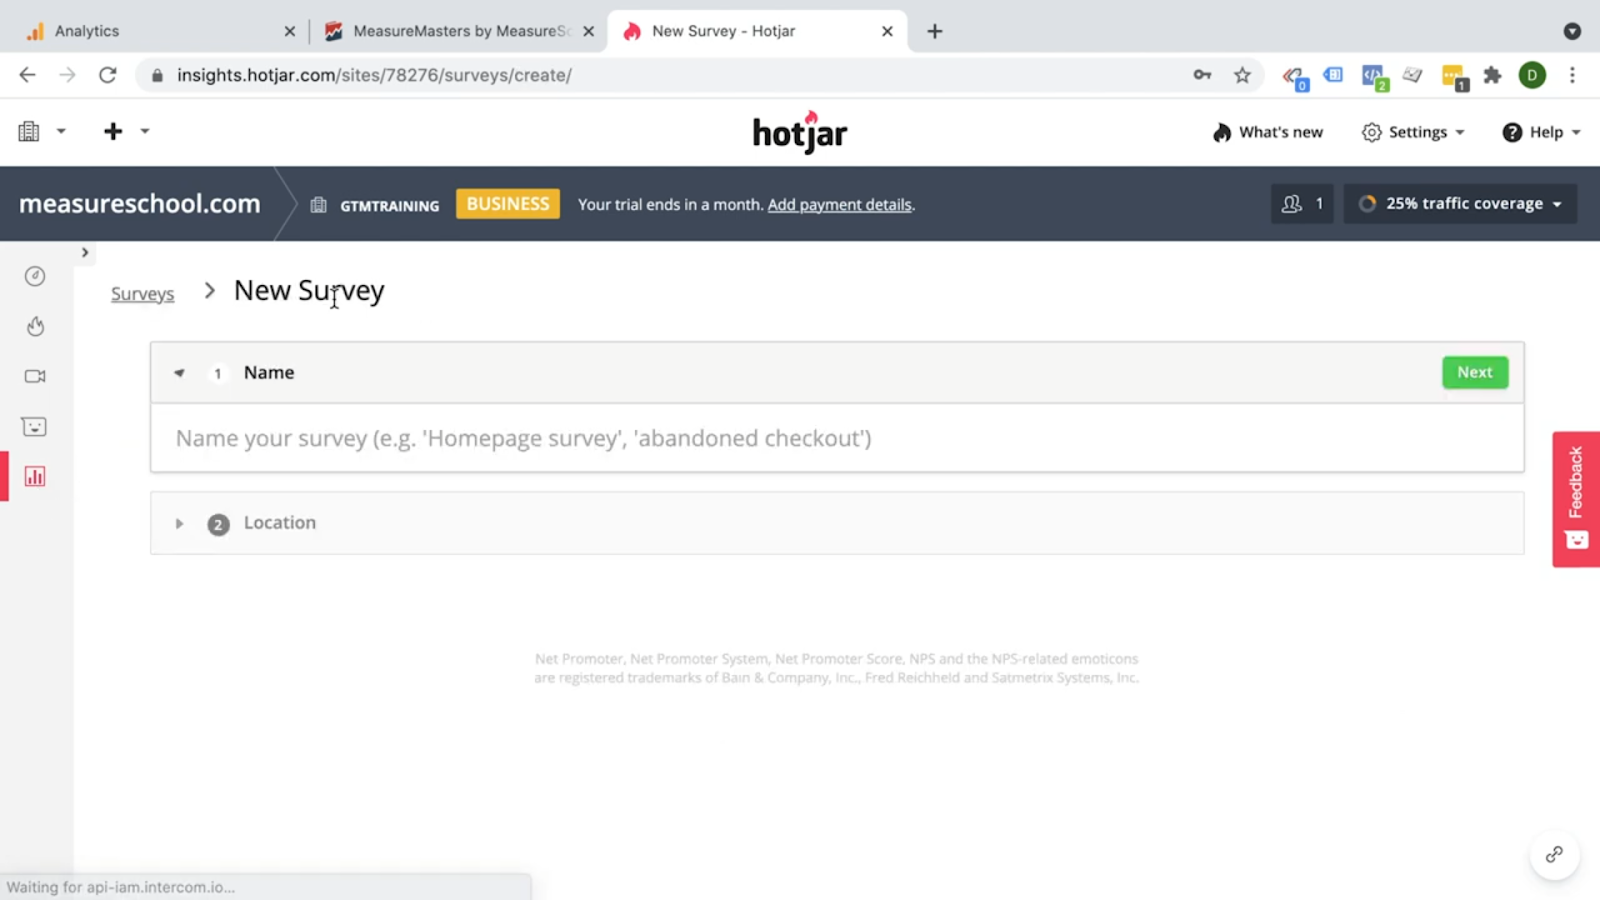
Then you can create a Popover survey, a Full Screen survey, or an External Link survey.
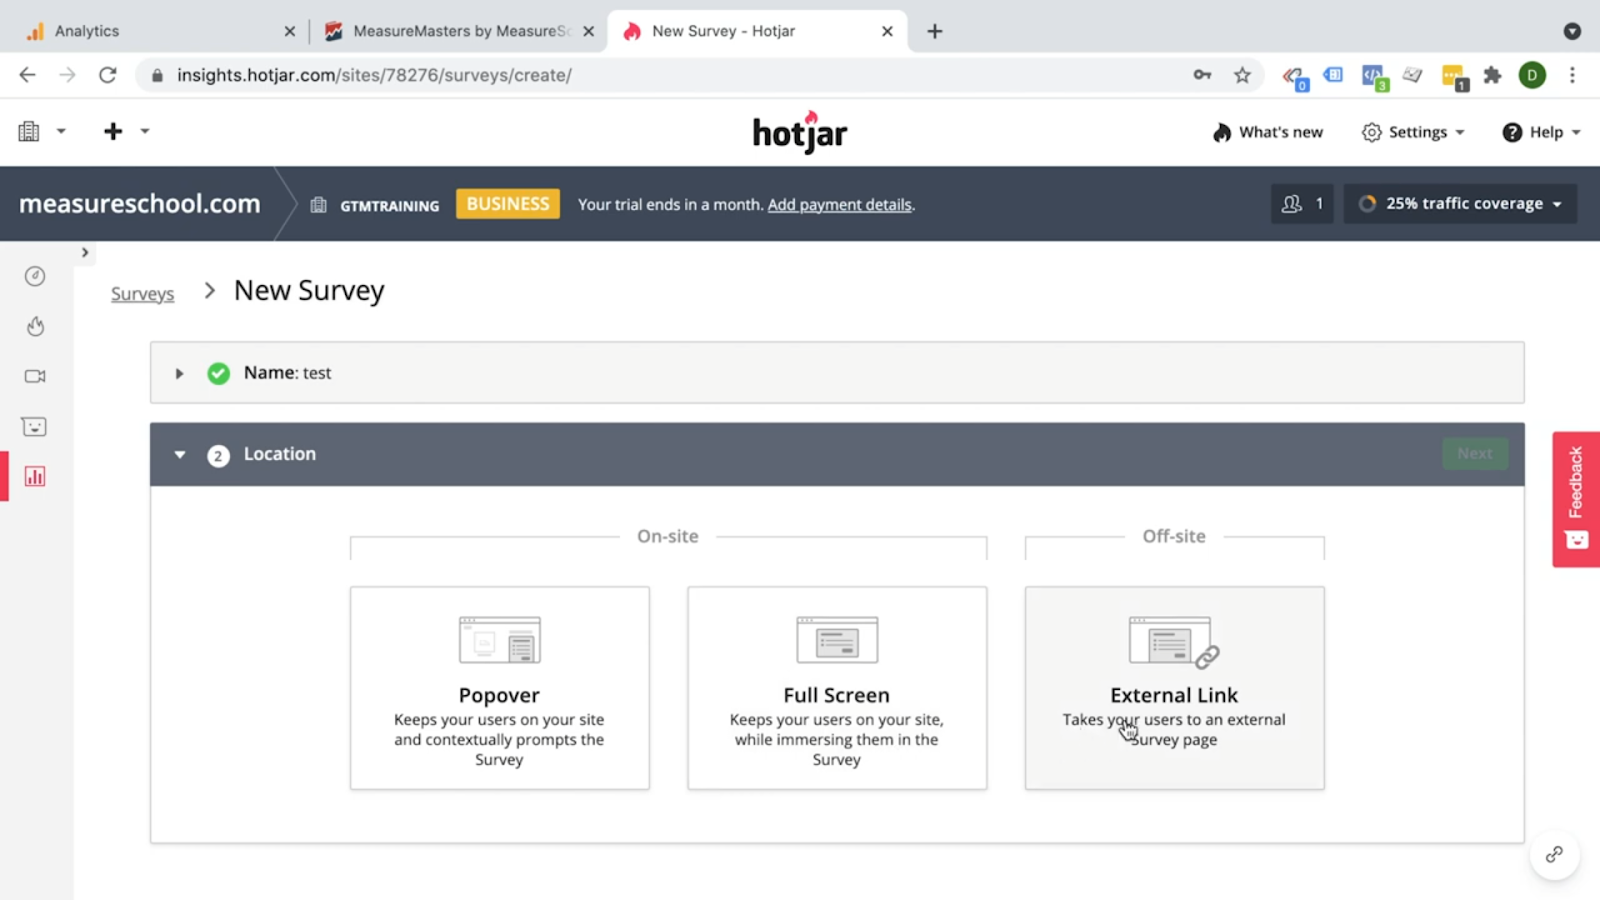
You want to have a little pop-up, for example, that comes up like a toast widget here and you can ask any question you want.
And which question do you actually ask?
Hotjar has some really cool suggestions here in the Question Bank.

You can just drag and drop the certain question from the Question Bank that you want to insert in your survey.
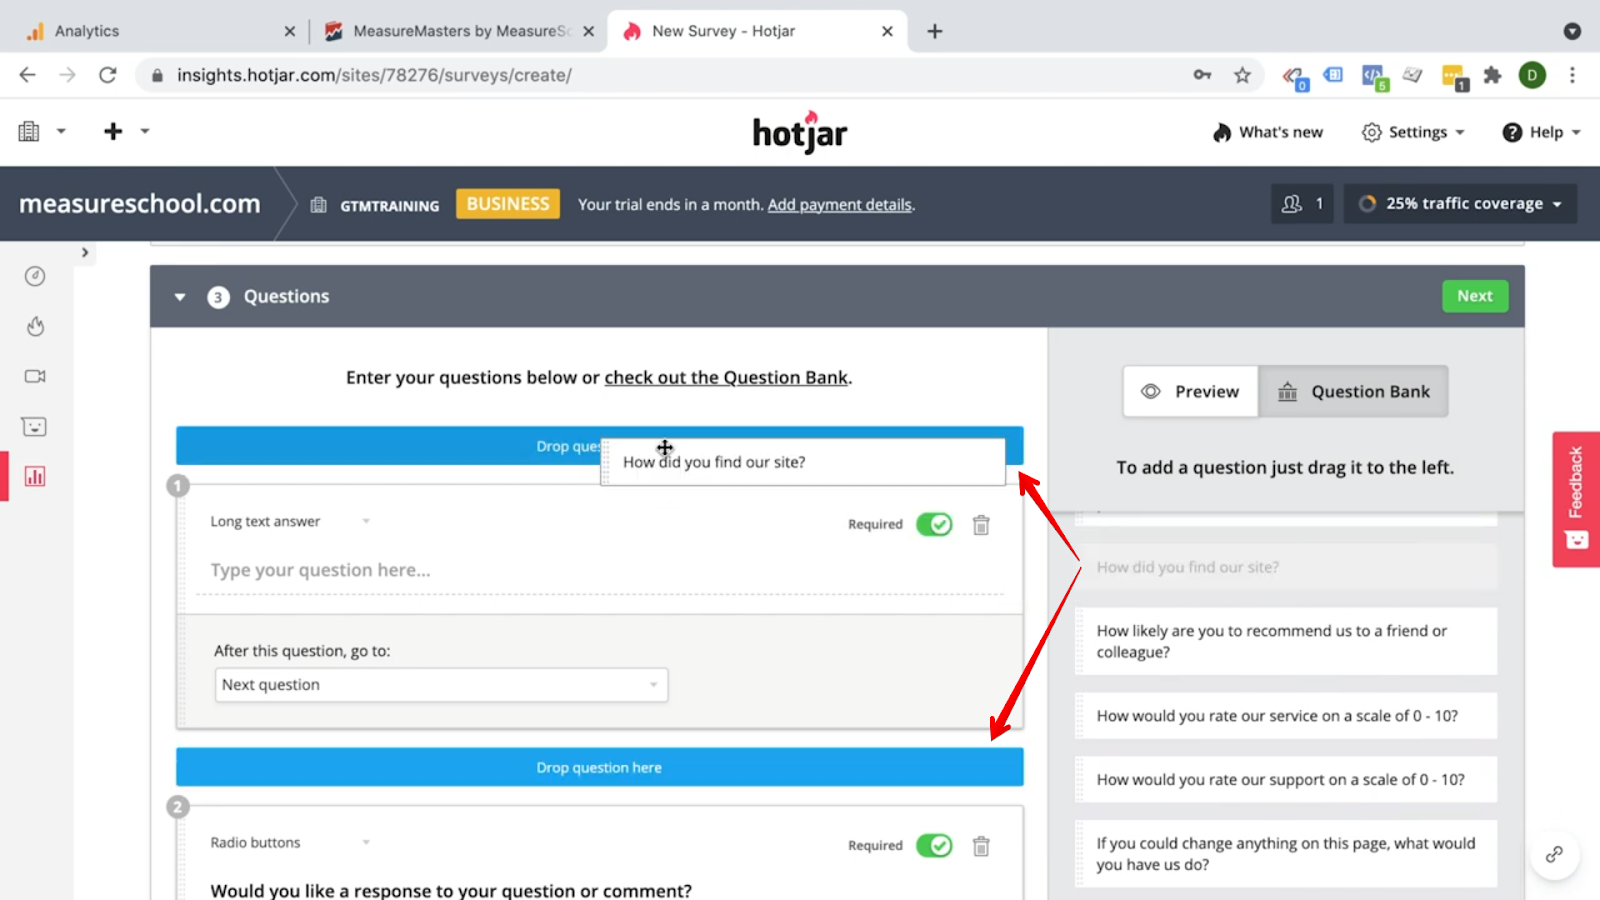
And it’s now a question within our survey, and we can ask our users how they found out about us.
Moving on when you are going through this setup here, you can target specific users.
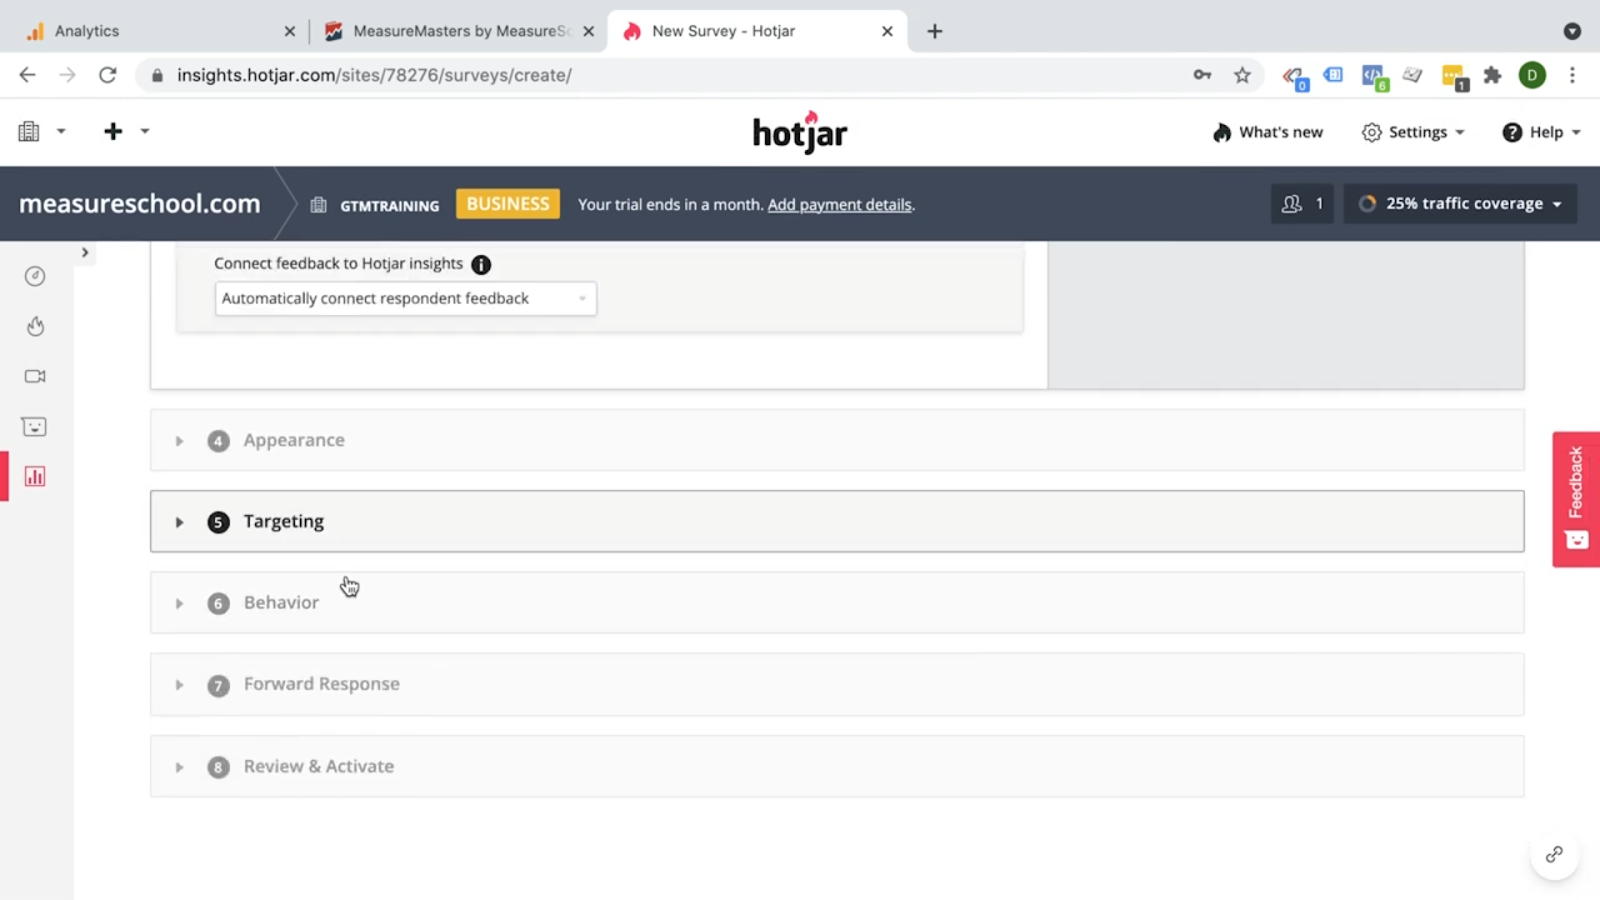
You can say when it should actually show up.

You can also forward your response.

And this can be powerful when you want to react to something that the user put into one of these feedback surveys.
You can forward your response to Slack or via email.
This is actually something you can also see your client in, if there are certain complaints that you want to make sure that the client actually sees.
This makes Hotjar very actionable on the data that we can gather in the tool.
And later on, once you have it all together, you can go ahead and look at the results.
So we ran two surveys here, one directly on our Measure Masters page, where we ask, is there anything preventing you from signing up at this point?
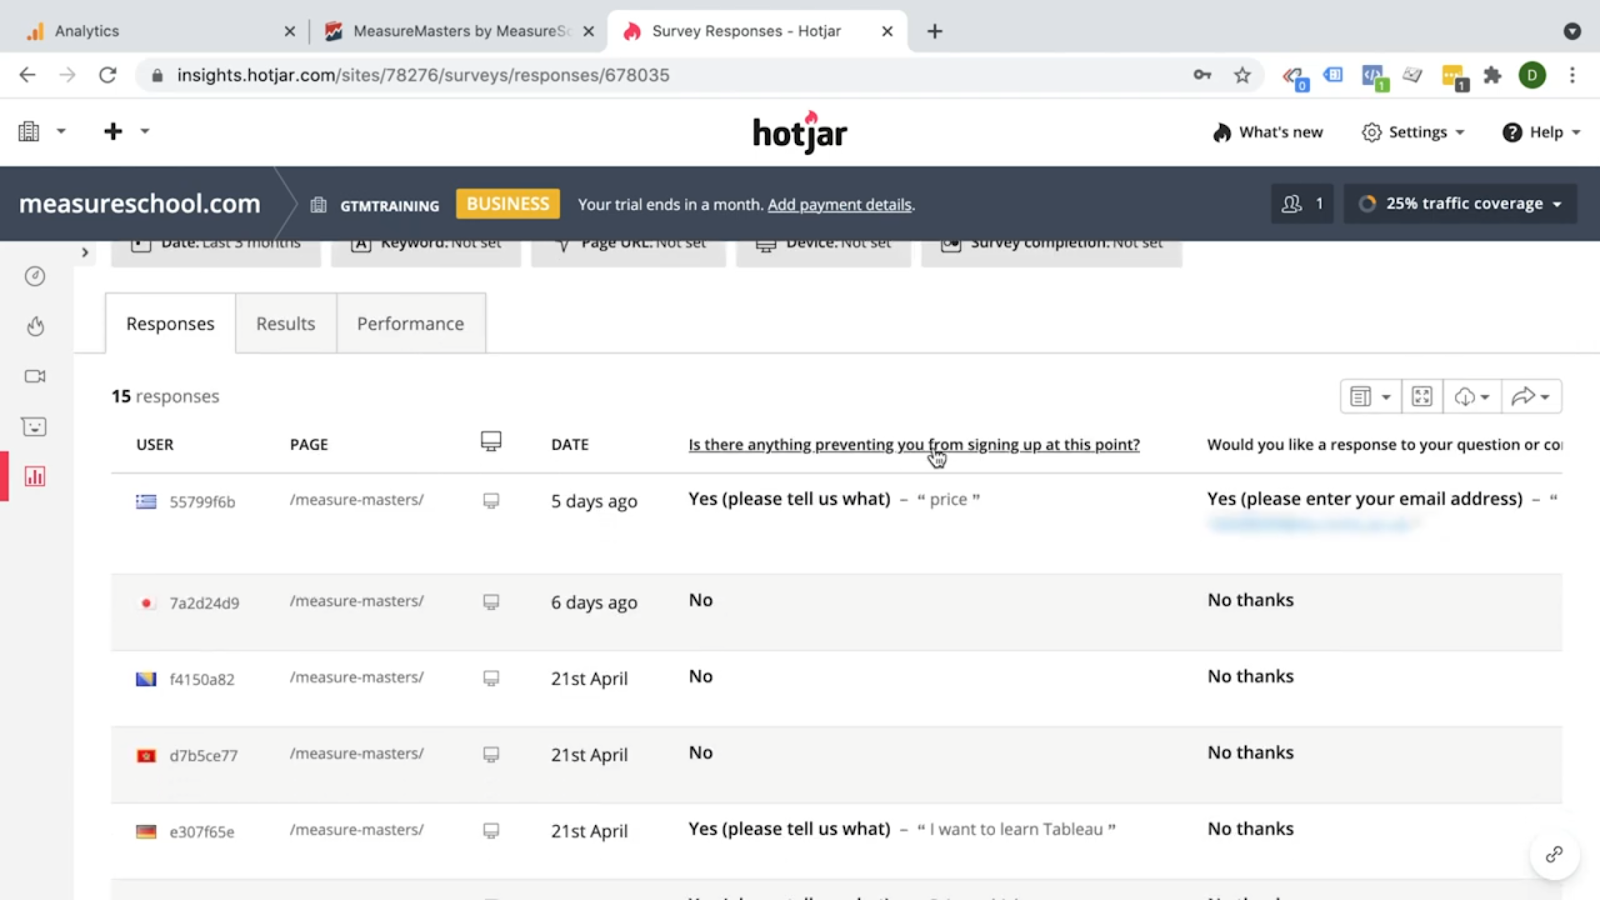
We got various answers.
These results might give us some ideas of what needs to be changed in order to answer some of these questions and make sure that the users understand what they’re actually getting.
We also ran a survey earlier to understand our users better.
So we had this quick question survey, where we ask, what is your measure skill level and who do you work for?
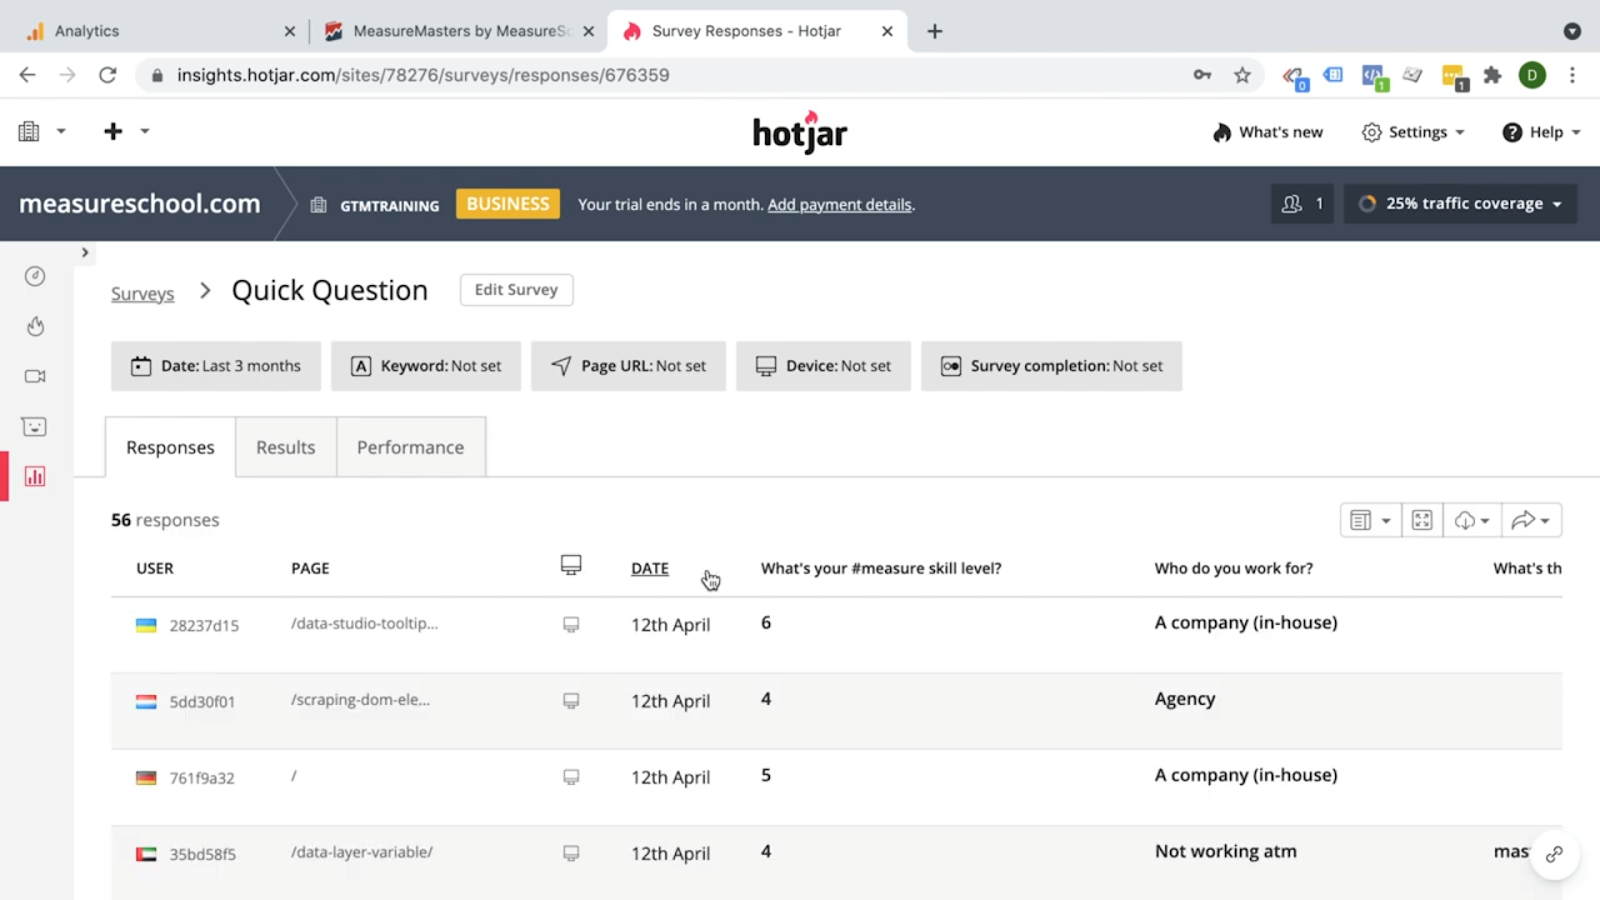
So we understand a little bit better what our users are.
You can go over to the Results here.

And we can look at a chart form.

So our users apparently are in the middle, we have less pro users than total beginners.
And they work mainly as in-house marketers in a company.
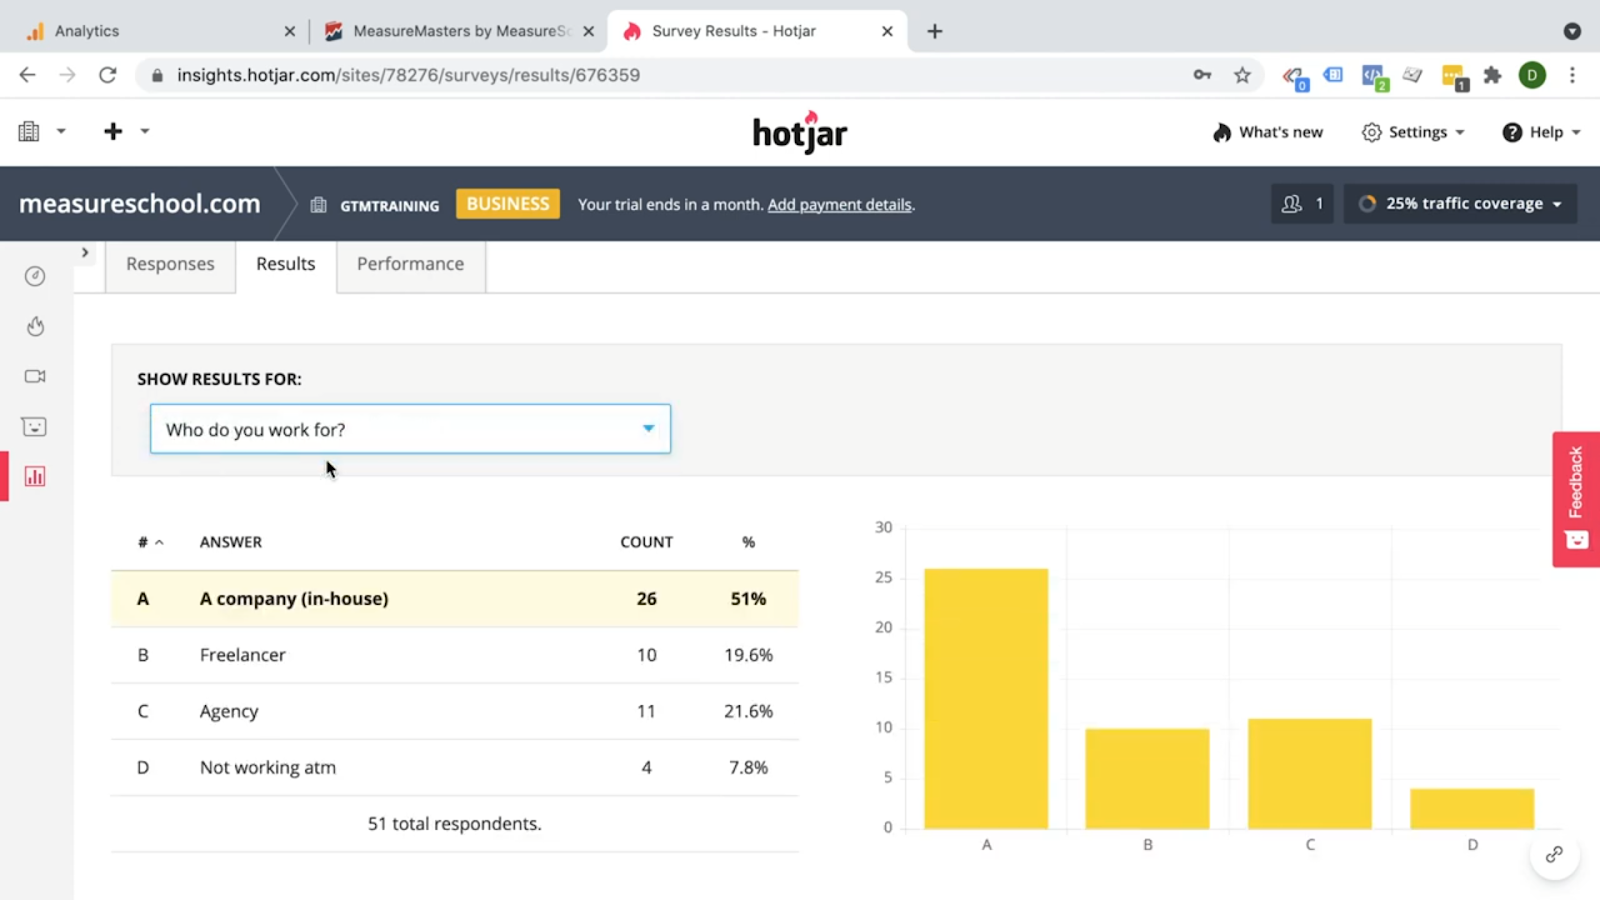
Then we have freelancers and agencies.
So what is the number one problem that you’re trying to solve?

And there’s a nice tech cloud here which shows that overwhelmingly, people need help with tracking.
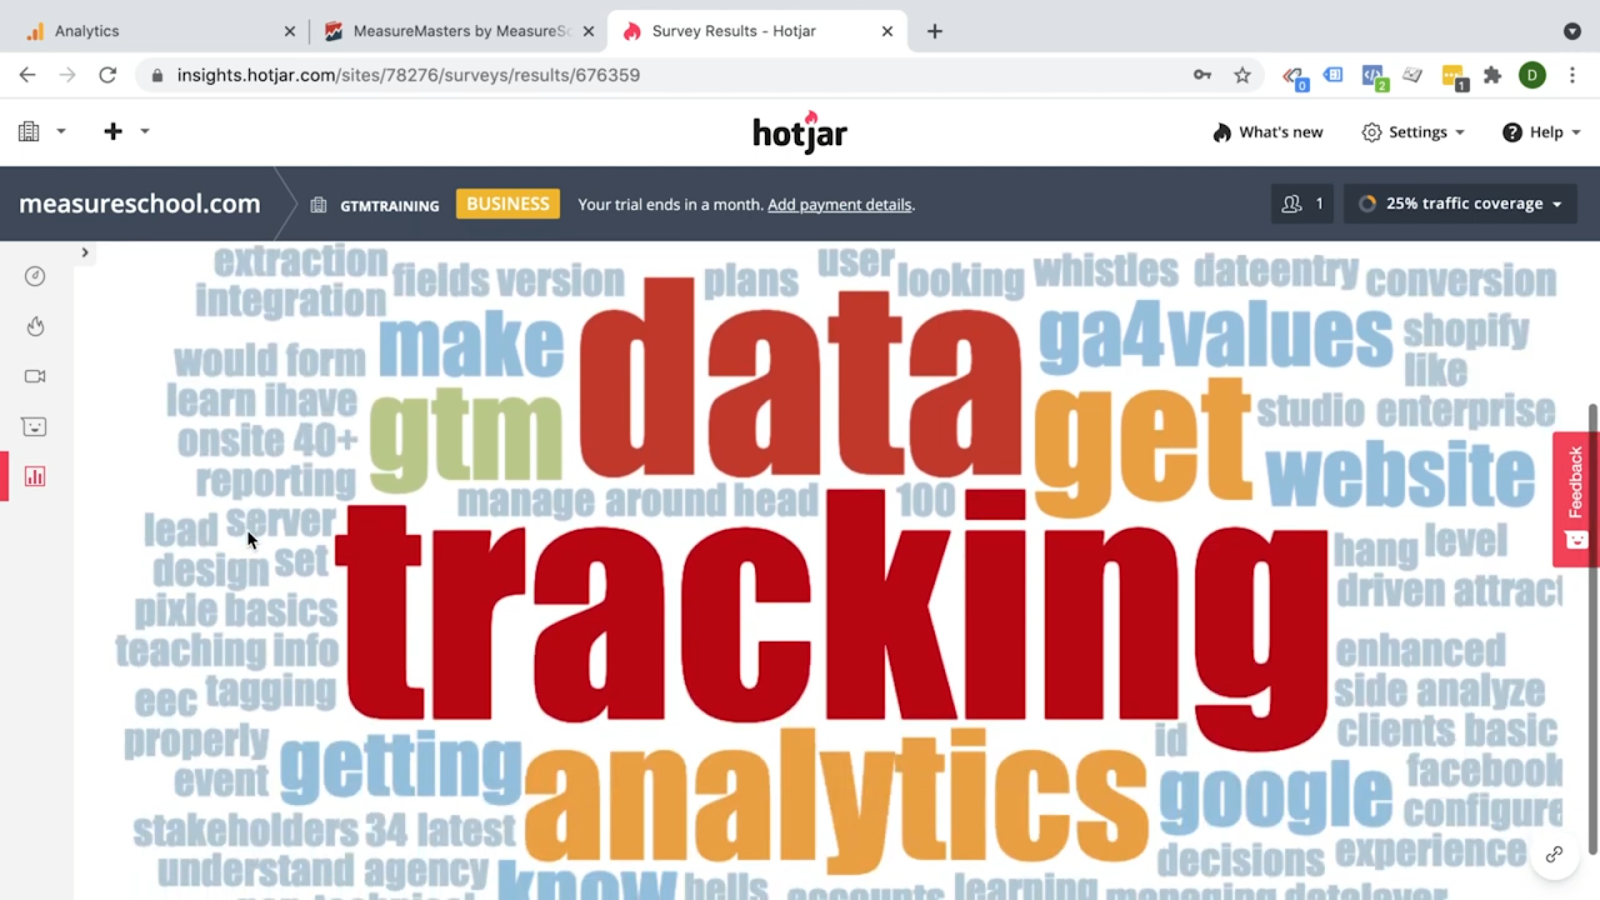
Having that on our page makes it easier later on to segment our traffic and also to create new products, or offerings that we want to bring to the Measure School crowd.
So a lot of questions that you might have asked inside of Google Analytics might be somewhere in the data but it’s hard to read.
With a survey feature like that you can just go up to your users and actually ask them and gather evidence.
That’s why all of these different tools really help us to know our users better, to know how they behave and get a feeling of what we might need to change on our website.
How to Use Google Analytics & Hotjar Together
You might be asking yourself, what can I do now with everything that we have discovered in Hotjar and Google Analytics?
There are several paths to go down from here, but with all the research that you have done to this point, hopefully now you come up with a very strong hypothesis, very strong recommendations.
What would you be changing on your website? I would get all that evidence and show it to people and actually show them visually your Heatmaps, your session Recordings that you have gathered.
So they can also understand where you’re coming from and how you would be changing the website for the better.
If you need more data, obviously you could run an A/B test, with tools like Optimizely, but certainly don’t forget to keep measuring your results.
Google Analytics, and Hotjar integrate well with these tools and you’ll be able to follow along with what the users are doing, and if they are receiving your new website the way you wish they would.
FAQ
Can I use Google Analytics and Hotjar together?
Yes, Google Analytics and Hotjar can be used together to complement each other’s capabilities. Google Analytics provides quantitative data and metrics, while Hotjar offers qualitative insights. By combining the two, you can get a comprehensive understanding of user behavior and make data-driven decisions to optimize your website.
How can Hotjar’s visualizations help optimize my website?
Hotjar’s visualizations provide valuable insights into user behavior, allowing you to identify areas of high engagement, discover potential issues or blockers, and optimize your website accordingly. For example, heatmaps can help you determine the effectiveness of your call-to-action placement, while session recordings let you see the user experience from their perspective.
How can I use Hotjar surveys to gather user feedback?
Hotjar surveys provide an opportunity to directly ask users questions about their experience on your website. You can create pop-up surveys and ask questions related to specific pages or user actions. Surveys help gather qualitative feedback, which can further enhance your understanding of user needs and preferences.
Summary
So for the final question in conclusion, in the showdown of Google Analytics vs Hotjar, which one is better?
Google Analytics is a better choice for quantitative data analysis as it measures everything in numbers. However, when it comes to qualitative data view Hotjar reigns supreme.
Therefore, it isn’t a question of either/or, but both work well together in parallel and they have their strengths.
If you’re still not sure if this combination actually makes sense for you, I’d recommend just trying it out.

If you’re looking for more tools to use with GA4, Microsoft Clarity might be the perfect choice. Check out our Microsoft Clarity vs Google Analytics guide and find out.
Did you like our Google Analytics vs Hotjar analysis?
Check out our comparison of Google Analytics vs Google Tag Manager!
Are you also combining Hotjar with Google Analytics? Let us know in the comments below!
Master the basics with our FREE GA4 Course for Beginners


")
Hello Julian, thank you very much for the comparison and the suggested tips. I, like probably many of the owners of websites, have been using Analytics. But since the GDPR I have been looking for alternatives and my Consent Management platform suggested Hotjar, as the regulations for it in Europe is easier to understand and follow up. There is still hope for Analytics, but for now I am currently making the switch and must say I am really happy to be using Hotjar.