Last Modified on December 23, 2024
Creating dashboards in Google Analytics 4 (GA4) facilitates how you analyze data.
While tools like Looker Studio are excellent for creating visually appealing dashboards, the built-in features in GA4 are versatile, particularly for users who spend significant time within the GA4 interface.
This guide will take you through customizing reports, navigating the Report Library, and leveraging advanced tools like Explorations.
By the end, you’ll have a clear understanding of how to build Google Analytics 4 dashboards and GA4’s dashboard capabilities.
We’ll cover:
- How to Build Google Analytics 4 Dashboards: Customize Report Feature
- Other Features of the Customize Report
- Report Library
- Collections
- Topics
- Permissions
- Let GA4 Give You a Quick Tour
- How to Edit, Manage, and Create Reports in the Library
- Explorations
- Looker Studio
Let’s dive in!
1. How to Build Google Analytics 4 Dashboards: Customize Report Feature
If you frequently use GA4’s standard reports, you’ll appreciate the ability to customize them. Often, these reports provide most of what you need, except for a few missing dimensions or metrics.
Customizing reports not only saves time but also reduces repetitive tasks.
Let’s take the Traffic Acquisition report as an example.
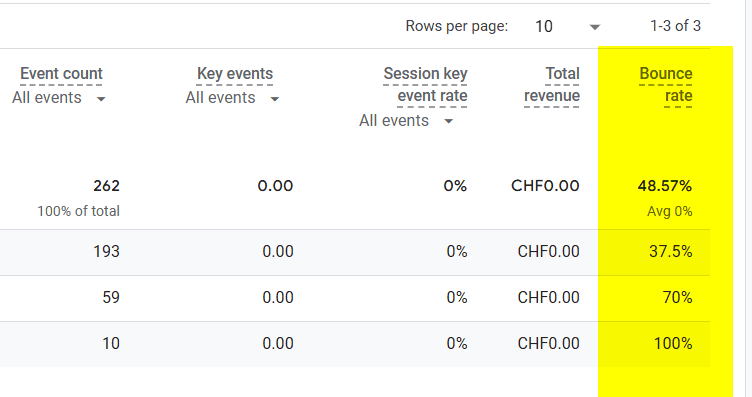
This report helps you understand where your traffic comes from and how your channels perform. Suppose you want to include the Bounce Rate metric to assess underperforming sources better. Follow these steps:
- Open the Traffic Acquisition report (or another report of your choice).
- Click the pencil icon in the top-right corner.
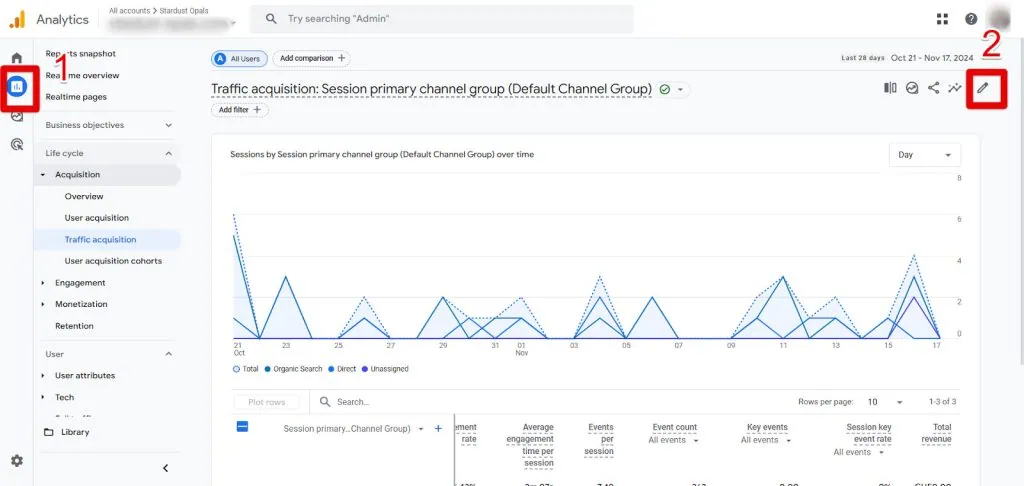
- Under Report data, click Metrics.
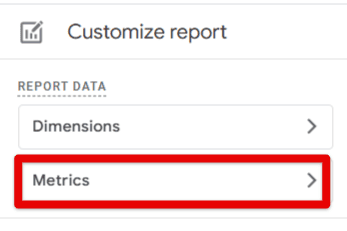
- Use the Add metric search bar to find and select the desired metric (e.g., Bounce Rate).
- Click Apply to confirm your changes.
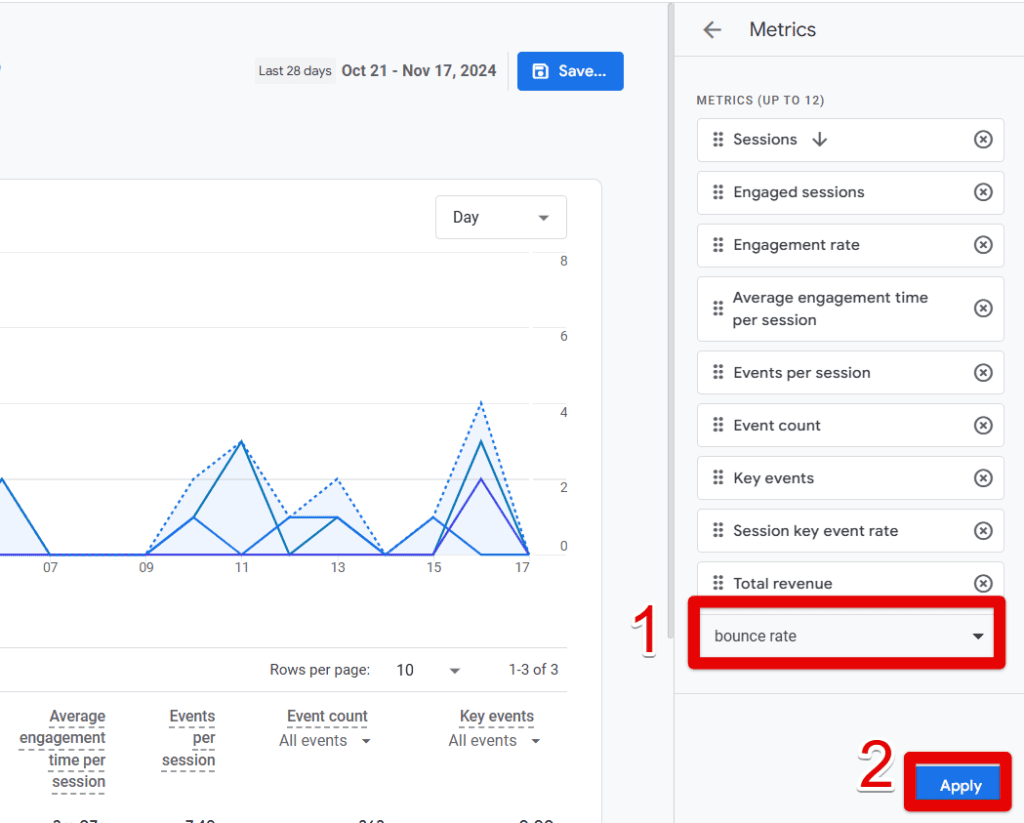
Once added, the Bounce Rate metric will appear in the table. Always click Save before leaving, and choose to save the changes to the current report or as a new report.
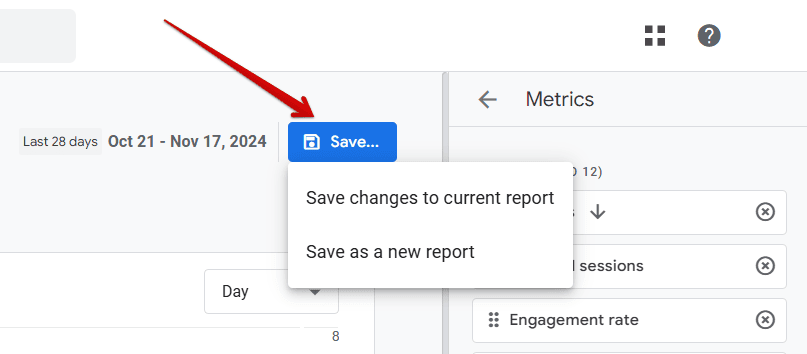
The newly added metric should be visible in your table:
2. Other Features of the Customize Report
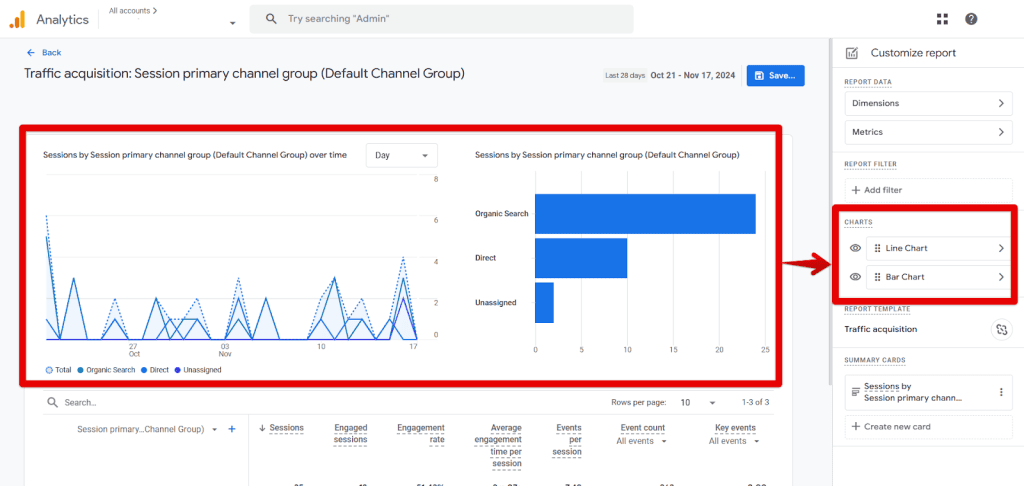
Continuing with the Traffic Acquisition report example, you can take your customizations further. This report includes a chart showing Sessions by Session Primary Channel Group (Default Channel Group).
If you need to tailor these to fit your analysis better, you can modify its contents to include the metrics or dimensions most relevant to you. What you can do:
- Hide and unhide the Line Chart or Bar chart from the report. You can do this by clicking the eye icon.
- Modify the content of the chart by clicking the arrow:
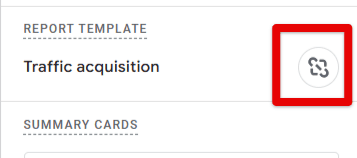
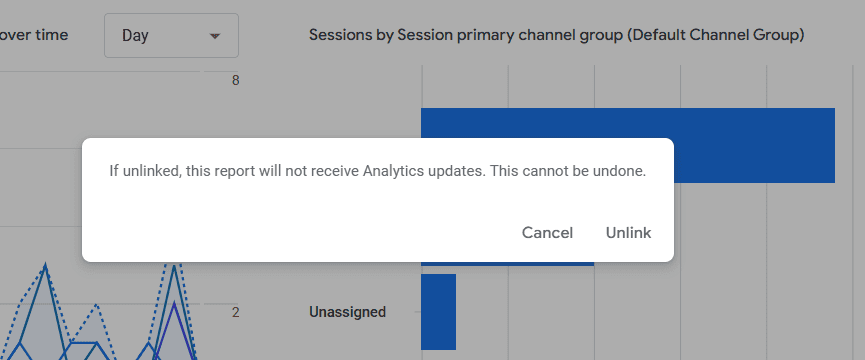
Since this report is based on a GA4 template, you also have the option to unlink it from the template. Unlinking gives you complete control over the report, but it also means you won’t receive updates from Google.
🚨 Note: If you need to revert to the original template later, you’ll have to recreate the report from scratch.
These additional features allow you to fully customize the Traffic Acquisition report, making it more effective for your needs.
3. Report Library
The Report Library is your starting point for organizing and managing reports in GA4. Before diving into dashboard creation, it’s important to understand two key components:
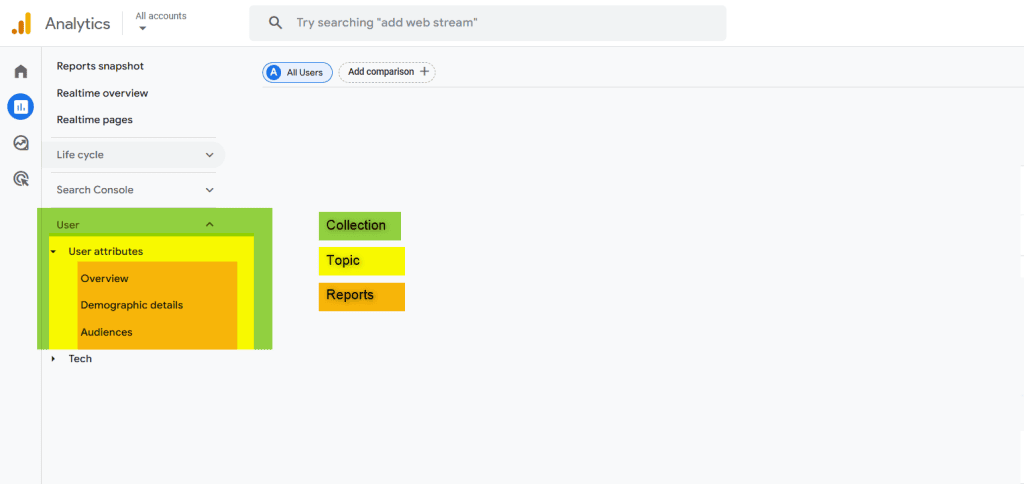
- Collections — Groups of related reports, such as Business Objectives or Lifecycle.
- Topics — Subcategories within collections that organize reports further.
4. Collections
Collections are overarching categories of reports, displayed in the left-hand navigation panel. For example, the User collection contains two main topics:
- User Attributes — Includes reports like Overview, Demographic Details, and Audiences.
- Tech — Covers reports such as Overview and Tech Details.
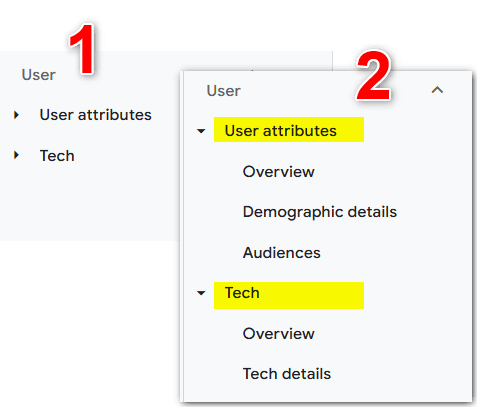
You can customize collections by adding, removing, or rearranging reports, thus tailoring the navigation panel to your needs.
5. Topics
Topics function as subcategories within collections. Consider collections as folders and topics as dividers that group similar reports together. For example:
- The User Attributes topic focuses on demographic and audience data.
- The Tech topic provides insights into technical details like devices and browsers.
Refer to this image for a clear visualization of the hierarchy between collections and topics:
6. Permissions
Customizing GA4 dashboards requires specific permissions. If you see a message about insufficient access, contact your administrator for Editor or Administrator privileges.
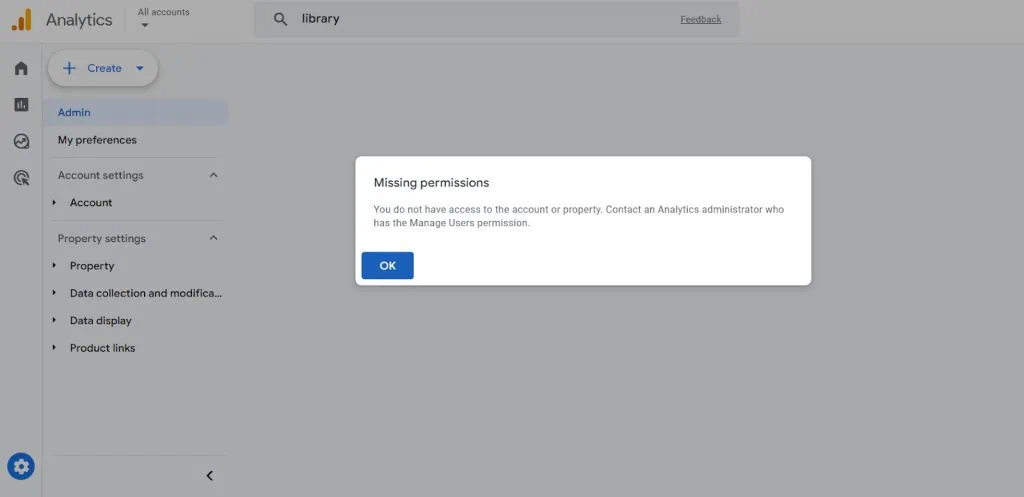
To access the Report Library:
- Navigate to Reports → Library in the navigation panel.
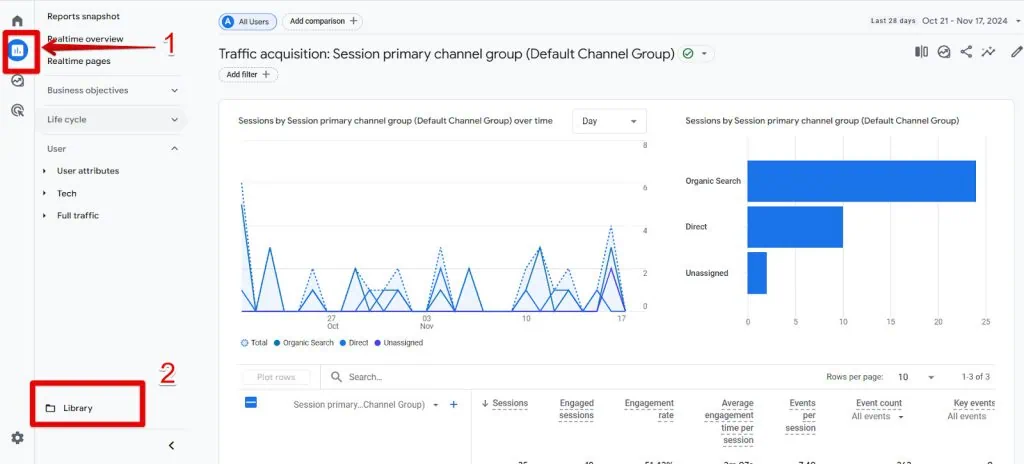
- If the Library isn’t visible, search for it in the top bar by typing Library and selecting Reports → Library.
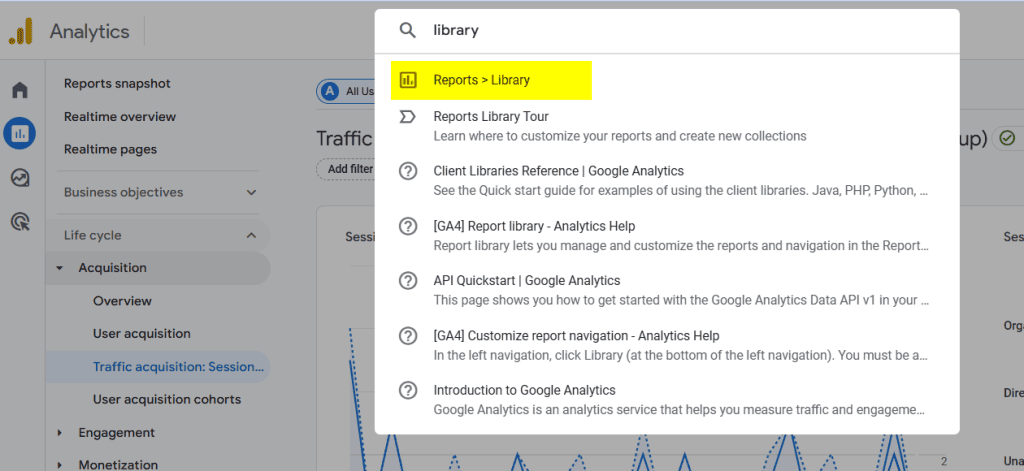
🚨 Note: Occasionally, the Library may not appear due to temporary glitches. Refreshing the page can often resolve this issue. Or use step 2 above.
7. Let GA4 Give You a Quick Tour
When accessing the Report Library, GA4 may prompt you to follow a quick tour introducing its features. This is a great way to familiarize yourself with the interface if you’re new to the tool.
If you’re not automatically invited to take the tour or want to revisit it later, you can manually access it by following these steps:
- Use the top search bar in GA4.
- Type Library and select Reports Library Tour.
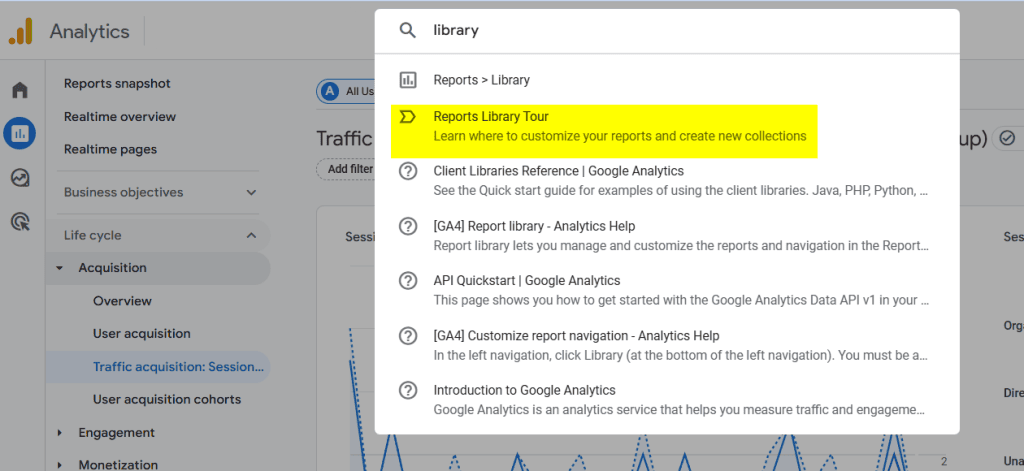
This tour provides a helpful walkthrough of how to navigate and use the Report Library. This ensures you’re equipped to manage and customize your reports effectively.
8. How to Edit, Manage, and Create Reports in the Library
Editing and managing reports in the Library is straightforward. Premade templates allow actions such as:
- Unpublish — Hides a collection from the navigation panel without deleting it.
- Edit — Enables adding or removing reports from a collection.
- Make a Copy — Duplicates a report for further customization.
- Rename — Updates the report name.
For example, to remove a report or a Topic from the User collection:
- Click the three vertical dots on the Collection card.
- Click Edit.
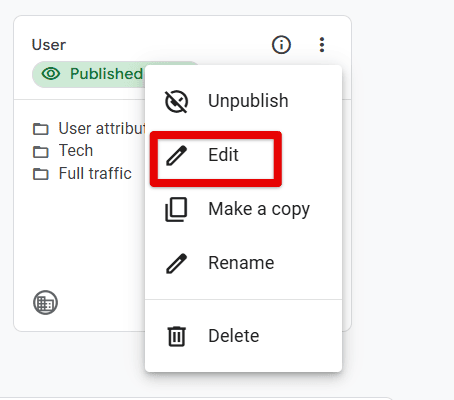
- On the left card, click the X next to the Topic or Report name.
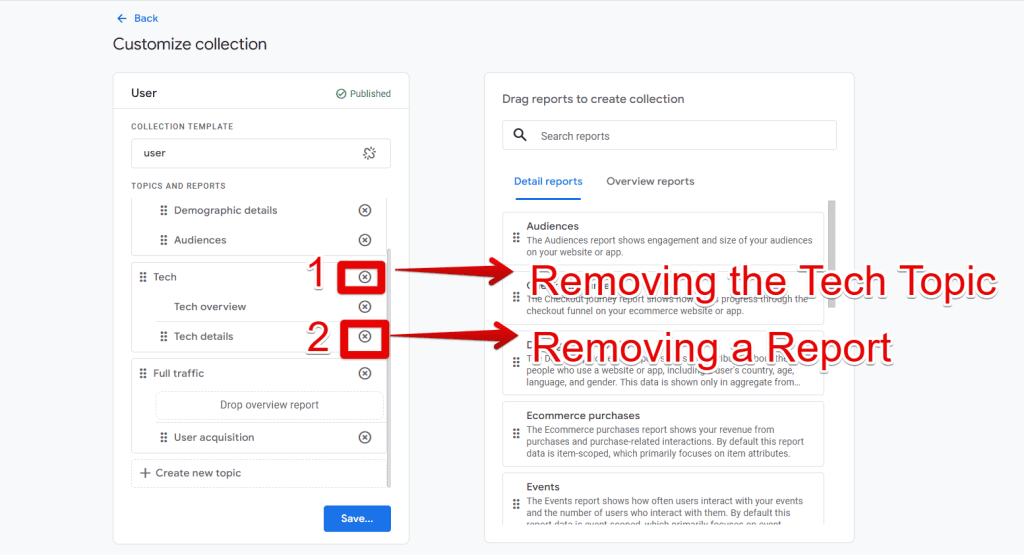
- Drag and drop additional reports from the right card to add other reports.
- Click Apply and Save.
9. Explorations
Explorations in GA4 offer unparalleled flexibility for deep data analysis.
Unlike standard reports, Explorations include additional dimensions and metrics, providing advanced insights. They also offer various techniques to customize how data is presented, including:
- Free-form exploration
- Cohort exploration
- Funnel exploration
- Segment overlap
- User exploration
- Path exploration
- User lifetime
Each technique serves a unique purpose. For example, Cohort exploration is ideal for analyzing user retention trends, while Path exploration helps visualize user journeys. You can learn more in this documentation.
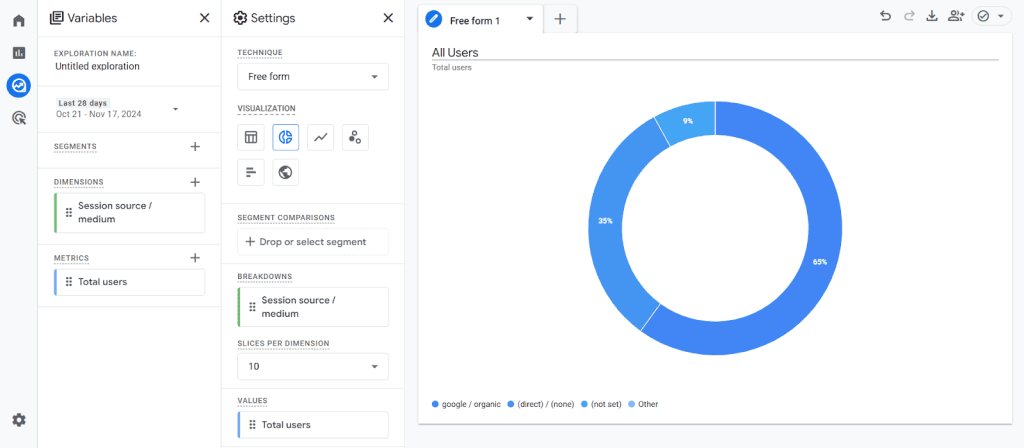
Example: Total Users by Traffic Source
- Navigate to Explore in the left-hand navigation panel.
- Select Blank or a predefined template like Free-form.
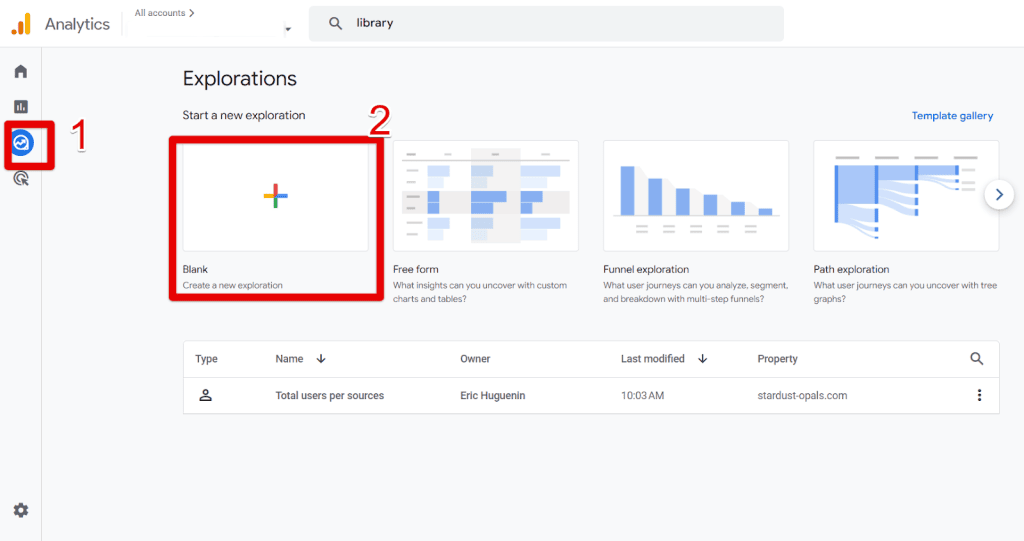
- In the Variables pane, add a dimension (e.g., Session Source/Medium) and metrics (e.g., Total Users) using the + sign.
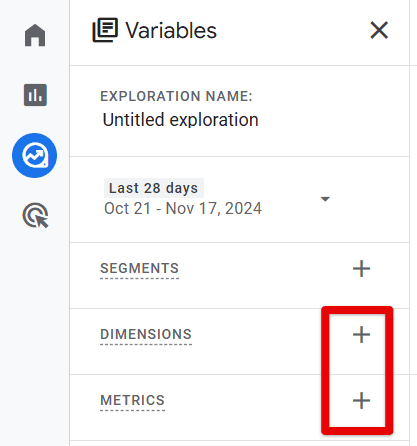
- Search or type the dimension or metric name in the search bar.
- Select and click Confirm.

- Double-click the dimensions and metrics to show them automatically in your reports. Alternatively, drag dimensions to the Rows section and metrics to the Values section.
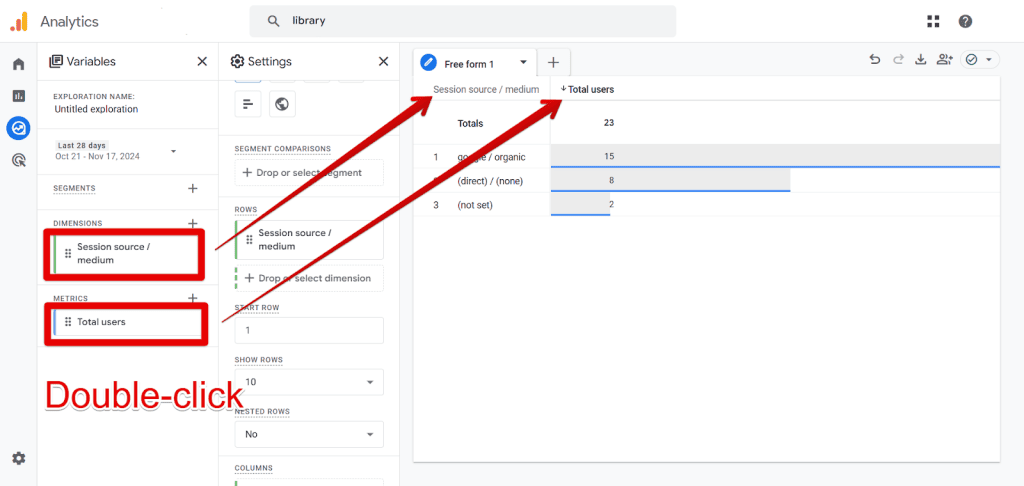
Alternatively, you can change the visualization in your dashboard to a donut chart in the Visualization section.
In the Settings pane:
- Go to the Visualization section.
- Select the Donut chart.
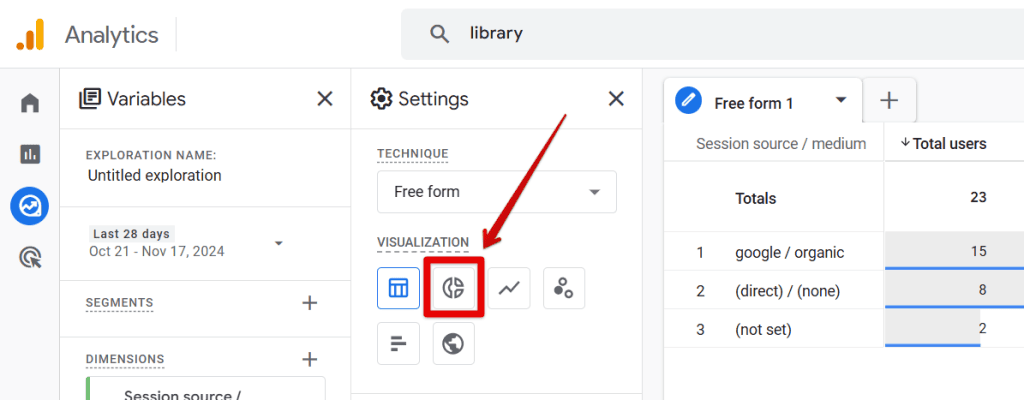
This is the change you should expect:
Since Explorations is a powerful and versatile feature, covering every detail in one post isn’t feasible. However, with the steps above, you’ll have the foundation to explore further.
Looker Studio
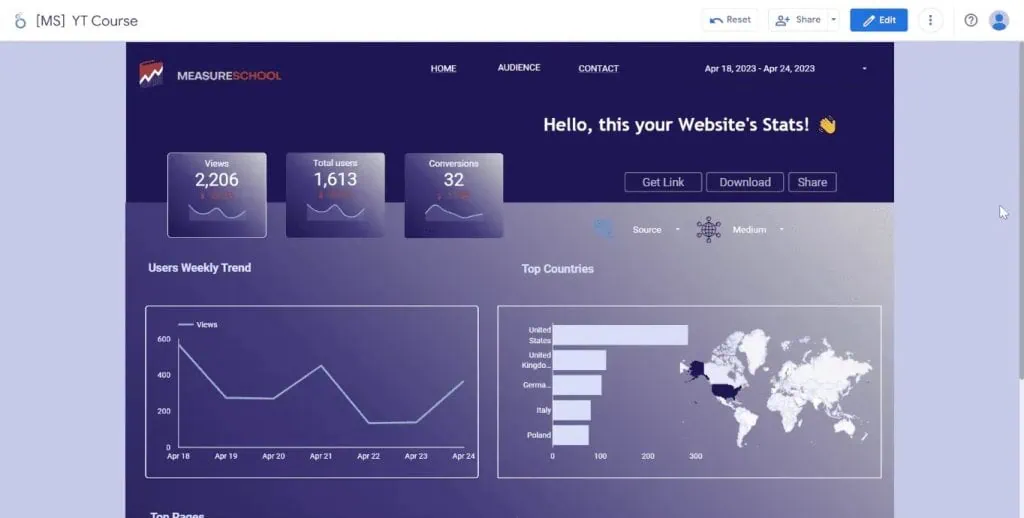
Looker Studio complements GA4 by offering advanced data visualization capabilities across multiple sources, including GA4.
Unlike GA4’s default interface, Looker Studio allows you to create attractive dashboards that simplify data interpretation for decision-makers.
This is one example:
For beginners, our Looker Studio Basics tutorial is an excellent starting point.
Summary
In this guide, we explored how to build Google Analytics 4 dashboards, from customizing reports to leveraging advanced features like Explorations.
While GA4’s built-in tools are powerful, tools like Looker Studio can offer additional flexibility for those who prefer highly customizable, cross-platform dashboards.
Ultimately, the best tool for you depends on your goals, the tools you use most often, and your unique circumstances.
For a practical next step, explore our guide on the Top 10 GA4 Exploration Reports with Use Cases to maximize your analytics potential.
Which dashboards or customization techniques do you find most helpful in GA4? Share your experiences in the comments!


