Last Modified on January 30, 2025
Nothing is critical if you notice that after reading your blog post, the user left the site, right? But what if your site is an online store and the user left your website at the checkout stage?
Sounds like you’re losing money, doesn’t it? So let’s explore in this guide how important it is to analyze GA4 Exit Pages, and how it will help you to optimize your user experience and even increase conversions.
We will also perceive the differences between exit rate and bounce rate, and define each one.
At the end of the article, we will analyze a couple of cases with the analysis of the exit pages in the sales funnel and give recommendations for improving your site’s performance. Here is what we’ll cover:
- What are GA4 Exit Pages?
- Exit Rate vs Bounce Rate: What’s the Difference?
- How do I find exit pages in GA4?
- Why is Tracking Exit Pages Important for eCommerce Sites?
- 5 Tips for Building Effective Sales Funnels
Let’s dive in!
What are GA4 Exit Pages?
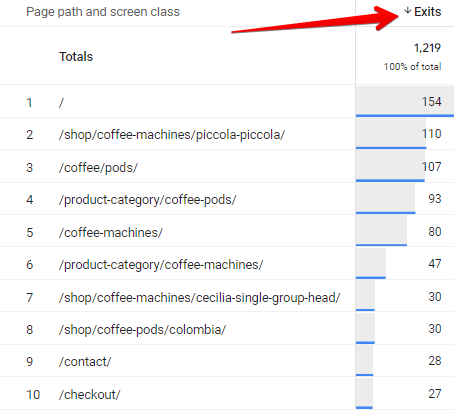
GA4 exit pages show how many times the last event in a session happened on a page or screen. Exit rate is the percentage of sessions that ended on a page or screen. The rate is equal to the number of exits divided by the number of sessions.
To put it simply, the exit page refers to the last page visited during a session. Each time a page is the last page of a session, that metric Exits increases by 1.
Exit Rate vs Bounce Rate: What’s the Difference?
Exit rates and bounce rates are two key metrics in GA4 that provide insights into user behavior and engagement.
The exit rate measures the percentage of sessions that ended on a specific page after viewing multiple pages.
On the other hand, the bounce rate represents the percentage of sessions that ended after viewing only one page.
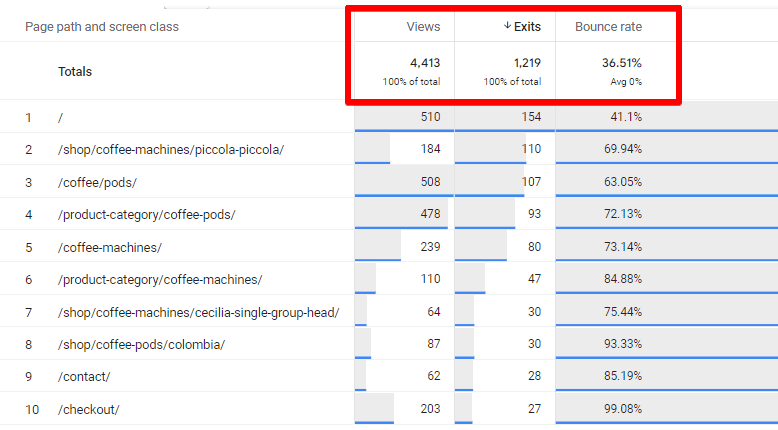
While both metrics indicate the end of a session, the exit rate focuses on users who have interacted with multiple pages, making it particularly useful for analyzing exit pages and potential conversion roadblocks.
Furthermore, it is important to note that while all bounces are considered exits since they represent the last page visited in a user’s session, not all exits are categorized as bounces.
This distinction arises when a visit involves multiple page views or interactions.
The key factor that sets a bounce apart from an exit is whether the last page visited also served as the entrance point. In cases where the user’s interaction involves a single page view without navigating to other pages, it is classified as a bounce.
Due to this, we can say that it’s normal to have a high exit rate on the thank you page. But if we have a high exit or bounce rate inside of the funnel step where we intend to get leads or purchases, usability issues should be investigated.
How Do I Find Exit Pages in GA4?
At the time of this writing, we cannot see page exits inside the standard analytics reports.
Although it is possible that, over time this metric will be included in the standard reports.
So, we can add it here:
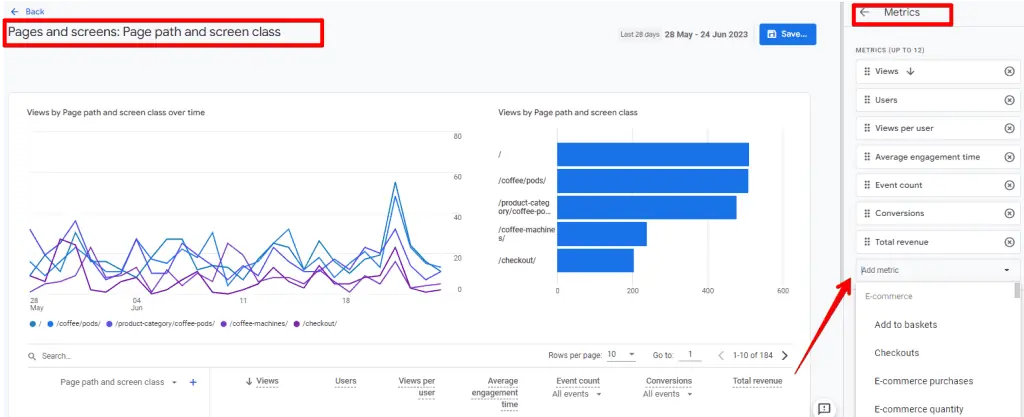
Therefore, today the only way to see the GA4 Exit Pages metrics is to use explorations reports and build a custom report.
Building Exploration Reports with Exits
Explorations in GA4 offer a flexible and customizable way to analyze exit pages. By creating an exploration report, you can add dimensions such as page path or screen name and metrics like exits to gain a comprehensive view of exit page performance.
You can further break down the data by dimensions like device, browser, or traffic source to identify patterns and optimize specific user segments.
To uncover GA4 exit pages, follow these steps:
- Access your Google Analytics 4 account. In the left-hand menu, click on Exploration to create a new exploration report.
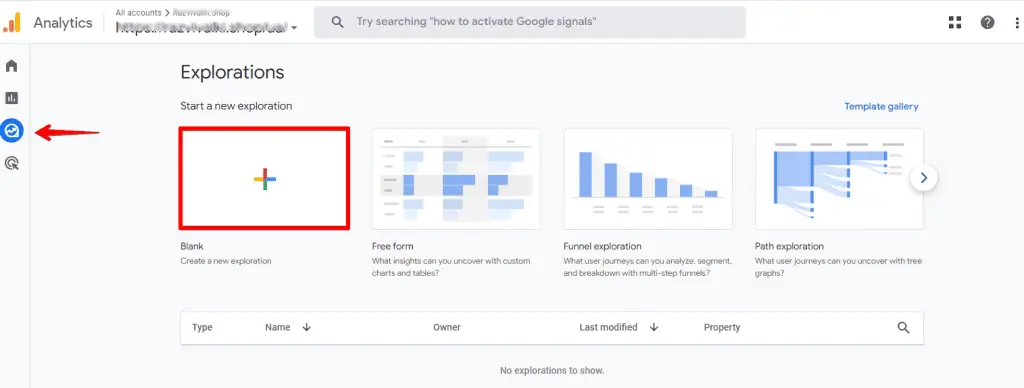
- Under the “Exploration” tab, click on the “Add dimension” button.
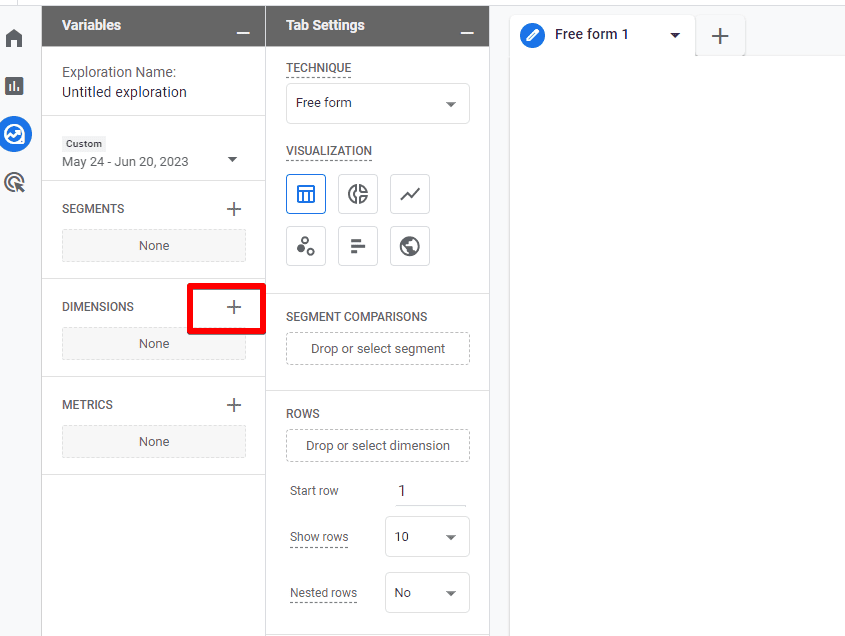
- In the search bar, type “Page Path” or “Screen Name” to add these dimensions to your report.

- Expand the “Exits” metric by clicking the arrow beside it.

- Click on “Exits” to add it to the report.

- Customize your report by adding breakdown dimensions such as traffic source and filtering the data.

Unfortunately, this is the only method to build reports with top GA4 exit pages. Hopefully, in the future, we will be able to import this metric to Looker Studio and build custom reports there.
Why is Tracking Exit Pages Important for eCommerce Sites?
For eCommerce sites, analyzing exit pages is of paramount importance. Understanding where users leave your website, particularly during the checkout process, can help identify obstacles and optimize conversion rates.
By focusing on exit pages, you can address potential pain points, streamline the purchasing journey, and ultimately increase sales and revenue.
So, if you have an eCommerce site, it would be also useful for you to analyze the Funnel Exploration report to track exits within your sales funnel. In this article, we will look at a standard report with a funnel called User purchase journey.
Path Funnel in Standard GA4 Reports: User Purchase Journey Analysis
The User Journey Report shows how many users drop off after each stage of your site sales funnel. Reviewing this report can help determine which funnel steps need to be removed, added, or improved.
In our case, we will be interested in the abandonment rate at each stage of the funnel to understand at what stage users leave the site without completing the sales funnel, and what can be done with it.
So, to find this report we have to:
Go to Reports > Monetization > User purchase journey
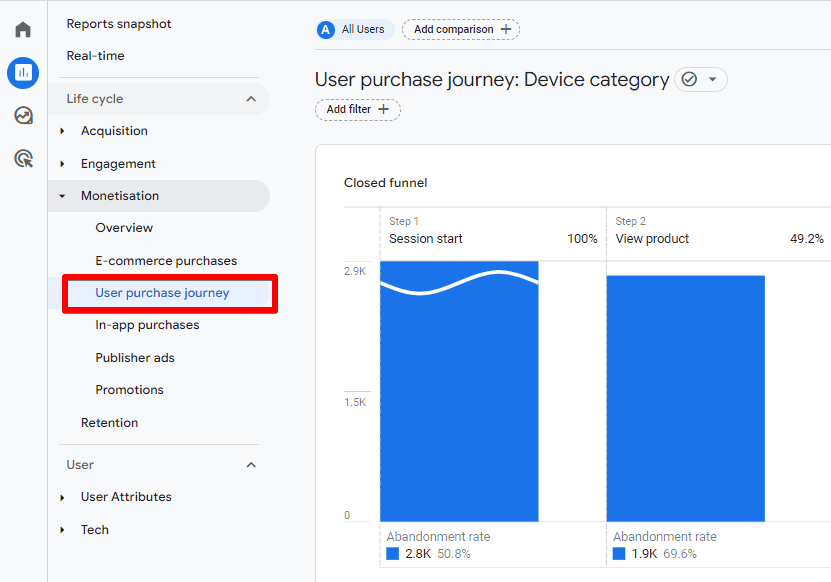
Building reports is only part of analytics work. The more challenging aspect is to read charts, analyze them, build hypotheses, or make decisions based on the data we see.
So, let’s review a brief analysis overview of funnel stages based on real cases of online stores.
Case 1: Online store selling lenses
Here is an example of a sales funnel from an eCommerce within GA4. The funnel has an average conversion rate in a niche.
Among 5.7K visitors, almost half of them left the site immediately – 2.8K (50.8%). 2K of users went to the session with viewing products, while 1.9K did not add any product to the cart and left the site.
At the end of the funnel, we have 413 transactions. So, the funnel conversion is 7%.
This is a good indicator for an online store, but there are still options for increasing and improving this conversion rate.

Solutions to improve:
A high bounce rate after viewing a product card can signal a lack of USP, triggers that encourage buying, errors in the UI, such as the lack of sufficient information about the product, and much more.
To analyze what exactly provokes a visitor to leave the site, A/B testing is often used, based on which you should decide on changes.
One more option to improve conversions at the cart exit stage is to target ads to users who started the checkout stage but did not complete it.
Case 2: A coffee roasting company that sells coffee machines and products for it
Among 54K visitors, a third of them left the site immediately – 17K (33%).
32K of users dropped off the site after viewing products, and only 10% of all users who viewed products started the sales funnel and added the products to the cart.
At the end of the funnel, we see an 84% conversion rate due to the begin_checkut stage, which means a good conversion rate for those who started the sales process.

Solutions to improve:
A large number of people leaving the site without even starting the funnel and viewing products may indicate that the traffic is irrelevant.
In this case, it makes sense to audit advertising campaigns and analyze traffic sources and the audience visiting the site’s main page.
Also, the reason for leaving can be a complex navigational structure of pages, non-obvious site elements that allow you to start a funnel, a lack of CTAs, and sales triggers.
At the same time, we see here the capture of the buyer and the funnel inside the basket have quite high rates and have brought the users to the purchase.
Conclusion
It is necessary not only to count the conversions of each stage for all types of funnels but also to understand why fewer users moved to the next stage of the funnel than at the previous stage.
As a bonus, we have prepared a short list of 5 tips for your funnels to be effective.
5 Tips for Building Effective Sales Funnels:
- Keep sales funnels as short as possible and the user journey as simple as possible. Do not force the user to fill in the fields that can be skipped.
- Rely not on your vision of the sales funnel in the online store but on the real behavior of users, and optimize the funnels for it.
- Make decisions about changes in design or functionality based on analytics data.
- Implement eCommerce in Google Analytics for deeper analysis.
- Take into account the strangeness of the business and target audiences, and perform split testing before making any changes.
🚨 Note: Check out our handy guide and learn how to create an effective custom funnel in GA4 in no time.
Summary
In this post, we explored the significance of analyzing GA4 exit pages for eCommerce sites and harnessing the power of path funnel analysis to enhance user experience and boost conversions.
We learned about the distinctions between exit and bounce rates, explored how to find GA4 exit pages, and gained insights from real-life case studies. Check out our guide to learn more about GA4 bounce rates.
What challenges have you faced with exit pages in your eCommerce journey, and how did you overcome them to enhance your site’s performance? Share your experiences in the comments below!


can we view this in looker studio?