Last Modified on December 25, 2024
Frustration! That’s what many of us feel about the inconsistencies between Google Analytics 4 (GA4) and Looker Studio data.
For those accustomed to the accuracy of Universal Analytics (UA) with Looker Studio, these discrepancies can raise a challenging question that puts your expertise to the test: Why doesn’t this match GA4 data?
While exact matches across tools aren’t always achievable, including between GA4 and Looker Studio, understanding why can help set the right expectations for clients and colleagues.
In this post, we’ll dive into the data discrepancies between GA4 and Looker Studio and share solutions to help you handle this common question confidently.
We’ll cover:
- Verify Data Before Building Dashboards
- Data Discrepancies Between GA4 and Looker Studio: Metrics
- GA4 Data Source in Looker Studio: Standard Reports vs. Explorations
- Looker Studio Sampling: Why It Happens and What to Do
- Understanding Estimation and Calculation Methods in GA4
- Data Blending Challenges: Avoiding Misleading Metrics
- GA4 Exploration Data Downloads
- GA4 Exploration Data and Aggregation in Looker Studio
- GA4 Exploration Data Changes Over Time
Let’s dive in!
Verify Data Before Building Dashboards
Before jumping into Looker Studio to create dashboards, it’s good to verify the key numbers from the source (e.g., GA4) beforehand. Why? It saves you time building an entire dashboard, only to discover discrepancies that require investigation later.
Typically, it’s helpful to monitor user metrics, as we’ll explore in the next section.
Data Discrepancies Between GA4 and Looker Studio: Metrics
The main metrics prone to variances are user-related, such as:
- Active Users (1-day, 7-day, 28-day active users)
- User Stickiness Metrics: DAU/MAU, DAU/WAU, WAU/MAU
Other metrics may include:
- Session- and View-Related Metrics
Additionally, Total and Active Users often match closely, but minor differences can arise with high-volume data.
GA4 Data Source in Looker Studio: Standard Reports vs Explorations
A common question during Looker Studio training is whether the data in Looker Studio pulls from GA4’s standard or Exploration reports. If you’re using the GA4 connector, the answer is standard reports, which include custom fields.
If you primarily use Explorations, be aware that the data might vary, as there are differences in calculations and data processing times between Explorations and standard reports.
When presenting data from Looker Studio based on GA4 standard reports, mention this to your team or clients.
It’s helpful for them to know that Explorations can yield different numbers so they can understand the origin of any discrepancies and why you’ve chosen one data source over another.
Looker Studio Sampling: Why It Happens and What to Do
GA4 applies sampling to large datasets to improve performance, and Looker Studio follows suit. However, unlike GA4, which displays warnings for sampled data, Looker Studio doesn’t provide any notification that sampling is in effect.
So, is there a risk of double sampling? No. The sampling rate is established by GA4 when you connect it to Looker Studio, ensuring that data is only sampled once.
How to address sampling issues:
- Check Date Ranges: If you notice significant differences in Looker Studio data, verify whether today’s date is included in your reporting range. Partial data may not yet be fully processed, leading to discrepancies.
- Compare Consistent Date Ranges: Ensure that you’re comparing the same date ranges in both GA4 and Looker Studio to avoid inconsistencies caused by data still being processed.
Understanding Estimation and Calculation Methods in GA4
GA4 utilizes algorithms like HyperLogLog++ (HLL++) to estimate metrics, especially on high-traffic properties. Metrics such as Active Users and Sessions you see in the GA4 UI or obtain via the API are approximations rather than exact counts.
This estimation reduces memory consumption and enhances performance. Since Looker Studio connects to GA4’s Data API, these metrics might show slight variances from exact figures due to GA4’s estimation methods.
Avoiding Misleading Metrics in Data Blending
Data blending in Looker Studio can lead to inflated user metrics. When combining data from different sources, Looker Studio’s aggregation methods may not always produce accurate results.
Solution for Handling Data Blending Issues
If, for instance, you’re adding annotations from Google Sheets to add context to fluctuations in Looker Studio charts, try adding Google Sheets as a separate data source rather than blending it directly.
Then, link the annotation chart to a Date range control in Looker Studio, allowing synchronized date filtering across charts. This approach ensures that contextual data doesn’t interfere with the main metrics in your dashboard.
💡Pro tip: It’s important to remember that Looker Studio is not inherently a computation tool. Ideally, it’s better to perform your blends and joins in an external platform like Google Sheets and then use that data in Looker Studio. Unless you’re dealing with large datasets (e.g., more than 50,000 rows), this method tends to improve chart performance, as it loads faster.
GA4 Exploration Data Downloads
If you’ve ever tried comparing GA4 Exploration data with a Looker Studio report that uses downloaded data as its source, you might have noticed discrepancies. This issue is especially noticeable with metrics like Total Users.
What’s causing this? The difference is from how Looker Studio processes data versus what GA4 shows in its UI.
For clarity, here’s how you can download Explorations data. Once you are in Explorations:
- At the top right corner, click the download arrow.
- Select a file option.
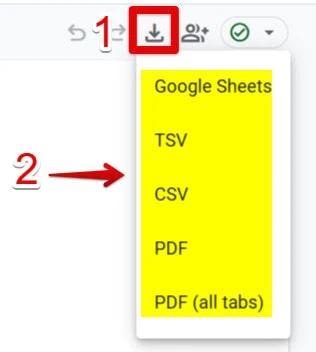
When you download GA4 Explorations data and use it in Looker Studio, the numbers in Looker Studio will match the totals you’d get if you summed the downloaded data yourself (e.g., using the SUM() formula in Google Sheets).
However, these totals often won’t align with the numbers shown directly in GA4 Explorations.
Let’s break this down further with an example.
GA4 Exploration Data and Aggregation in Looker Studio
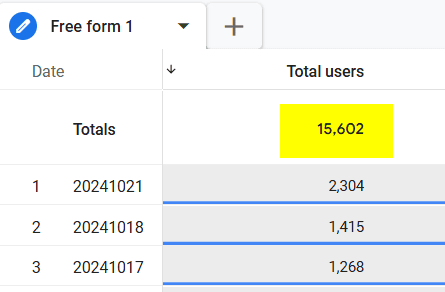
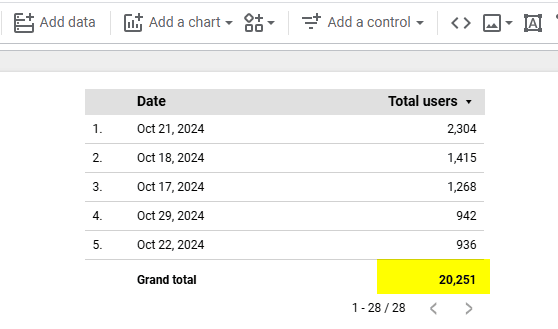
Let’s download an Exploration report to visualize in Looker Studio. You might expect the numbers in Looker Studio to match what you see in GA4 Explorations, but instead, they match the total you calculated manually from the downloaded data.
For instance:
- In GA4 Explorations: You see a total number of users for a specific date range, such as 15,602.
- In Looker Studio: The report displays 20,251 users — a perplexing difference.
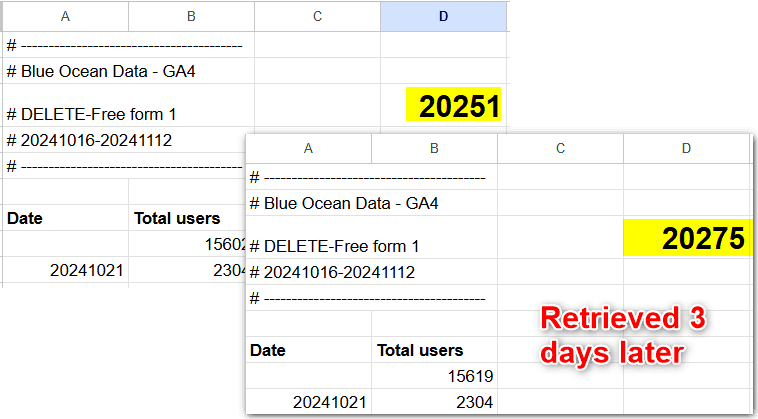
- When Calculating Manually: When using the SUM() function on the raw downloaded data from GA4, the total comes out to 20,251, matching Looker Studio’s number.
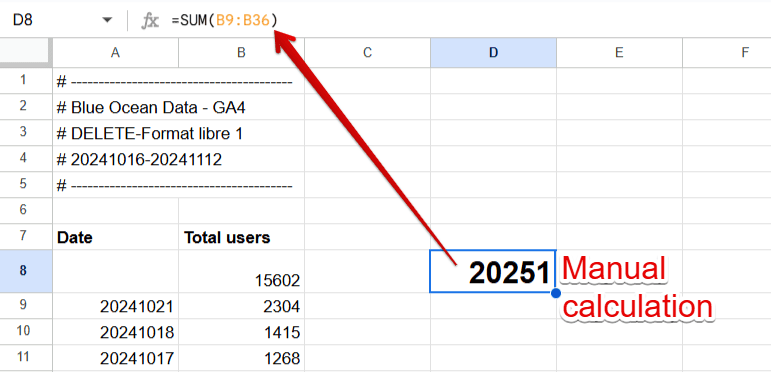
That happens because Looker Studio processes the raw data differently, relying on the downloaded data’s inherent structure. What you see in Looker Studio reflects the summation of your downloaded data.
GA4 Exploration Data Changes Over Time
Another challenge with GA4 Explorations is that the data may not remain static.
It’s possible to revisit an Exploration days later and find different numbers for the same date range. It can be confusing, especially if you’re confident that the report hasn’t been modified.
For example:
- On November 12, we created an Exploration for October 16 to November 12, showing 15,602 users.
- On November 15, you checked the same report, but now it shows 15,619 users for the same period.
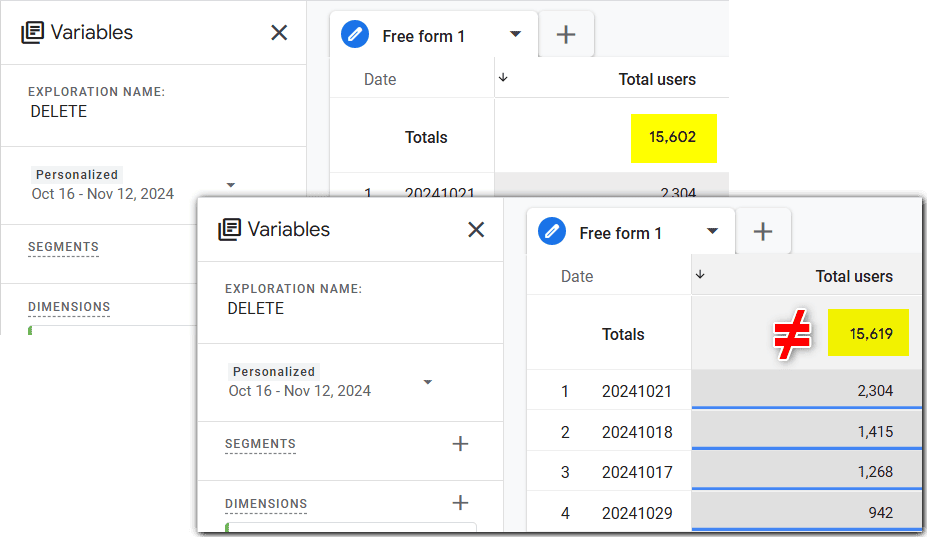
You may argue that the differences are too small to be a concern, and that’s a fair point. However, these discrepancies may become more pronounced in Looker Studio.
It happens because aggregations, like totals in Google Sheets, tend to amplify the differences, as we’ve seen earlier.
Here’s the difference calculated manually in Google Sheets:
Several factors contribute to this happening:
- Delayed event processing: Some events may take longer to process and show in your reports after the initial generation.
- Modeled Key Events: Conversion data can be updated over 12 days if new events or conversions are tagged as key metrics after the initial report generation.
- Glitches and Updates: While GA4 aims for accuracy, there may still be slight adjustments in data processing that cause differences.
Summary
Building dashboards can be challenging when there are data discrepancies between GA4 and Looker Studio.
By understanding sampling, estimation methods, data blending, data processing, and aggregation nuances, you can prevent misunderstandings and address client concerns with more confidence.
Remember to verify your data against consistent date ranges, be mindful of sampling, and avoid unnecessary data blending.
Always double-check your methodology when comparing numbers across platforms, and remember to account for GA4’s dynamic reporting behavior.
Despite the data not always aligning perfectly, Looker Studio remains one of the best tools for visualizing and analyzing GA4 data. That’s why we’ve described it as such, so check out Google Analytics 4 and Looker Studio: Perfect Analytics Duo.
How have discrepancies between GA4 and Looker Studio affected your reports? Share your experiences in the comments below!


