
Last Modified on February 27, 2025
Do you want quick insights into your data but don’t know where to start?
Spreadsheet software like Excel or Google Sheets are widely used tools for analyzing data. Google Sheets has some built-in quick analysis features that can help you get an overview of your data and some useful insights.
While you can still analyze your data with Google Analytics, the user interface isn’t great for exploring data. On the other hand, Google Sheets provides ease of transforming and analyzing data with its visualization tools and built-in functionalities.
Google Sheets can also be useful to archive data long-term and collaborate with other tools such as Google Data Studio.
In this guide on data analysis with Google Sheets, we’re going to take a look at some of these built-in functionalities.
So let’s dive in.
An overview of what we’ll cover in this guide:
- Exporting Data from Google Analytics to Google Sheets
- Preparation: Cleaning and Formatting Data
- Quick Way to do Data Analysis with Google Sheets
Exporting Data from Google Analytics to Google Sheets
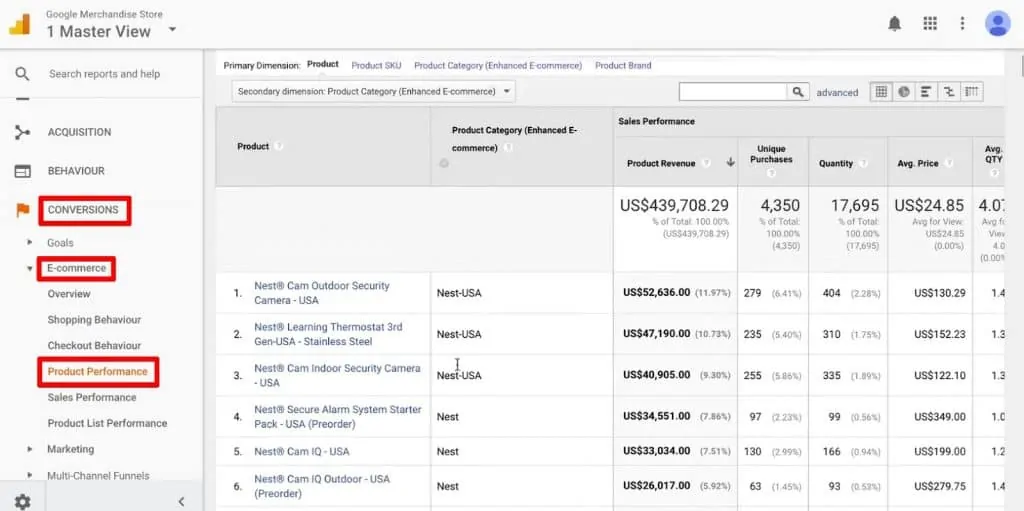
Alright, before we start in Google Sheets, we actually need to have some data available. So I’ve logged into the Google Analytics demo account. Note that this is demonstrated using Universal Analytics, but you can also pull other data from a Google Analytics 4 property.
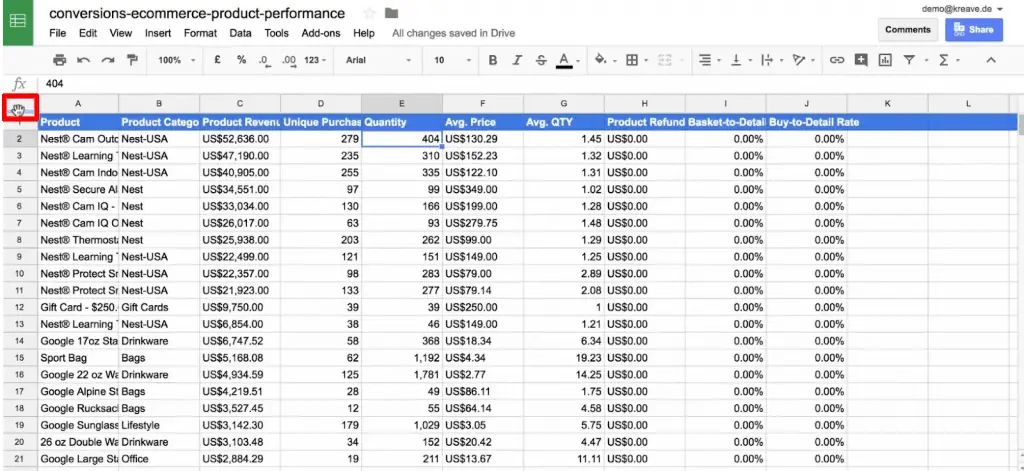
Here, we can go to Conversions → E-commerce → Product Performance report and see that there is some useful data here that we can analyze.
Now, for the next step you should copy this data into Google Sheets.
We could do this manually, but that will be quite cumbersome. However, Google has an export function that we can use.
Click on Export → Google Sheets.
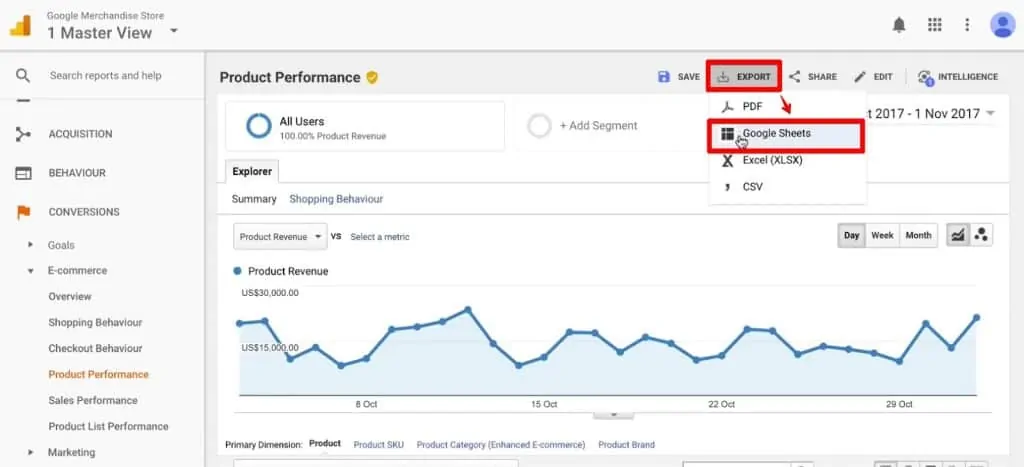
And then Import the data.

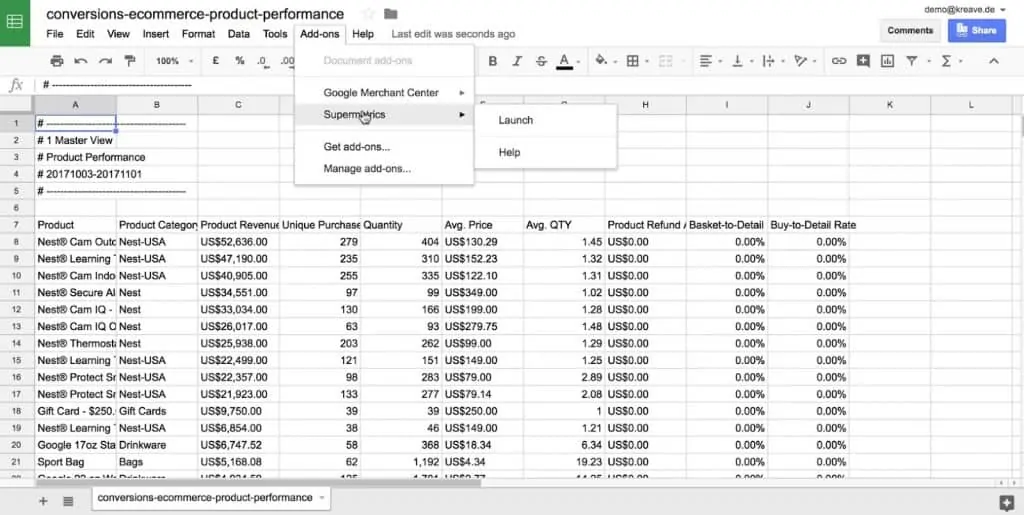
Now if you would like to automate the whole process, my top recommendation is a tool called Supermetrics. You can install it as an add-on to your account and then pull the data directly from the API. This tool is then accessible under Add-ons in Google Sheets.
You can also export data from Google Analytics to Google Sheets using the Google Analytics add-on.
Now that we have this sheet available with all our data, let’s look at how we can analyze this data.
Preparation: Cleaning and Formatting Data
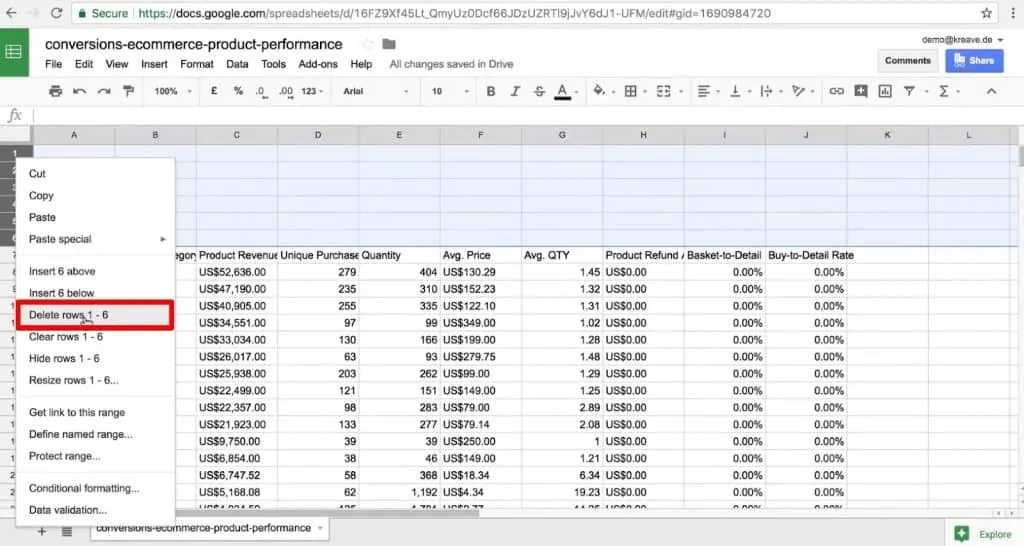
First up, let’s clean this data. So, we will delete any cells that don’t belong to our data set.
Also, we will get rid of any empty rows on the top of the sheet so that we have our first row as a header row. For this, select the empty rows on the top, right-click and select Delete rows 1 – 6.
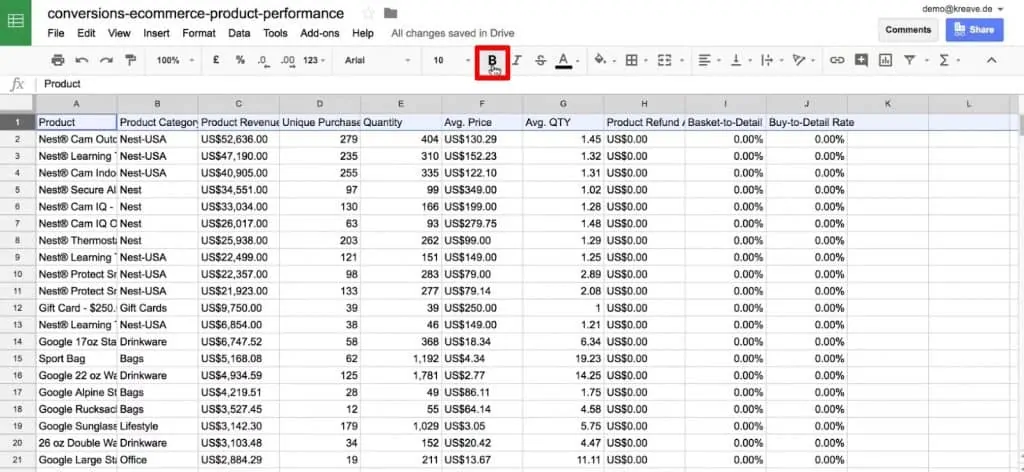
It’s also important to make this data visually appealing so that we can know at a quick glance what we’re looking at.
Let’s make our header row bold. For this, select the header row and click on the Bold option.
We could also change the background color, for example to blue, or change the font color, and so on.
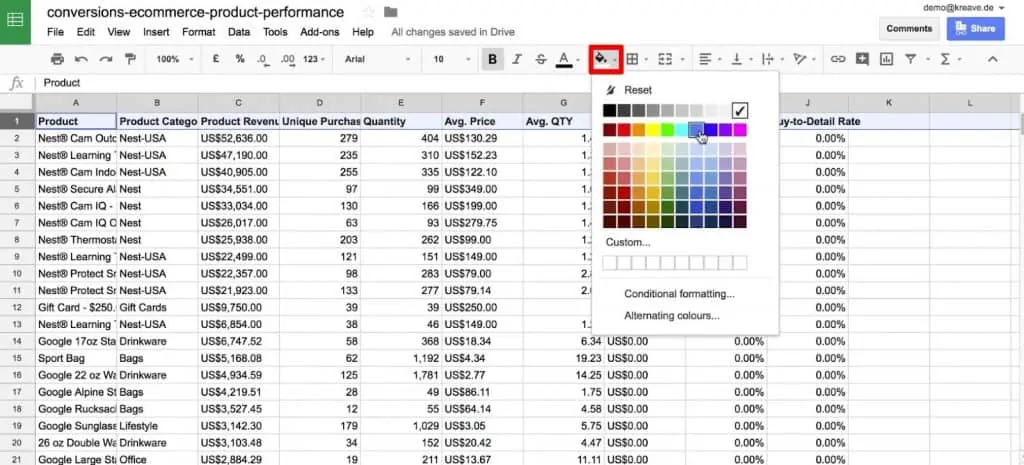
There are also other options to make the data visually appealing and more accessible when you look at it at a quick glance.
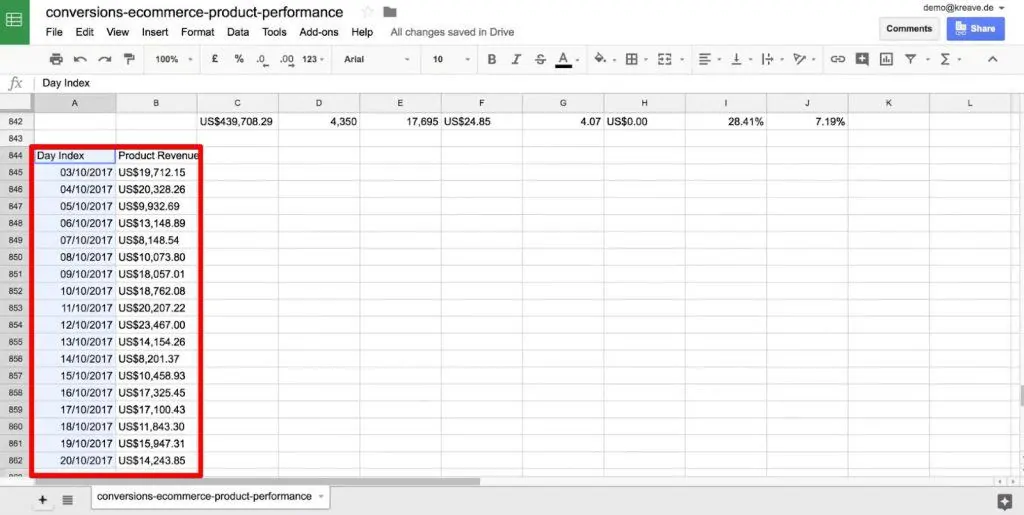
Now, if you scroll down to the end of the sheet, you can see some additional data that is not required for now. So you can get rid of this.
Select the data and then press the delete button.
Also, the last row in the table adds up all the data above. We will do this summation ourselves in the sheet. So, we’ll get rid of this for now.
Here as well, you can select the data and then press the delete button.

You should always make sure that your data is in the correct format and is convenient to read in order to go over to the analysis step.
Now, we are left with the raw data that we want to analyze. Thus, this is our first step in data analysis and now we are ready to analyze a clean data set.
🚨 Note: Google Sheets now includes powerful functions like QUERY, which allows users to perform complex data manipulations using SQL-like syntax. This function enables filtering, aggregating, and sorting data dynamically, providing more sophisticated analysis options.
Quick Way to do Data Analysis with Google Sheets
Next, let’s do a quick analysis in Google Sheets with the built-in tools that we have. We can utilize them right away when we spot something in the data that we want to analyze.
Sorting
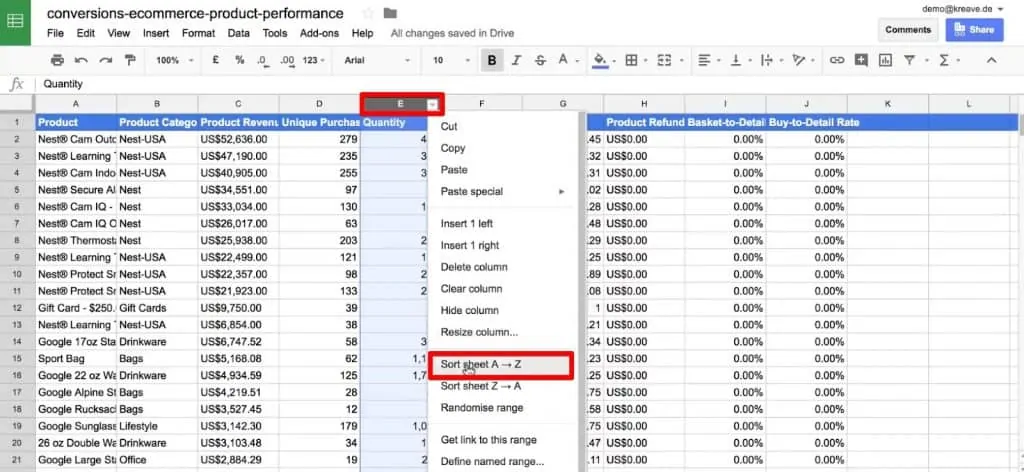
Firstly, how can you sort this table? Currently, it’s already sorted by the Product Revenue, but we can sort by any other column as well. All we would need to do is hover over the column that we want to sort it by, click on the drop-down, and select Sort sheet A → Z.
Once we sort this, we get the lowest quantities on the top. However, we have also sorted our first header row here, which has mixed our labels up with our data. Let’s undo this by pressing Ctrl+Z.
Now in order to prevent this, we need to freeze the header row. You can do this by simply dragging down the top-left cell of your spreadsheet. So now the first row is frozen. And when we scroll down, it actually stays in place.
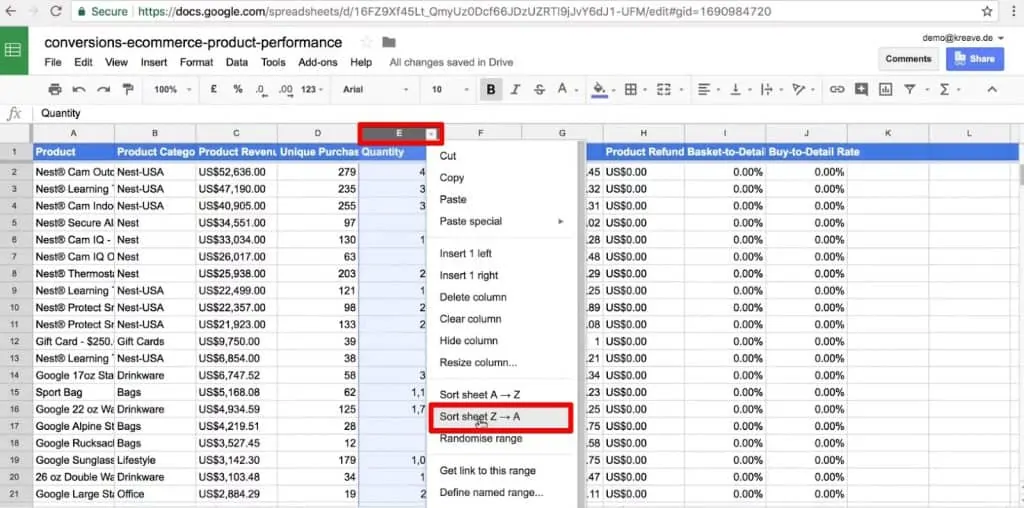
Now, hover over column E and click on the drop-down menu. From this, select Sort sheet Z → A. This will show us our highest quantities first. And we can see which product has been sold most often in terms of the quantity that was put into the basket.
Thus, you can get quick insights by sorting these columns or by finding particular outliers.
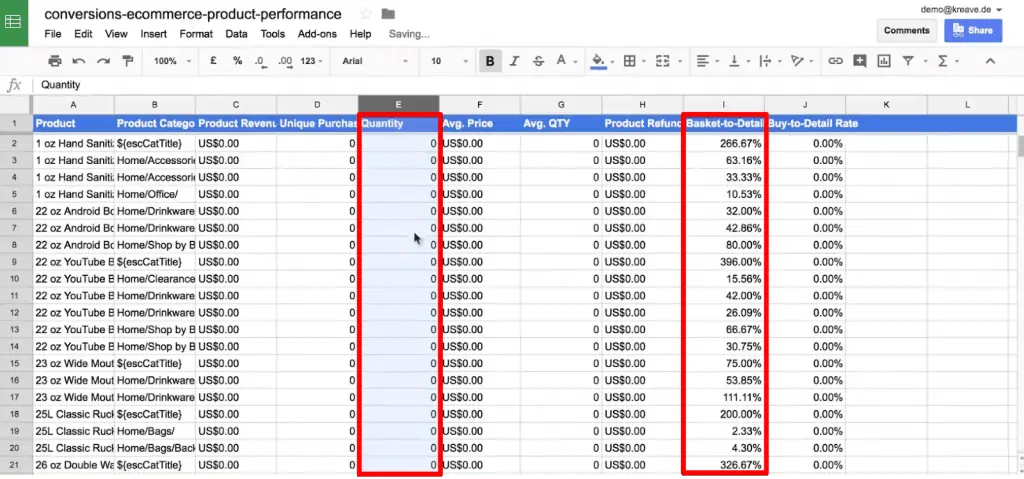
So if you go back and Sort sheet A → Z, you can see the products that were never sold. But some of these products have been put into the basket quite often. This can be very helpful data that should be looked into.
Quick Sum Functions
If we find anything that strikes our analytic fancy, we can take a quick look with the Quick Sum functions.
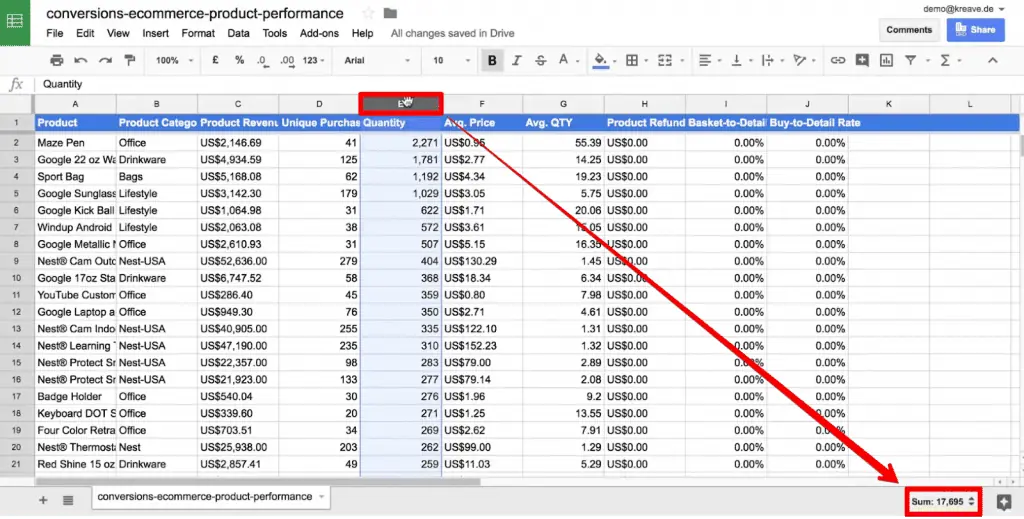
We can do this by simply marking the cells that we want to analyze. So for example, let’s go with the first 10 products. We will mark the Quantity column. And then, in the right bottom corner, we can see a function that has quickly summed up all the values that we had in our range of the cells.

So our top 10 products that were sold, make up about 9000 units. Let’s now mark the whole quantity column just by clicking on column E. We can see that 17,600 products were sold overall.
Thus, we get a quick ratio of how much the best 10 products or the most sold products are in comparison to the overall pie. In this case, it would be over half of the product.
So again, this is quick analysis just through the built-in features of Google Sheets.
Once we click on the box in the bottom-right corner, we can actually see other data such as the Avg, Min, Max, Count and Count Numbers, which are actually the numbers minus the header row.

Thus, without doing any kind of fancy functional analysis, we have a quick overview of our data.
Filtering
Now, you might also want to filter out data. For example, there are a lot of values here that didn’t sell anything. And we want to see the products that actually sold something.
How would we achieve that? Well, there is a built-in button, which is the Filter button. We can just click on it with our header row in focus.
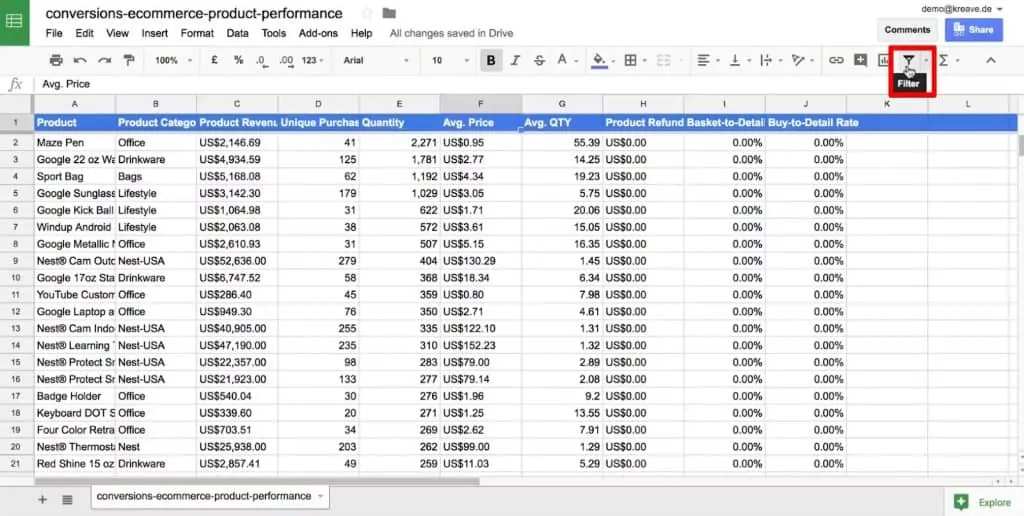
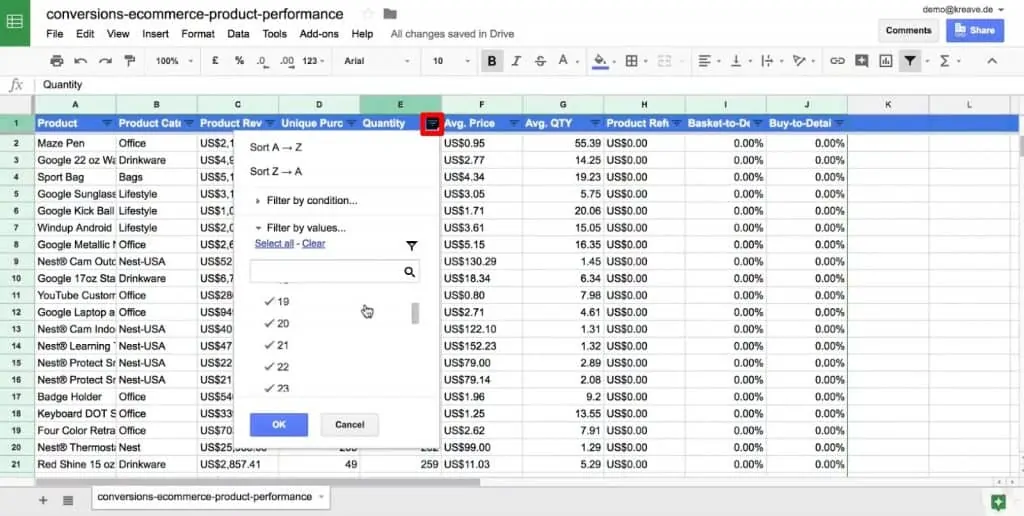
This will summarize our data in the table and we get these quick filter buttons in the header row. We can click on these quick filter buttons. It will show all the values that are in that particular column. You can search for a specific range or value by clicking on Filter by values…
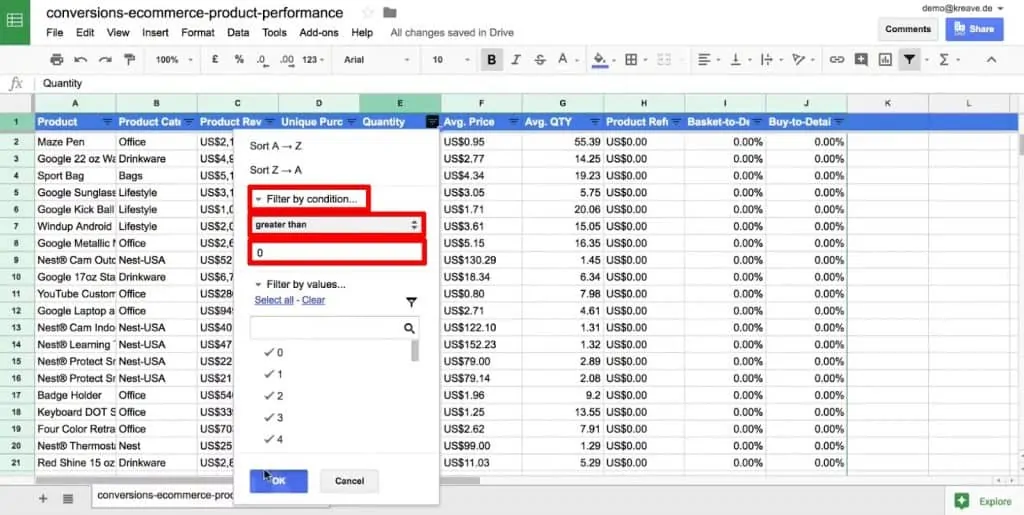
You can also use the Filter by condition… function. For example, if we want to view all only our sales greater than zero, we can filter out all the products that didn’t sell at all. Here, you can add a condition greater than 0 for column E i.e. Quantity.
Thus, this is a quick way to filter our data. We also have some other mechanisms.
Let us take another example. For this, first we get rid of the current filter. Select the condition as None under Filter by condition…

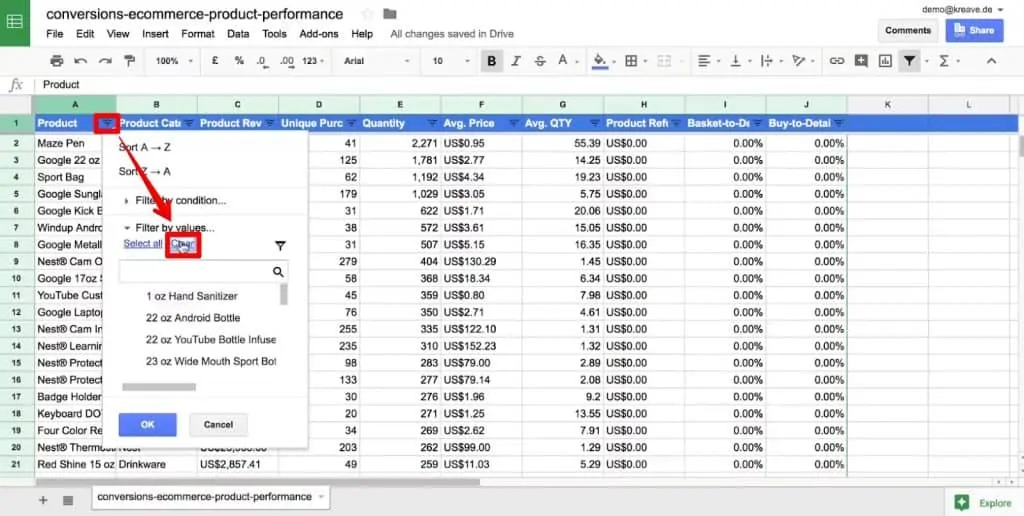
Now, let’s go to the Product column i.e. Column A and say, we only want to have products from the brand Nest.
Firstly, let’s clear all the filters from the column. For this, click on the filter button beside the column and click on Clear.
Now, type Nest in the search box and click on Select all → OK.
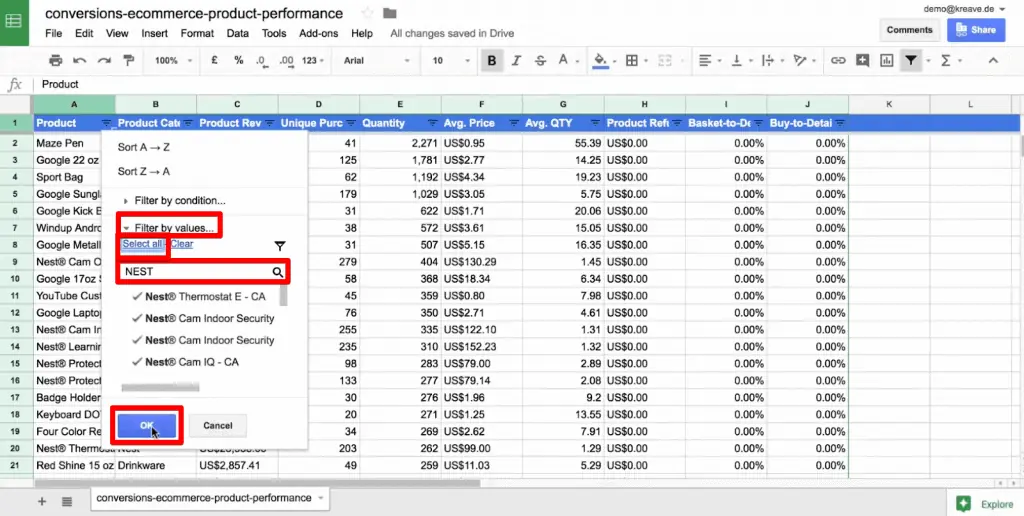
Thus, we only have Nest products in the table and we can compare them easily.
This was a quick way to use the built-in functionality of filter functions within Google Sheets. Now, click on Select all so that we have all the values again in Column A.
Artificial Intelligence
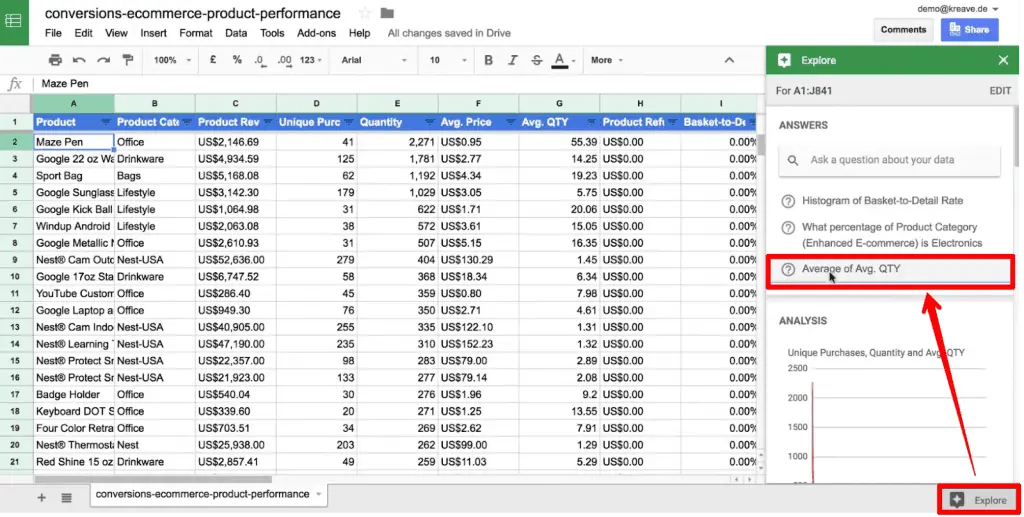
Moving forward, the last built-in feature that I want to show you is something newer. Google has been introducing artificial intelligence to just about all of its products. You can access the artificial intelligence functions in Google Sheets by clicking on the Explore button in the bottom right corner.
When you click on Explore, Google will give you some suggestions of questions guide our data analysis. For example, we might want to ask for the average of order quantity. So, let’s click on Average of Avg. QTY.
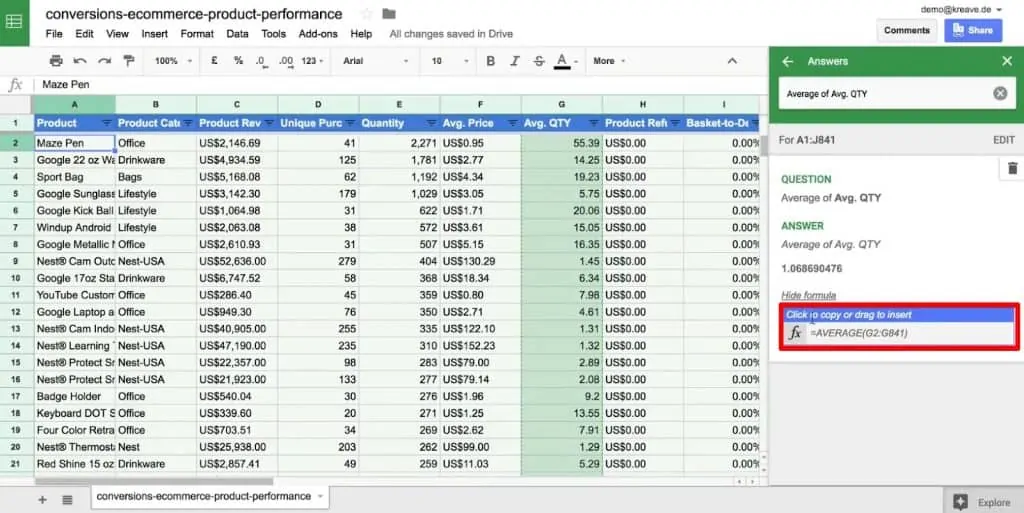
The value of the average order quantity would be 1.068. Thus, we’ve analyzed column E.
Here, we don’t even have to fill in any kind of formula. Google Sheets does it automatically.
We can see the formula by clicking on See formula. And that is the formula that we would put into the formula bar.
This gives us a quick analysis on the fly.
If you’re interested in some of these questions you can scroll down.
We have some graphs that were analyzed, like the Basket-to-Detail Rate.

Also, we have the graph for Unique purchases to know how it is distributed.

We could even ask a question under Ask a question about your data.
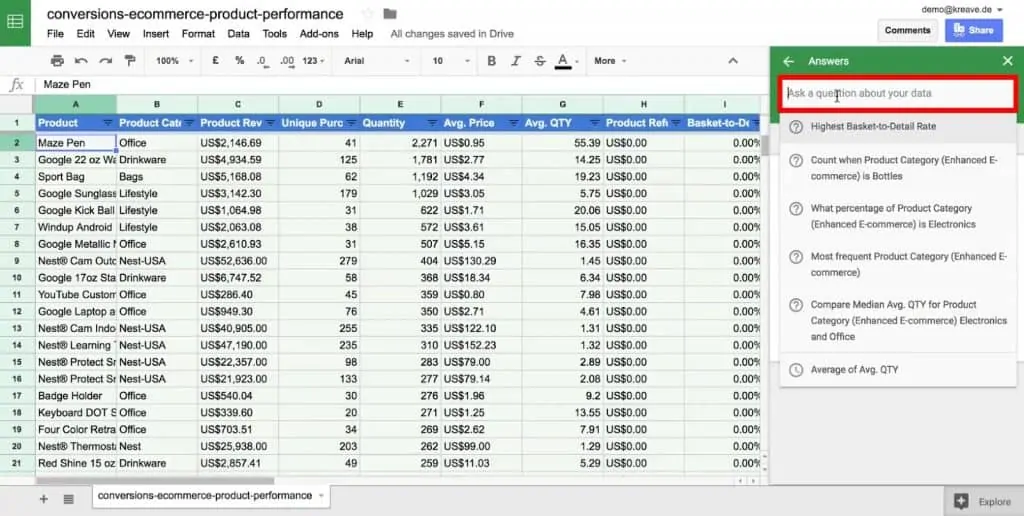
For example, we can ask how many units were sold of a particular product. The count here for this Maze Pen is 4. We can also see the formula by clicking on See formula.
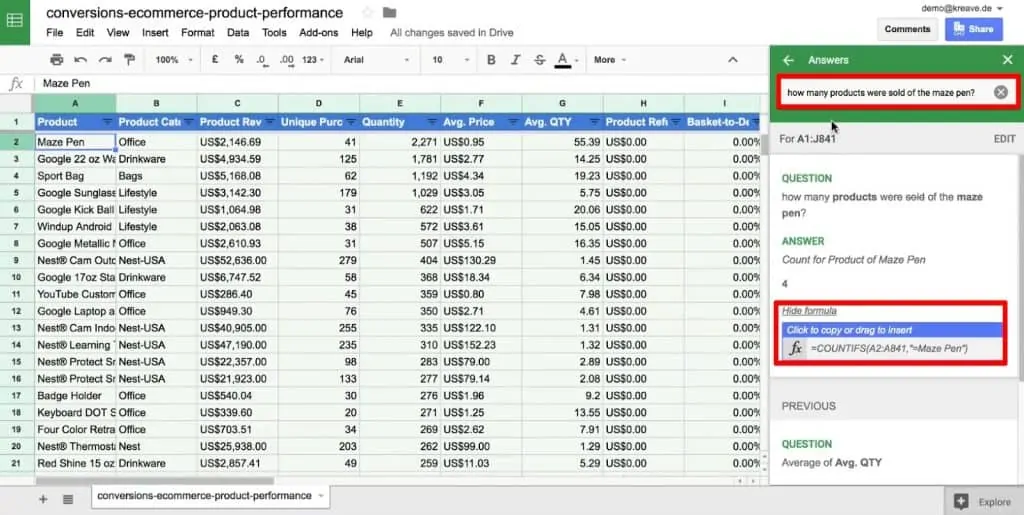
But, this is not quite correct. If you look at the formula, you can see that Google Sheets is counting how many times the name of the product “Maze Pen” appeared in column A. Ideally, the AI engine should be able to pick up that we wanted the quantity of this product.
Let’s rephrase our question. And then we can get the correct answer back.
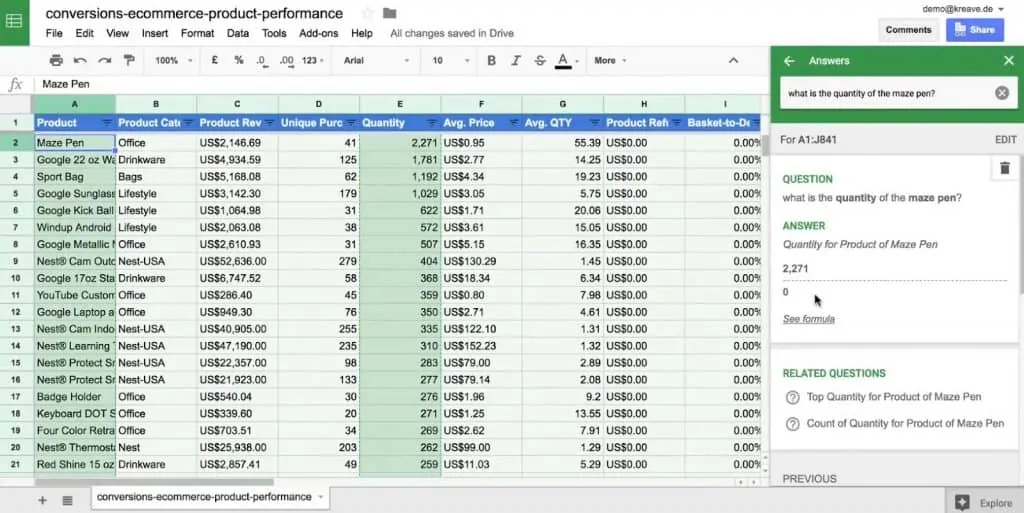
This is a bit counterintuitive, but this is a machine learning algorithm that will hopefully understand all our questions in the near future. The more we use it, the better it will get.
This is again a quick way to do analysis in Google Sheets.
FAQ
How can I clean and format data in Google Sheets for analysis?
To clean and format data in Google Sheets, you can follow these steps:
1. Delete any cells that don’t belong to the data set.
2. Remove empty rows on the top of the sheet to set the first row as the header row.
3. Make the header row bold and visually appealing by changing the font color or background color.
4. Delete any additional data or summation rows that are not required for analysis.
How can I use artificial intelligence (AI) features in Google Sheets for data analysis?
Google Sheets incorporates AI features that provide suggestions and insights based on your data. By clicking on the Explore button, you can ask questions about your data and receive automated analysis. The AI can generate formulas, create graphs, and provide answers to your queries.
Can I customize the questions or queries for AI analysis in Google Sheets?
Yes, you can customize the questions or queries when using the AI features in Google Sheets. By asking specific questions about your data, you can receive tailored answers and insights. The AI algorithm is continually learning, and the more it is used, the better it becomes at understanding user queries.
Summary
Alright, so there you have it. This is how you can use the built-in functionalities of Google Sheets such as sorting, filtering and artificial intelligence for quick and easy data analysis.
But, the functionalities of Google Sheets doesn’t end here. You can use it to create pivot tables or build entire Google Analytics Dashboards.
Do you use Google Sheets to analyze your marketing data? Or do you prefer doing it on Google Analytics itself? Do you know any other quick analysis functionalities of Google Sheets? Feel free to comment below!


")
great read!
wha will happen if my tag fail to upload on my website