
Last Modified on January 7, 2025
Whether you’re a digital marketer, analyst, or business owner, exporting Google Analytics 4 data to Google Sheets can help you gain valuable insights and make data-driven decisions.
As everyone is resetting their tracking setup with GA4’s introduction, many new people are entering the industry and trying to learn about GA4, one of the most popular tools for measuring web and app performance.
But accessing and analyzing this data can be challenging, especially for people who are just starting and/or prefer the familiar spreadsheet environment.
Thankfully, Google provides several options for exporting, visualizing, and analyzing GA4 data, and one of the most popular methods is exporting to Google Sheets.
In this post, we will walk you through the methods to export Google Analytics 4 data to Google Sheets and share some tips for making the most of this feature.
We’ve also created a summary of the steps of exporting in case you want the answer right away.
Here’s a quick snapshot of what you’ll learn along the way:
- Why Export Data to Google Sheets?
- Methods to Export Google Analytics 4 Data
- What’s the Best Method to Export GA4 Data to Google Sheets?
Let’s dive in!
Why Export Data to Google Sheets?
Once you’re all set up with your GA4 account, you might want to analyze the data in a familiar environment like Google Sheets. But why? Here are a few reasons:
- Google Sheets can help you to visualize and analyze the data in a way that you might not be able to do in GA4. For instance, you can use different formulas to manipulate the data to see any trends, patterns, etc., and visualize it with graphs, pivot tables, or dashboards.
- You can combine data from other sources like CRMs, POS, and advertising to connect the dots and do an even more robust analysis, so you will not be limited to GA4 data only.
- Sheets give you control of sharing the data that you want to share whether it’s your colleagues, clients, or any other external stakeholder. This means you can also easily collaborate with others in real-time, as Sheets is a live document.
- You can also automate some of the reports with Sheets that could be used either internally or shared with clients to save time.
- Google Sheets can also be used as a quick and easy solution to store important data if you feel that you’re not ready for BigQuery yet.
There could be many other reasons depending on your business or situation. But one thing is for sure, Sheets give you a lot more flexibility.
Methods to Export Google Analytics 4 Data
There are two popular ways to export Google Analytics 4 data to Sheets that include manual and automated aspects:
- Using GA4 Interface to export data
- Sheets add-ons for GA4 (currently, there’s no GA4 official sheet add-on as we have for UA)
Which method you should use depends on what’s your end goal, how frequently you want to export the data, who is going to use it, and so on.
Knowing the answers to these questions is good practice when it comes to extracting data for analysis.
Let’s take a detailed look at these methods.
#1 Using GA4 Interface to Export Data
The quickest way to move your data to Sheets is from GA4’s interface because you can export any report in CSV format and import it to Sheets. The five steps to do so are:
- Open any built-in report or exploration that you want to export. For this example, we’ll look at the Acquisition report.
- Click on the share icon in the top right corner. This will open the Share this report sidebar.
- Click on the Download file option. You will now have the option to download it as a PDF or CSV. As discussed above, we will choose the CSV option.

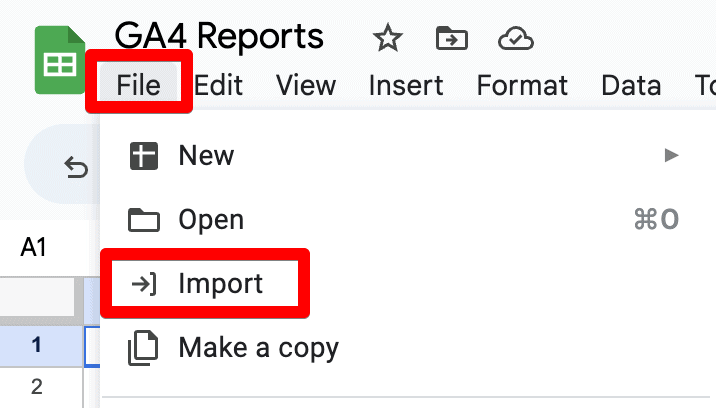
- Once the file is downloaded, you can simply copy and paste the data from the CSV file or import it into Google Sheets. To import go to File → Import and Upload the file.
- You will next see a few options and settings for the import where you can choose the Import location like create a new spreadsheet, insert new sheet(s), and Separator type. Next, click on the Import data button.

You can now see the data in your Sheets though it might not seem very clean or organized. That’s where you come in and can do the work to make it easy to understand.

But this is about the built-in reports in GA4. What about the Explorations? It looks like there’s more flexibility there in terms of exporting the data because you can also take it directly to Google Sheets (among other options).

Once you click on the Google Sheets option, a new tab opens where you can click on Import the data button to complete the process.

This eliminates the steps to download the data and then import it into Google Sheets, as it will just open in the new tab.
🚨Note: You will need Editor/Admin access to be able to download the files for standard reports and explorations.
For now, there doesn’t seem to be an option that allows scheduling the reports to be emailed or updated in the Sheets from the GA4 interface.
#2 Sheets Add-ons for GA4
In this method, add-ons connect with the APIs to help us pull the data into Sheets. They are found under Extensions → Add-ons → Get add-ons / Manage add-ons.

For UA, we have Google’s own Google Analytics add-on that we can use to access the data in the Sheets, however, unfortunately as of now, there’s no official GA4 add-on for the same job.
There are also a few third-party free and paid add-ons that are available to get your GA4 data into the Sheets, so let’s see how they work.
1. Google Analytics and GA4 Connector by Syncwith (Free)
This free add-on allows you to get UA and GA4 data to your Sheets in a few simple steps. Go to Extensions → Add-ons → Get add-ons and install this add-on.

Once installed, you will see it with the other add-ons you’ve installed (if you have any) and it will give you the option to Launch the sidebar. This is where all the action happens.

You will now see a sidebar that gives you the option to connect Google Analytics v3 (UA) and Google Analytics v4, as well as some default reports to choose from.

Once you choose the GA4 option, you will see some standard setup options like report name, connect the GA4 account/property, select the date range, dimensions, metrics, filters, and sorting, among others.
But you can’t apply segments as it’s doable with UA’s add-on, maybe because GA4 segments are only available in explorations.

Once you click on the Next button, you have to make some choices for Sheet settings. You can choose to manually update the report or automate it by scheduling it after every 5 minutes, hourly, or daily. There’s no weekly or monthly basis setting, which is a bit weird.
All that is left is to choose where to insert the report, i.e., Currently selected cell or New sheet, and click on the Insert button.

Now you can see the results of your hard work based on your settings.

The Click to Refresh option in the first row is helpful to update the report quickly. But, you can choose to Hide status row under the Sheet settings or simply hide that row in the Sheets interface.

Another good thing is that you can choose multiple GA4 properties from the sidebar interface. However, you have to choose the Property ID or Property Name dimension with it, as well.

The example below shows that there are data for two different properties.

You can see the reports you’ve created in the sidebar and Refresh from there. You can also edit, delete, duplicate, or add a New report you can do from the sidebar interface.

All in all, this is an add-on that can get you started with your GA4 data export, as well as automate it. But it doesn’t end here.
2. GA4 Magic Reports (Free)
This is also a free add-on that allows you to export Google Analytics 4 data to Sheets but with a different setup interface.
But before you can use it, you have to install it from Google Workspace.

Once installed, you can find it under extensions giving you options to Create, Run, and Schedule reports.

Let’s start with Create new report. This will open a Create Google Analytics 4 report setup interface on the right side, and add a new GA4 Reports Configuration sheet at the same time.

In the GA4 Reports Configuration sheet, you can manually add the parameters. A good thing is that if you hover over each cell you will find a note explaining how you can use it.
The setup interface sidebar is easier to use and has standard fields like the report name, GA4 property, dimension, and metrics, as well as other settings such as sorting and filters.
Once all is done, simply click on the Create button.

This will transfer all these selected settings to the GA4 Reports Configuration sheet as shown below.

To run the report, you will have to go to Extensions → GA4 Magic Reports add-on → and Click on Run reports.

Once you Run reports, a new tab will be created and you should see a Report Status prompt that tells if it was successful or not.

Your new report will look something like this.

If you don’t want to see the extra information in the header, then you can either hide those rows manually or add TRUE in front of the Hide report header cell in the GA4 Reports Configuration tab.
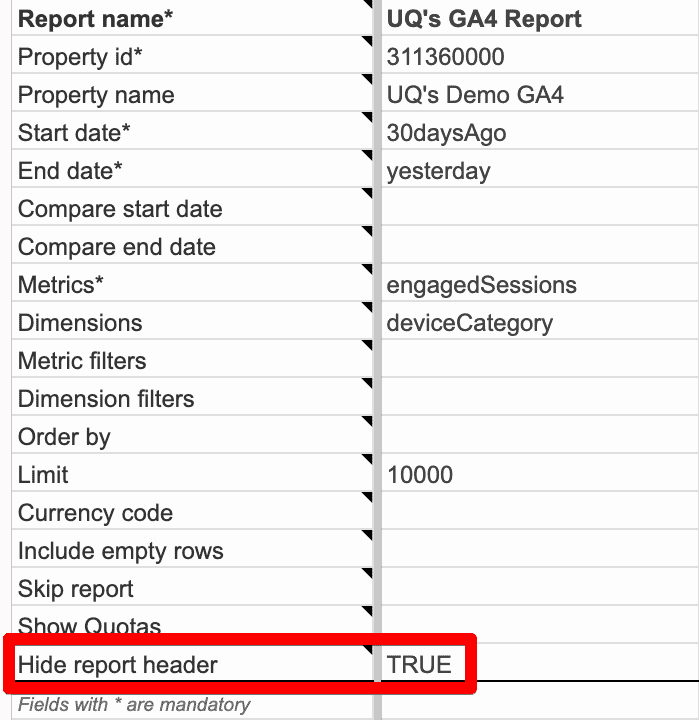
Now, you will not be able to see all the extra information in the header.

You can also schedule the reports if you go to Extensions → GA4 Magic Reports → Schedule reports.

This gives you a settings prompt where you can Enable reports to run automatically and then you’ll see options to run reports every two hours, day, week, and month.

Do most parts of this add-on look familiar? That’s because it is based on the layout of Google’s add-on for Universal Analytics with some small changes.
3. Adformatics (Paid)
The GA4 – Reporting for Google Analytics 4 add-on comes with a 14-day free trial that costs €9 on a monthly and €79 on a yearly plan.

For the most part, it works like the Magic Reports add-on that comes with a nice sidebar UI for report setup. Let’s have a quick look at its setup interface.

The Configuration GA4 reports tab also shows up once you select all the settings and click on the Add report to sheet button.
What makes it intuitive is when you click on the individual settings like date range, metrics, dimensions, etc., it’s very clean, and is easier to make the selections. Here’s an example of the date range settings.

As you can see, you can choose from a myriad of options, as well as Compare with the previous period, year, or custom dates.
Next, let’s see what one of the other settings like Selecting metrics look like.

The metrics are divided into categories neatly and also include custom ones.
There’s also a toggle switch to turn on JSON, which will give output in JSON format, so you can edit it as you want. The same goes for the dimensions.
This is what the final settings would look like.

Once you create the report, a new Configuration GA4 Reports tab is created and these settings are transferred to it, which looks quite similar to the output of the GA4 Magic Reports add-on.
The sidebar interface then shows you four options to Run reports, Create report, Edit report and Set a schedule.

Once you Run reports, you will see a status prompt that indicates if it was done successfully or not.

Another sheet will be added that looks very much like the one in the GA4 Magic Reports add-on.

Considering it’s a paid add-on, it is a bit disappointing that there is not a cleaner report that’s easier to analyze.
The Set a schedule option lets you schedule the reports similarly to GA4 Magic Reports, except that you now have the option to Send email if report fails.

So what does paying for this add-on get you apart from a somewhat nice UI? Here’s what their website says:
- Unlimited GA4 properties
- Unlimited reports*
- Up to hourly automated refreshes
- 1 user
- Email support
* Google’s quotas and Google Sheets limits do apply.
1 user refers to the Google account you will use to access GA4 properties. The costs can add up if you want to add more users by €9 for each. Is it still worth it? We’ll leave that to you.
4. Supermetrics (Paid)
If you’re aware of working with different Google Sheets add-ons, chances are that you might’ve heard about Supermetrics which is another paid add-on that can be used to connect multiple data sources. Now, we’ll just talk about GA4.

Once installed, you can Launch it from the Extensions menu and all of the other settings are then configured in the sidebar.

Here’s how the setup interface looks.

Clicking on Create new query takes you to the next step where you have to connect the data source, which is Google Analytics 4. Think of a query as a ‘report.’

Once you’re connected to a GA4 account, you can set up the report by selecting the dates, metrics, dimensions, filters, and other settings. You will not be asked to enter a report name. Let’s go over them quickly.
The Select dates interface gives you a lot of options to choose from including the Compare to option.

The metrics interface lets you choose… well metrics divided into different categories like Basic, Events, Ecommerce, etc., including any custom ones as well.

The dimensions interface is different, as it allows you to split by rows or columns, as well as choose the number of rows to fetch and sort rows.

The filter interface is simple yet quite extensive, due to the number of Operators aka conditions you can choose from, which also includes Regex.

The last section is about different Options that you can select by checking, as well as being able to Highlight the values based on the selected option.

Here are your options to highlight values with colors:

What about the Advanced settings? Well, here’s what you can apply by typing in that field.

Finally, we can now click on the Get Data to Table button and it will insert the data in the selected cells. Note that this won’t open a new sheet like the other add-ons with a report name.

The exported data looks cleaner compared to other add-ons. The sidebar shows you the overall stats like All queries aka reports, and how many are In current sheet. You can also Schedule the queries at the top.

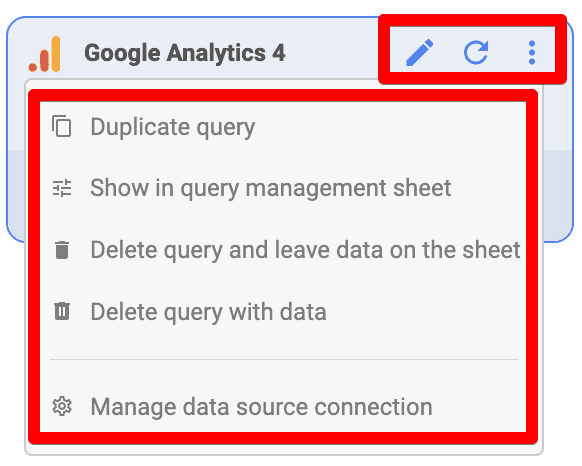
The option to edit, refresh, duplicate, delete, and manage data source connection can be found with the pencil, circular arrow, and 3-dot icons.
To schedule, click on the Schedule in the sidebar menu and you will see an option to Add trigger.

Clicking on the Add trigger button opens up the settings panel with many flexible scheduling options like hourly, daily, weekly, or monthly. It also includes emails and email notifications upon failure.

The displayed Timezone is picked up by this add-on based on the Sheet’s timezone. So you cannot change it from this interface, but if you change it from Sheet settings, then it will update here as well.
The hamburger menu on the left corner gives you more settings like refreshing all queries, managing data source connections, duplicate the report for another account, etc.

The Template gallery option is unique to Supermetrics and provides you with some cool templates to build your reports on.

These templates are categorized by sources and use-case, i.e., Paid Media, Paid Social, Web Analytics, SEO, Social Media, Email, Sales, and Custom (your email should have access to the Sheets file).
But you don’t have to launch the sidebar every time to refresh the queries or access the Template gallery. You can now find them under the add-on options in the Extensions menu after you create your first query.

Lastly, the profile icon on the right corner of the sidebar gives you information about your Supermetrics accounts like email and subscription.

As you can see, you can get a 14-day trial and have to purchase one of their plans to keep using it. They have three plans showing per-month prices that can be billed monthly, quarterly, and annually.
- Essential (€87 monthly, €77 quarterly, €67 annually)
- Core (€249 monthly, €221 quarterly, €199 annually)
- Super (€624 monthly, €554 quarterly, €499 annually)
You can also contact them for a custom Enterprise plan. Find more details about Supermetrics pricing plans for Google Sheets.
This makes it an expensive add-on and also brings us to the ultimate question in the next section.
What’s the Best Method to Export GA4 Data to Google Sheets?
This depends on your intended use, so now’s the time to sit down with your team and discuss your reporting needs.
In general, if you have to export data to Sheets very rarely, then the manual export method from GA4’s UI should be good enough.
If you export it frequently for a few properties and only need to schedule some basic reports, then using one of the free add-ons should get the job done for you.
If you export it for multiple properties to be used by many people in your company, then Supermetrics would suit you better. Their costly service also comes with chat support right in the sidebar, as well as other helpful materials.
But for most folks, Supermetrics might be overkill and the free add-ons will be good enough. Hopefully, Google will come out with its own GA4 Sheets add-on, as the days of UA are now numbered.
But for most folks, Supermetrics might be overkill and the free add-ons will be good enough. Hopefully, Google will come out with its own GA4 Sheets add-on, as the days of UA are now numbered.
Summary
How to Export Google Analytics 4 Data to Google Sheets (Summarized Steps)
- Using GA4 Interface to Export Data:
- Open the desired built-in report or exploration in GA4 (e.g., Acquisition report).
- Click on the share icon in the top right corner to open the Share this report sidebar.
- Click on the Download file option and select CSV.
- Once the file is downloaded, open Google Sheets.
- Go to File → Import → Upload the CSV file.
- Choose the import settings and click Import data.
- Exporting Data from GA4 Explorations:
- Open the exploration report you want to export in GA4.
- Click on the Download icon and select Google Sheets.
- A new tab will open in Google Sheets, click on Import data.
- Using Google Analytics and GA4 Connector by Syncwith (Free Add-on):
- Go to Extensions → Add-ons → Get add-ons and install Google Analytics and GA4 Connector by Syncwith.
- Launch the sidebar from Extensions → Google Analytics and GA4 Connector by Syncwith.
- Connect to your GA4 account/property and configure the report settings (date range, dimensions, metrics, etc.).
- Choose to manually update the report or schedule it to update automatically (e.g., every 5 minutes, hourly, daily).
- Select the insertion point for the report in Google Sheets and click Insert.
- Using GA4 Magic Reports (Free Add-on):
- Install GA4 Magic Reports from Google Workspace.
- Go to Extensions → GA4 Magic Reports and select Create new report.
- Configure the report settings in the sidebar (report name, GA4 property, dimensions, metrics, sorting, filters, etc.).
- Click Create to transfer settings to the GA4 Reports Configuration sheet.
- Run the report by going to Extensions → GA4 Magic Reports → Run reports.
- To schedule the reports, go to Extensions → GA4 Magic Reports → Schedule reports and set the schedule.
- Using Adformatics (Paid Add-on):
- Install GA4 – Reporting for Google Analytics 4 add-on from Google Workspace.
- Launch the sidebar from Extensions and configure the report settings.
- Set the report configuration and click Add report to sheet.
- Run the report and check the status prompt for success.
- Schedule the reports using the Set a schedule option in the sidebar.
- Using Supermetrics (Paid Add-on):
- Install Supermetrics add-on from Google Workspace.
- Launch the sidebar from Extensions and create a new query.
- Connect to the GA4 data source and configure the report settings (dates, metrics, dimensions, filters, etc.).
- Click Get Data to Table to insert the data into Google Sheets.
- Use the sidebar to edit, refresh, duplicate, or delete queries.
- Schedule the queries using the Schedule option in the sidebar and set the desired frequency and email notifications.
So, we have learned some of the major reasons why you’d want to export Google Analytics 4 data to Google Sheets, and how to do that.
Part of how to export Google Analytics 4 data included learning about different methods which include GA4’s interface as well as using third-party add-ons for Sheets.
It’s important to determine your reporting needs as that would help you decide which method will work best for you and whether you should opt for free or paid add-ons. Paid add-ons usually offer you a free 14-day trial, so hopefully, that should give you an idea.
If you’re just starting with GA4, then you might want to check out Sofiia’s blog on Google Analytics 4 Setup Best Practices.
How frequently do you export Google Analytics 4 data to Google Sheets? What methods do you use and why? Let us know in the comments below!
FAQ
Can I schedule reports to be exported to Google Sheets using the GA4 interface?
Currently, there isn’t an option to schedule reports for automatic export to Google Sheets from the GA4 interface. You would need to manually download and import the data each time.
Are there any free add-ons available for exporting GA4 data to Google Sheets?
Yes, there are free add-ons like Google Analytics and GA4 Connector by Syncwith and GA4 Magic Reports that allow you to export GA4 data to Sheets. These add-ons provide basic functionalities for data export and some automation options.
Can I customize the exported reports in Google Sheets?
Yes, once the GA4 data is exported to Google Sheets, you can customize the reports as per your requirements. You can use various features in Sheets like formulas, graphs, pivot tables, and dashboards to manipulate and visualize the data for better analysis.


")