
Last Modified on December 12, 2024
🚨 Note: All standard Universal Analytics properties will stop processing new hits on July 1, 2023. 360 Universal Analytics properties will stop processing new hits on October 1, 2023. That’s why it’s recommended to do the GA4 migration.
Google Analytics dashboards are not always comprehensive—which is why digital analysts prefer exporting their data into other tools, like Google Sheets.
Google Sheets is a great option to create a Google Analytics dashboard using the GA Reporting API. It is free, flexible, and can help you with quick analysis.
In this guide, we’ll learn how to import Google Analytics data into Google Sheets to create meaningful dashboards. We’ll also use a Google Sheets plugin called Supermetrics to import and visualize data.
An overview of what we’ll cover:
- An overview of reporting tools
- The reporting API
- Pros of using Google Sheets for reporting
- Pulling data from Google Analytics using Supermetrics
- Supermetrics features
So let’s start!
An Overview of Reporting Tools
Google Analytics is one of the best tools to track your website traffic.
However, it is not flexible enough to create custom reports or data visualization dashboards that can be sent to clients. Without data visualization, your clients may not be able to understand the data you’ve collected, no matter how thorough it is.
This is why many digital analysts prefer to export their data to different tools.
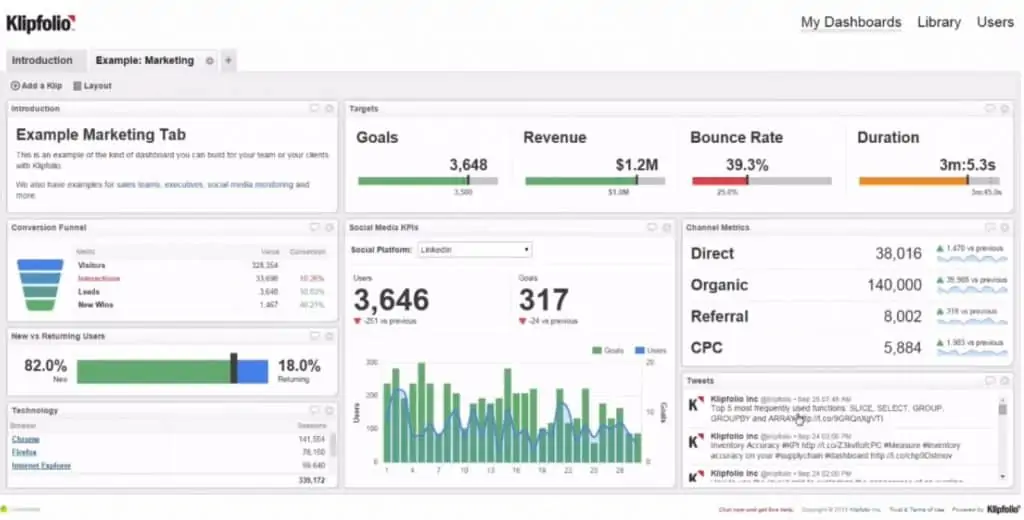
For example, you can use the tool Klipfolio to display your data in a more comprehensive manner.
Klipfolio has a few different products and different pricing tiers, including one that is free. It’s great if you are confident in your coding so that you can customize your reports, but it can be challenging if you don’t have that experience.
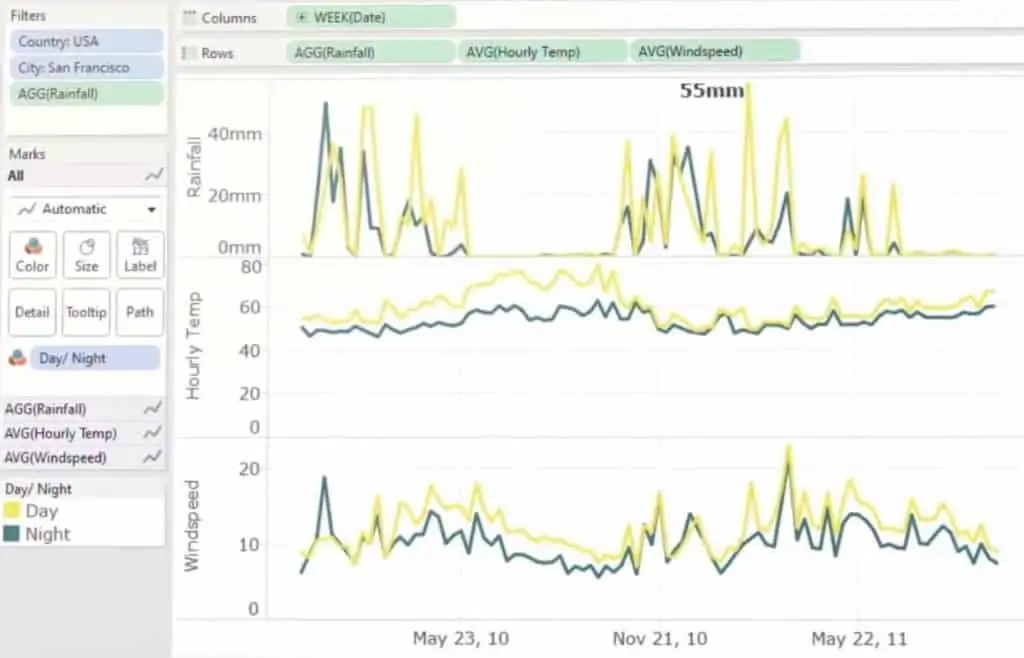
Similarly, if you require more data visualization and analysis, you can use Tableau.
Tableau is a well-developed software with huge data processing capabilities, although it’s a steep learning curve for most users. It also doesn’t have a free tier, although you can customize your paid plan and maximize cost-efficacy for your needs.
And if you want even more advanced statistics to follow your data reports, you can program custom reports with the help of a language called R.
R projects are easy to connect to Google Analytics accounts and fetch data, but it’s quite the time investment to learn.

But sometimes, all you need is a basic analysis of your data—which you can accomplish with MS Excel or Google Sheets.
Google Analytics already has a functionality that allows you to export data directly using the Export option. With this function, you can transfer all of your data directly to Excel or Sheets.
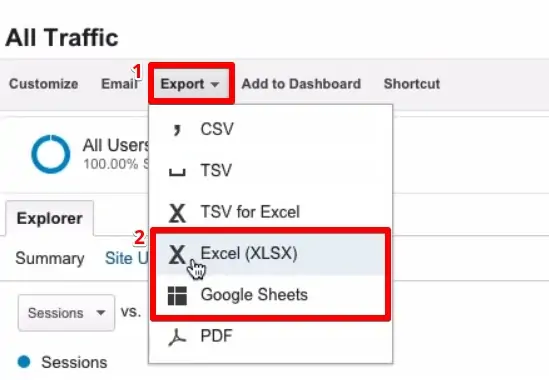
However, this can be a tedious process. It requires you to go into various GA reports individually to export data, then manually copy that data from each exported spreadsheet to compile everything in one sheet.
A better way to import data from Google Analytics is using something called the Reporting API.
Let’s see how this works!
The Google Analytics Reporting API
The Google Analytics Reporting API is the interface that collects and manages your tracking data. By working directly with the reporting API, you can simplify several aspects of your data analysis workflow—including data exports.
First, you’ll need to go to the Core Reporting API and log in with the Google account that you use for Google Analytics.
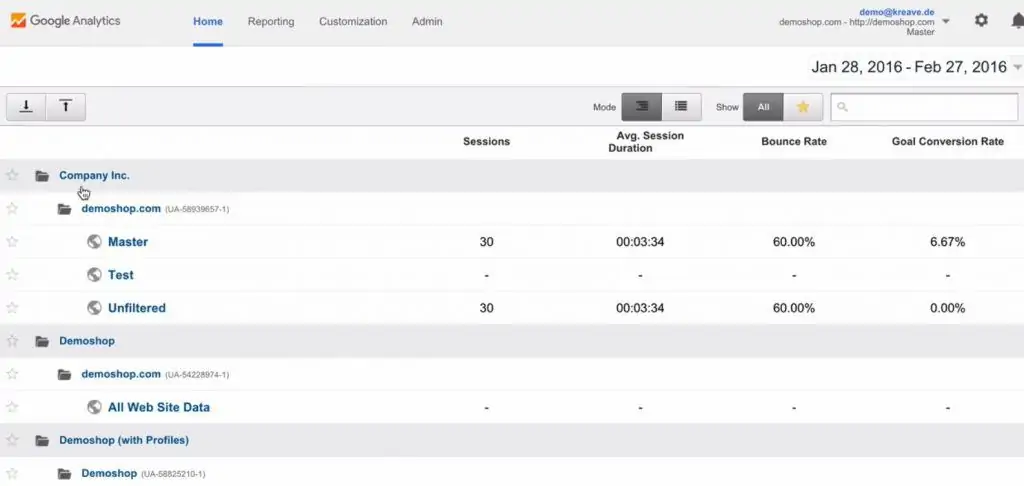
Then, click on the Query Explorer tab to select a view for your Google Analytics data.
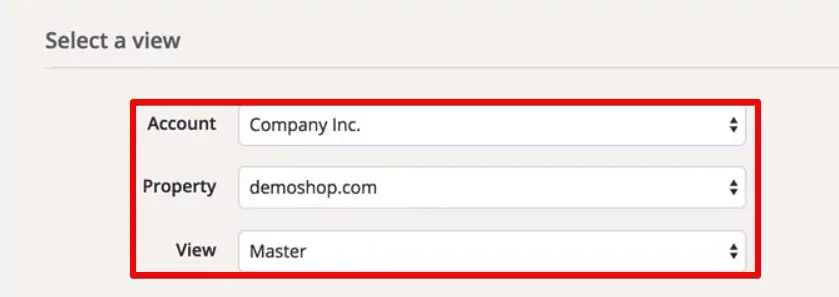
This view will be the same as the one you’d see in the Home tab of your Google Analytics account.
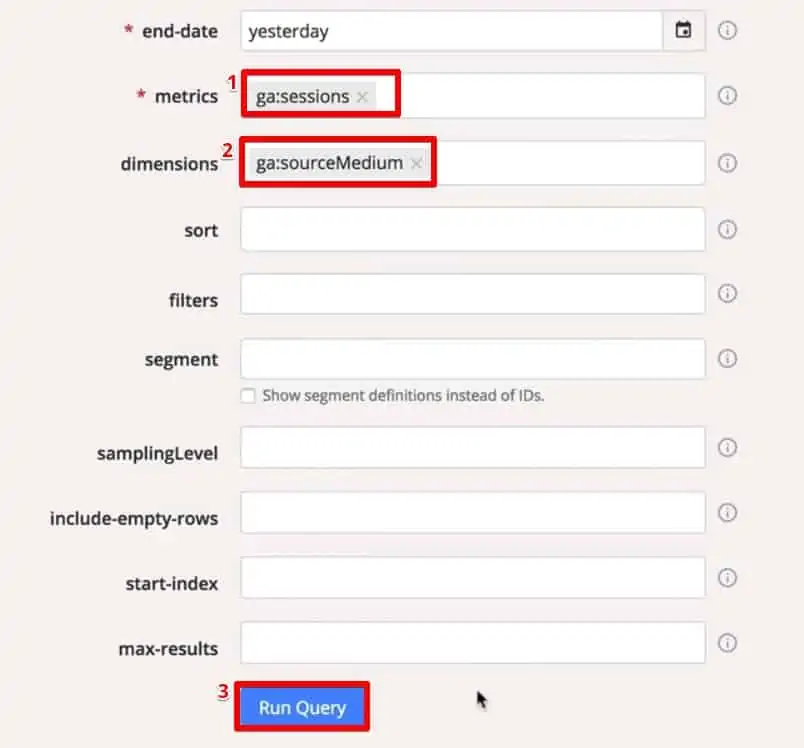
Next, you can select the Query Parameters that you want to import. For example, let’s try to recreate the Source/Medium report of Google Analytics.

In the Query Explorer, select the start-date and end-date that you want for your report. You can also select the metrics from the drop-down menu.
💡 Top Tip: Click on the info icon next to the metrics to understand different available metrics with descriptions.
To generate the Source/Medium report, we’ll select sessions as metrics and sourceMedium as dimensions.
That’s all. Click on the Run Query to generate the report.
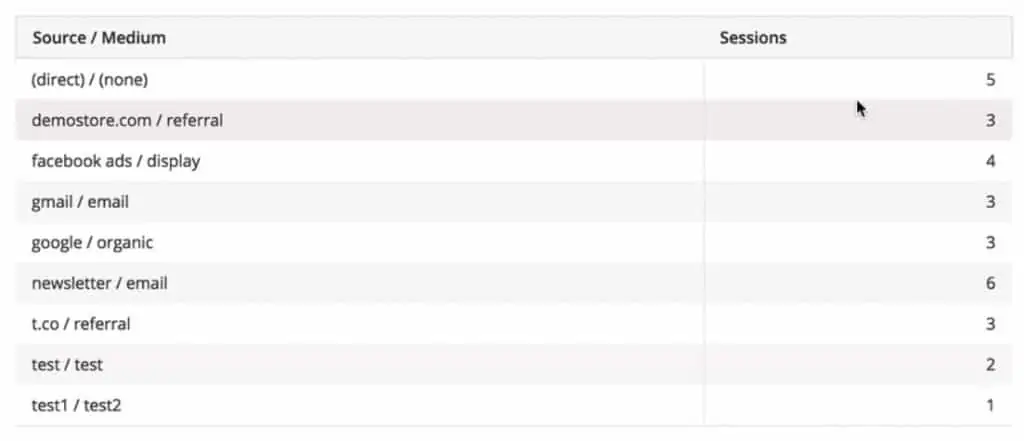
You’ll see the Source/Medium report from the fetched data.
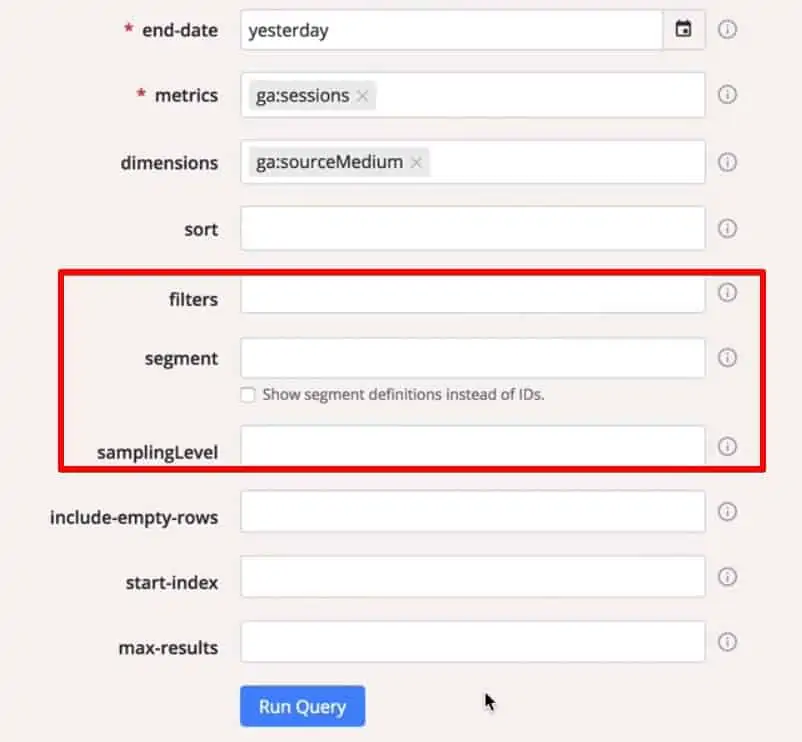
There are several other parameters such as segment and filters that you can select. You can also define your samplingLevel.
One great thing about this is that it’s available even in the free version of Google Analytics. It gives you a sample of free data from your Google Analytics account via the API.
If you want, you can also write a script in Python or PHP to connect to the API and fetch data. Or, you can use plugins in Excel like Analytics Canvas to import data and analyze it.
But in my opinion, Google Sheets is an easier option to create reports and dashboards.
Let me show you why.
Pros of Using Google Sheets for Reporting
To start with, Google Sheets is a free tool, and it’s easy to share your files with clients and collaborators. All they need to do is open a link—no need to download files or use special software.

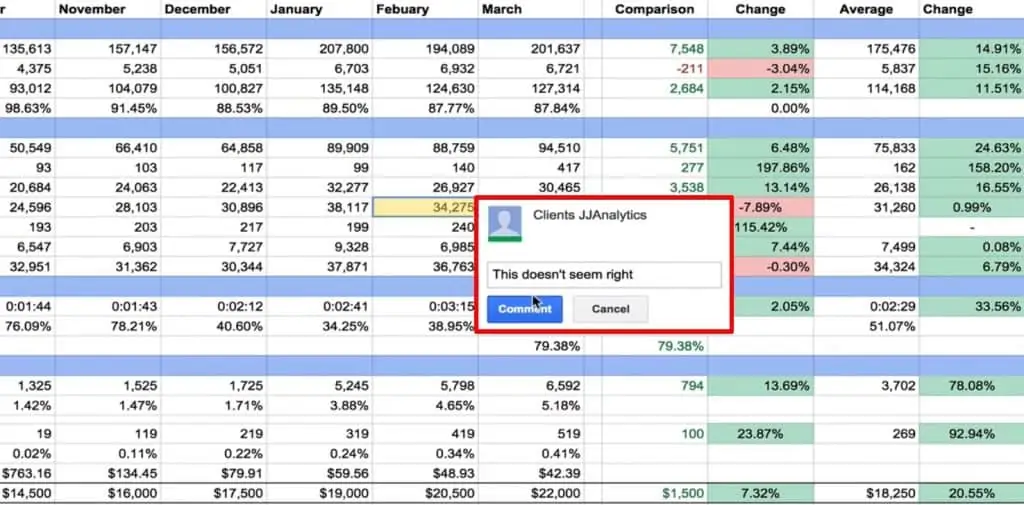
You can collaborate with others by leaving comments and even tagging teammates.
Also, it is very easy to update data in Google Sheets. If there’s new data or information that you want to add, you can incorporate it directly into your existing sheet. This is a big advantage over data visualization software that only pulls data from external sources.
As a reference for you, I have created a dashboard from scratch that contains data of an e-commerce website directly from Google Analytics.

You can download this dashboard template to create your own reports and customize it according to your requirements.
To fetch the data, you can use an Add-on called Supermetrics. First, install it on Google Sheets, by going to Add-ons and selecting Get add-ons. Then, just search for Supermetrics and click Install.

This tool allows you to connect your Google Sheets directly to the Google Analytics Reporting API and pull the data directly into the correct cells.
From there, you can format, analyze, and present the data for more insights. It’s my favorite tool for fast, easy data analysis and presentation. Let’s take a look at an example.
Pulling Data from Google Analytics Using Supermetrics
Suppose we want to import data to our spreadsheet on visitors to our website during the last month. We’ll start with a raw data sheet and pull the data from the Google Analytics account to create a dashboard.
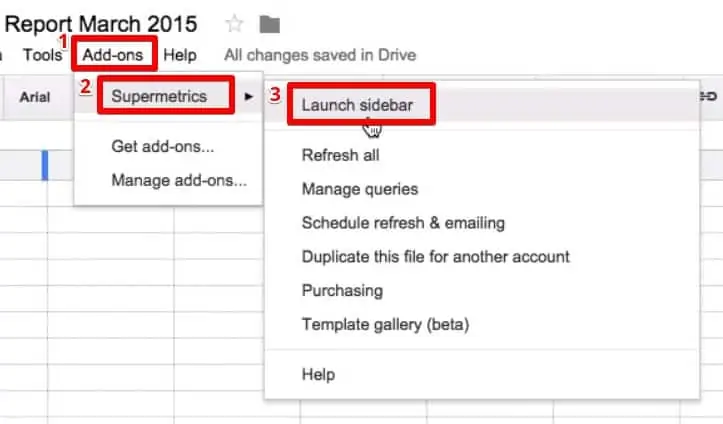
To launch Supermetrics in Google Sheets, go to the Add-ons → Supermetrics → Launch sidebar.
Make sure to connect your Google Analytics account to the add-on.
Next, we’ll go to Data source → Select views. Under the Select Dates option, we’ll select This month to date to fetch data from last month.
Going further, we can Select metrics. Let’s go with Sessions and Users.
The next option is Split by. You can split your data from rows as well as columns. In our example, the rows are already split into Sessions and Users. But we’ll split the columns by Month.
Then you can select any Segment that you’ve defined in your Google Analytics account, or you can use the Filter option to refine your data.
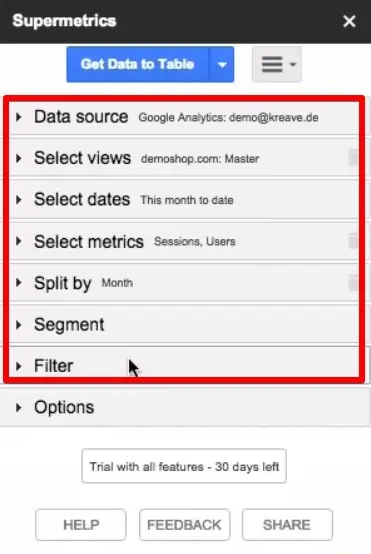
Lastly, you can explore the Options tab. This gives you an option to avoid data sampling (which is usually a problem with the free version of Google Analytics). If you use this feature, Supermetrics will fetch your complete, unsampled data bit by bit.
For this example, we’ll keep it unchecked to speed things up—but it’s a very useful tool if you have tons of data.

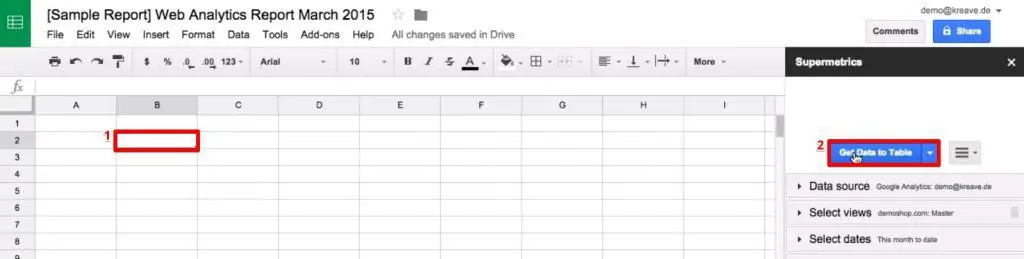
Once all the parameters are set, click on Get Data to Table. This will insert the data to the cell you currently have selected.
We’ll see the Sessions and Users data for the current month up to this date.
If you want, you can also add some basic Excel or Google Sheets calculations on this data. For example, we can enter a formula to find the number of sessions per user in this Sheet (done by dividing the number of sessions by the number of users).

Lastly, we can connect this data to our final dashboard by using this cell address (‘Raw Data’!C4).

But there’s much more you can do with the Supermetrics tool. It has both a free and a paid version, and which you can select based on your requirements.
Not sure what you need? Let’s break down some of the most important features.
Supermetrics Features
The paid version of Supermetrics has the ability to schedule updates to Google Sheets reports automatically and send those reports out using emails.
To access this feature, go to Add-ons → Supermetrics → Schedule refresh & emailing.

This automation saves a lot of time, especially while working with multiple Google Analytics accounts. You can also send regular reports to your clients.
The basic version is free for Google Analytics. It can also connect to a number of other tools including AdWords or YouTube to import data into Google Sheets.
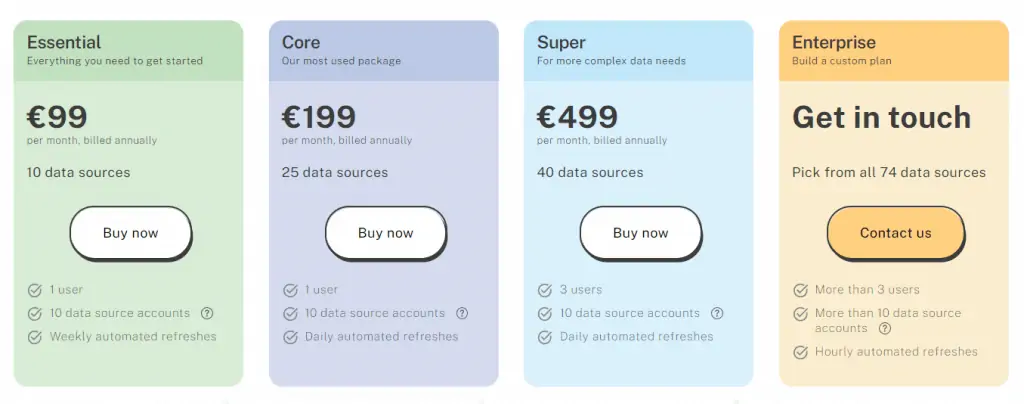
However, you can only import data up to 100 rows. If you want to import more data, you’ll need to pay the price starting from €99 per month for these integrations.
Depending on your requirements, you can choose different plans. Additionally, if you want, you can also create a custom plan for your business that will be charged according to the data sources you choose.
🚨 Note: However if you’d prefer to create a dashboard inside of GA4, check out our guide to building a GA4 dashboard.
FAQ
How do I import data from Google Analytics into Google Sheets?
To import data from Google Analytics into Google Sheets, you can use a Google Sheets add-on called Supermetrics. Install Supermetrics from the add-on gallery in Google Sheets, and then launch the Supermetrics sidebar. Connect your Google Analytics account to the add-on, specify the data parameters (e.g., date range, metrics, dimensions), and click “Get Data to Table” to import the data into a selected cell.
Can I create custom reports and dashboards with Google Sheets and Google Analytics?
Yes, you can create custom reports and dashboards using Google Sheets and Google Analytics. After importing the data into Google Sheets using Supermetrics, you can format, analyze, and present the data according to your requirements. You can also customize the dashboard template provided in the blog post and tailor it to your specific needs.
Do I need to migrate to GA4 for using the Google Analytics Reporting API and Google Sheets integration?
No, the Google Analytics Reporting API and Google Sheets integration can be used with both Universal Analytics and GA4 properties. However, it’s recommended to migrate to GA4 as Universal Analytics properties will stop processing new hits on July 1, 2023, and 360 Universal Analytics properties will stop on October 1, 2023. Migrating to GA4 ensures compatibility and access to future enhancements in Google Analytics.
Summary
That’s it! This is how you can build a Google Analytics dashboard using Google Sheets and the Supermetrics add-on.
Google Sheets is a free tool that provides customizability and flexibility to analyze data. It also has various plugins to import data. Supermetrics is definitely my favorite way to pull data into Google Sheets, but you also can learn other ways to export data from Google Analytics to Google Sheets in this guide.
Do you think Google Sheets is the best option to analyze Google Analytics data? Do you import data into Google Sheets from other tools as well? Let us know in the comments below!


")
Julian, excellent video I am already thinking of so many dashboards to create thank you so much love it.
glad you like it
Julian, excellent video I am already thinking of so many dashboards to create thank you so much love it.
glad you like it