
Last Modified on February 27, 2025
In this Chrome Developer Tools guide, we’ll demonstrate technical skills that you can use to understand and improve your website marketing.
Ever wonder what’s going on in your browser when you open a new page, when a tracking code fires, or when your site just loads and loads and loads?

Subscribe & Get our FREE GA4 Course for Beginners
Then it’s time to look under the hood and examine the inner workings of your website!
Chrome Developer Tools is a great toolset that every marketer should know. So let’s take a look at how to use Chrome Developer Tools and how you can use them as a marketer.
Here is an overview of what we’ll cover:
- What are Chrome Developer Tools?
- How to Access Chrome Developer Tools
- Elements
- Toggle Device Tool Bar
- JavaScript Console
- Sources
- Network
- Application
We’ve got lots to cover, so let’s dive in!
What are Chrome Developer Tools?
Chrome Developer Tools provides a suite of tools for inspecting and debugging web content.
They offer insights into the structure, performance, and functionality of web pages.
When you open DevTools, you’ll encounter various panels like Elements, Console, Network, and Performance, each serving a unique purpose.
Common Use Cases for Beginners:
- Inspect Page Elements: Dive into the HTML and CSS of a page. This is especially useful for checking on-page SEO elements like h1 and h2 tags.
- Edit CSS in Real-Time: Visualize design changes instantly by tweaking the CSS directly from the Elements panel.
- Identify Technologies: Discover the technologies and plugins a website is using.
- Directly Edit Website Content: Draft and visualize content changes directly on a webpage.
- Responsive Design Testing: Use the device toolbar to see how your site appears on various devices.
Use Cases for Advanced Users:
- Identify Load Speed Issues: Analyze website load speed and identify bottlenecks that might be affecting performance.
- Debug Non-Working Plugins: Identify and troubleshoot malfunctioning third-party plugins.
- Logo Extraction: Easily extract logos or other images directly from websites.
- Color Picker: Use Chrome’s built-in color picker to identify and replicate colors from any website element.
How to Access Chrome Developer Tools
Let’s take a closer look at the Developer Tools in Google Chrome.
Developer Tools are a built-in feature of Google Chrome, but other browsers have similar developer tools. Some of these are also built-in, or you might need to install a plug-in or even a separate developer browser.
But in this guide, let’s focus on the Developer Tools in Chrome. How can you reach them?
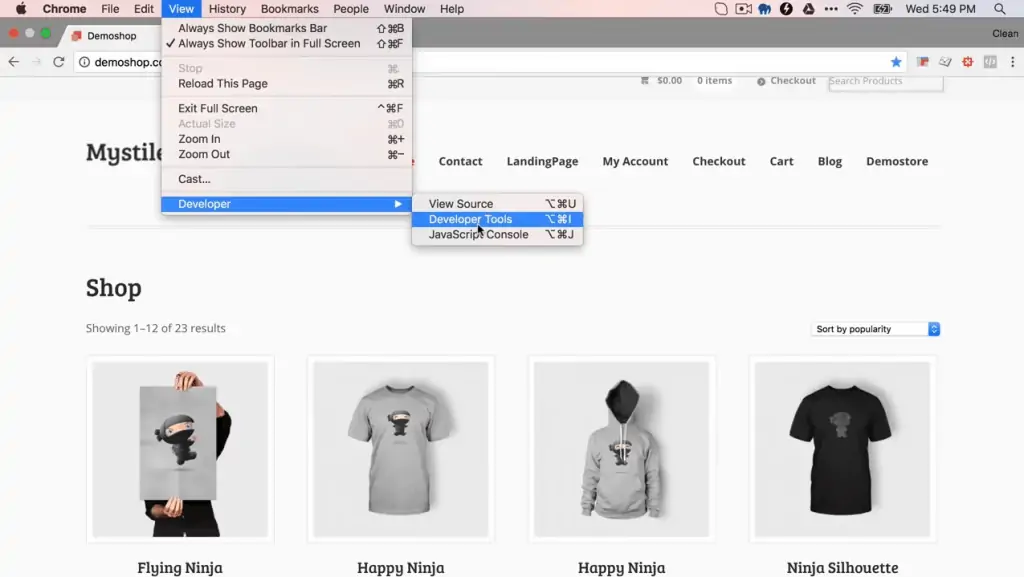
If you’re using macOS, then go to View → Developer → Developer Tools. If you’re using Windows, then click the snowman menu (three vertical dots) and go to More Tools → Developer tools.
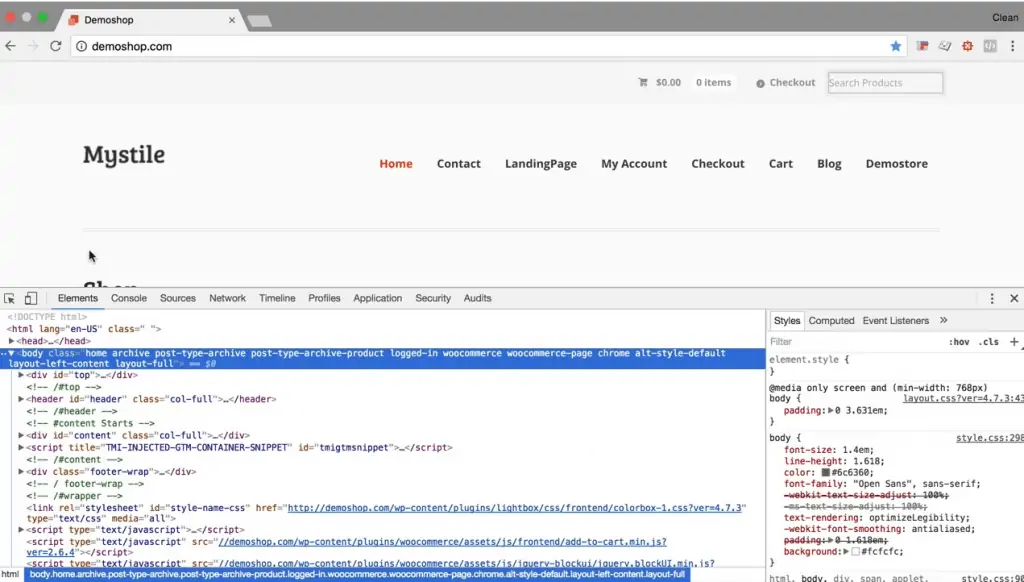
You will be greeted with another panel here that lays over your website. It has some different tabs across the top that may look unfamiliar, but these are the tools that will help us out.
As marketers, you should be aware of some of these functionalities.
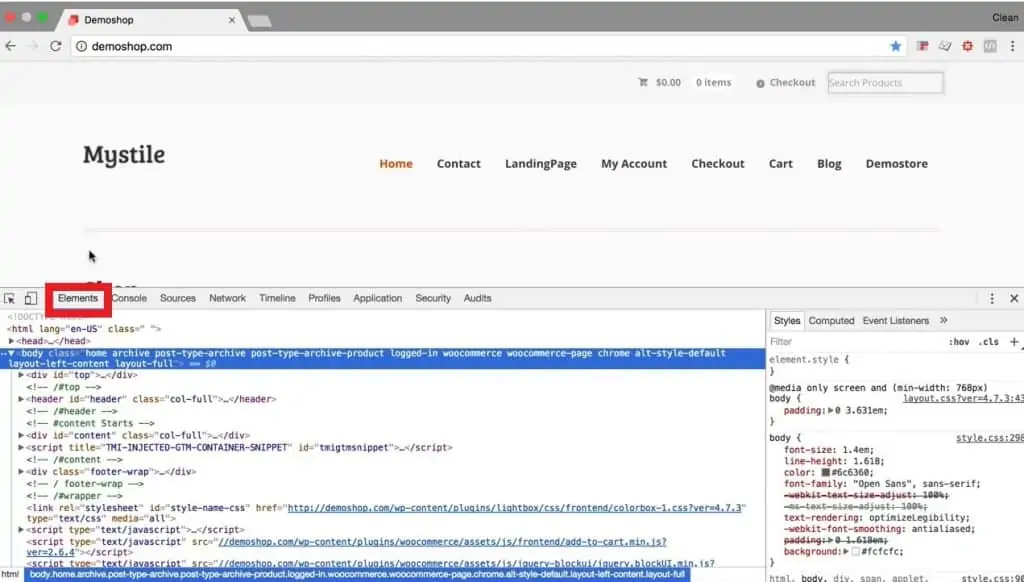
Elements
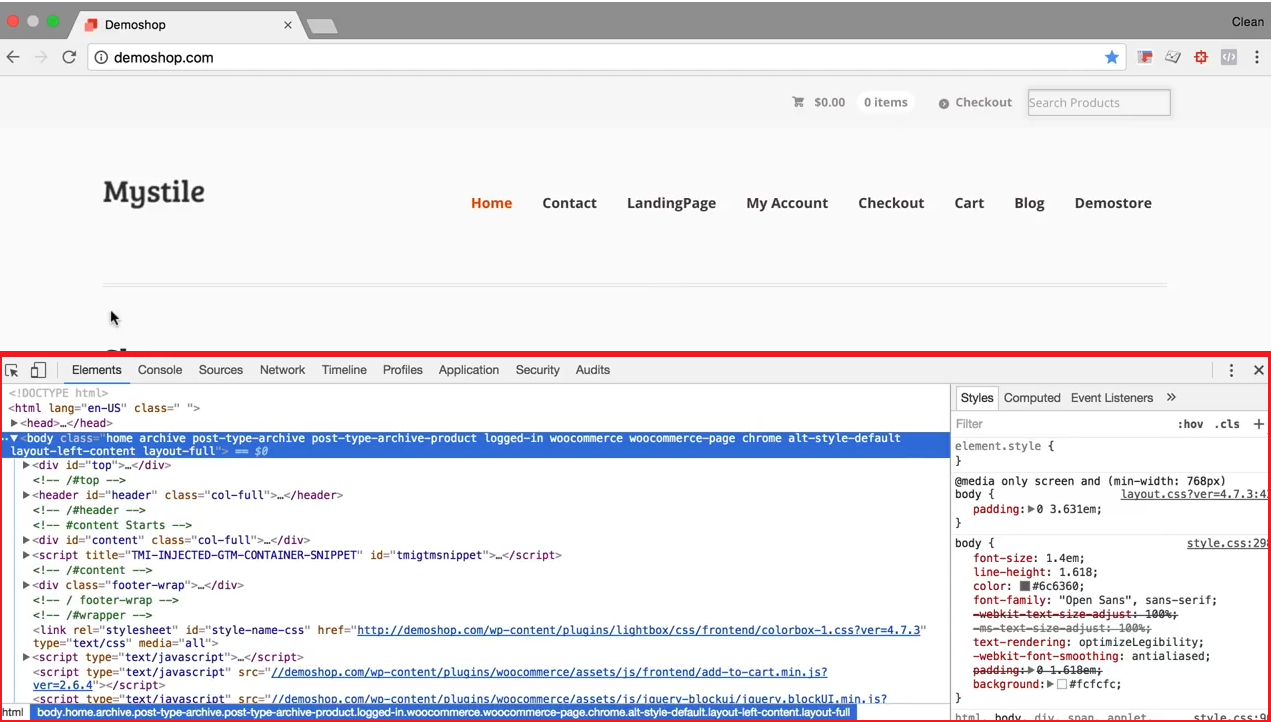
First up is the tab labeled Elements.
The Elements overview gives you a representation of the current HTML.
Note that this is different from what you see when you go to View Page Source on a web page!
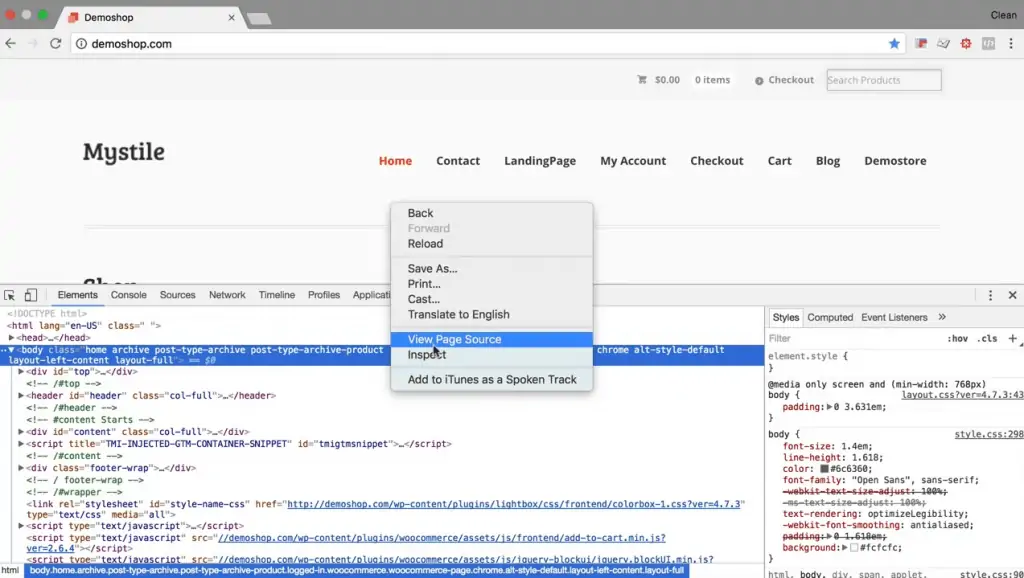
When you use the regular browser function View Page Source, you’ll open the initial HTML file that is downloaded from the server in another tab.
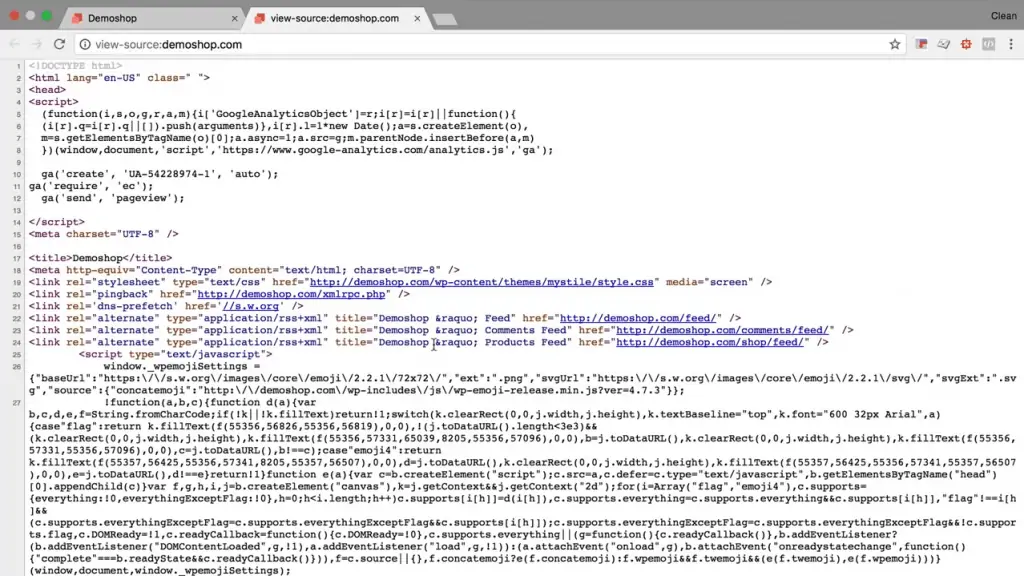
This page source is the current HTML file, as it is represented on this page right now. This might differ because of the scripts and might download and manipulate the page in one way or the other.
If you want a more accurate picture of the web page’s current state, you can look at this Elements overview here.
When you go over one or the other line here, some markers come up on the website.

This is pretty useful if you want to find out where a certain element is placed in the HTML markup. You can go through the Elements panel directly, and find the element in the markup when Developer Tools highlights it.
The other way to do it is to right-click on an element, and then click on Inspect.
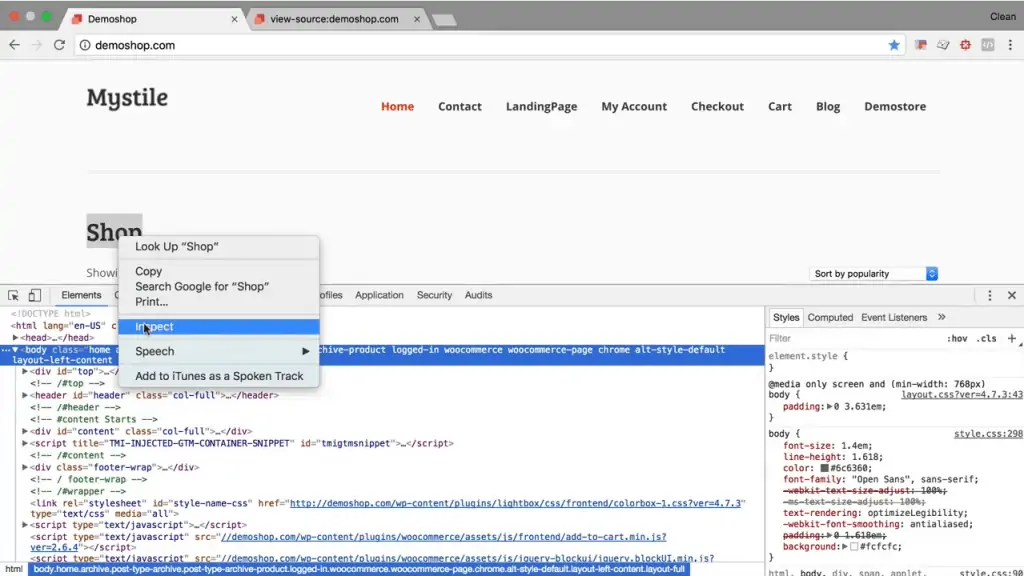
It will jump right to the element, and you will be able to see where the element is placed.

Inspecting allows you to see where a certain element is placed.
Or, there’s also the Selector Tool right here.
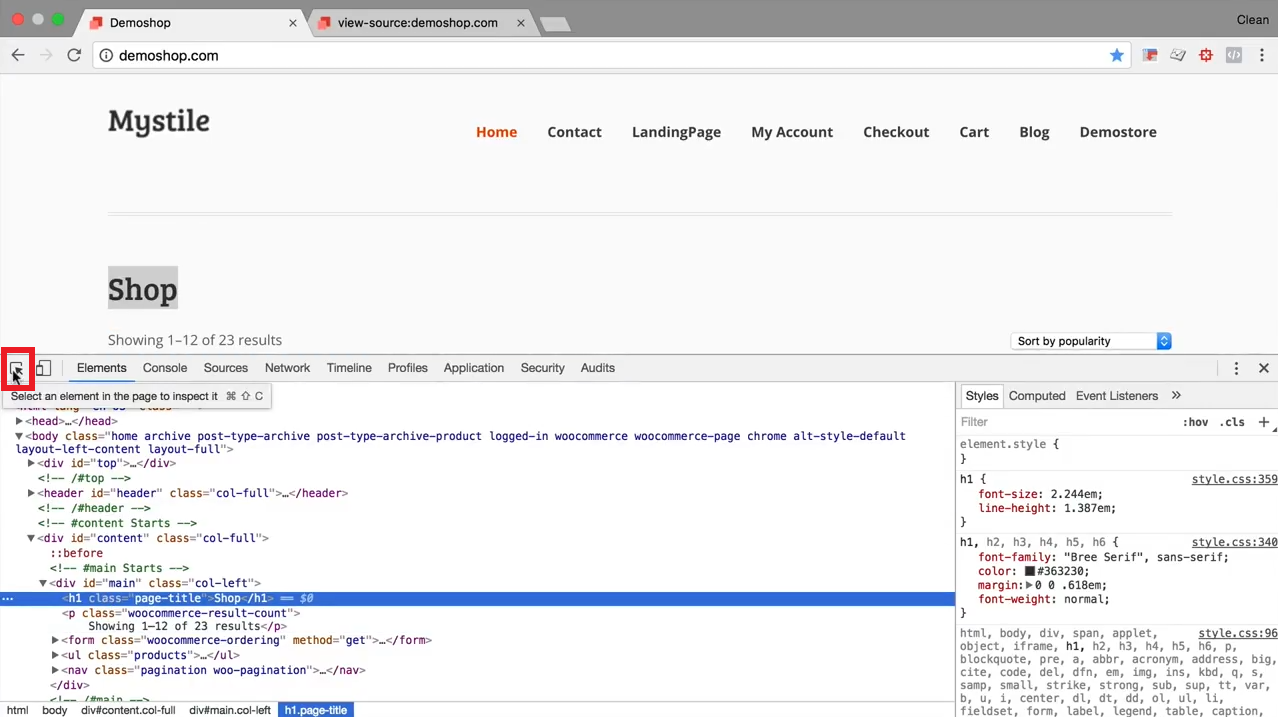
The Selector Tool lets you jump right to the element that you are currently pointing to with your mouse.
The HTML and the CSS code that you see right here are represented in the browser: HTML on the left, and CSS on the right.
If you want to change any of the content or the appearance of this website, you would need to do this in your HTML or CSS.
With the HTML in the Elements pane, you can easily find elements that you want to edit.
You can also make your edits directly in this Elements pane, and then it will be represented so that you would know what to change in your text editor or your CMS.
You can also use this to communicate any desired changes to a developer more clearly and specifically.
On the other side of the Elements pane, the CSS is the markup that governs how a website is laid out, and the style elements of this particular HTML element.
Here you can change the color of certain elements, certain CSS rules on and off, or even change them.
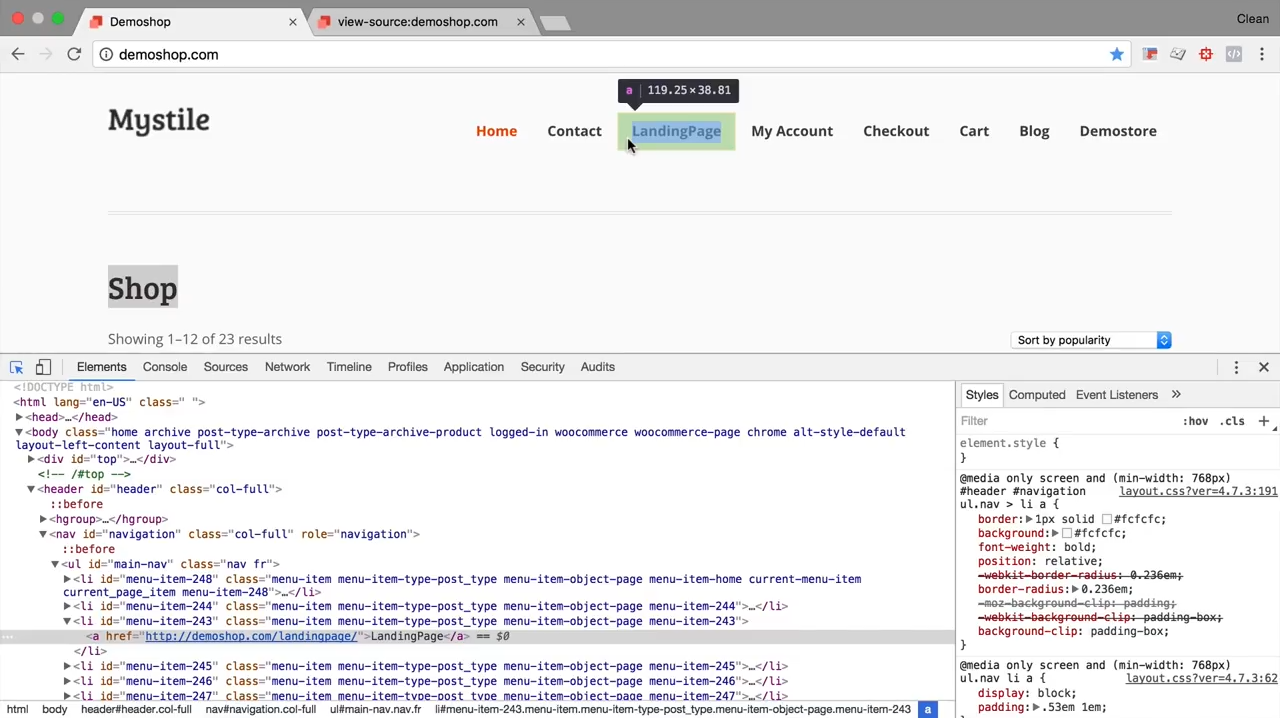
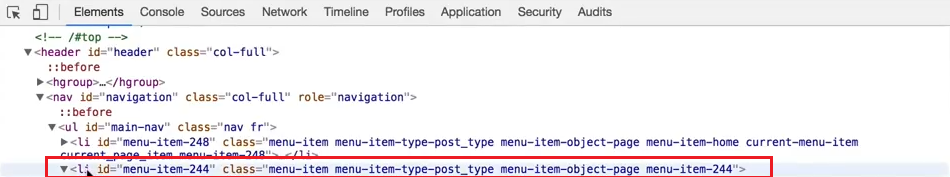
I use this pane very often once I want to identify a given element and see how it is marked up in the HTML itself. So for example, if I wanted to build in any kind of tracking on this Contact button, I would like to see how it is marked up.
This is a list element with the ID menu-item-244, which I can use in Google Tag Manager, for example, to identify it uniquely on our page.
I also use this to communicate any kind of changes that I want to a developer and be able to tell him exactly where I want to have something changed. It is very powerful.
The third use case would be for conversion rate optimization. So if I wanted to change an element in an A/B test, I would test it out beforehand in this overview panel.
Then I’ll know what to change in my A/B testing tools, such as Google Optimize.
One other great piece of information is down here, the actual Selector list.
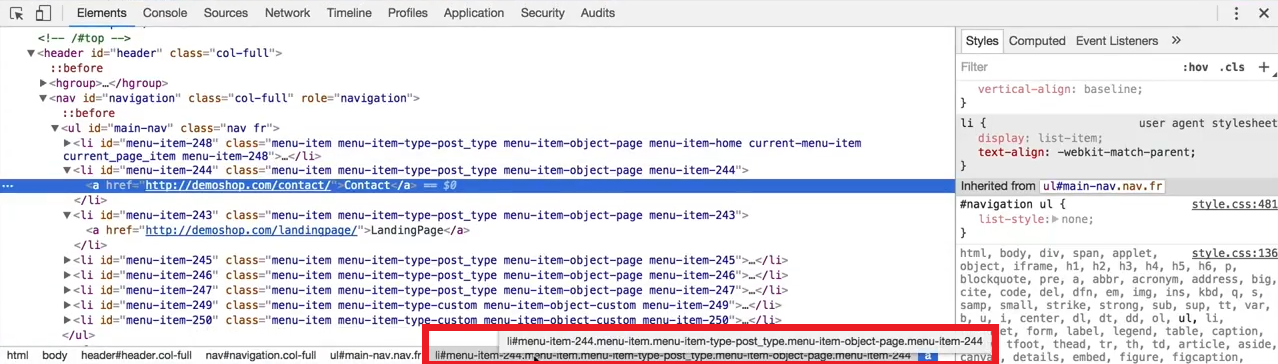
The Selector list gives you the information on how you can select it via CSS, which can also be used in Google Tag Manager with the CSS Selector.
Toggle Device Tool Bar
The Toggle device toolbar puts your browser into a special state that lets you test the website on different screens if it is responsive.

Once you click on the Toggle device toolbar, you will see the Responsive button appear on your screen.
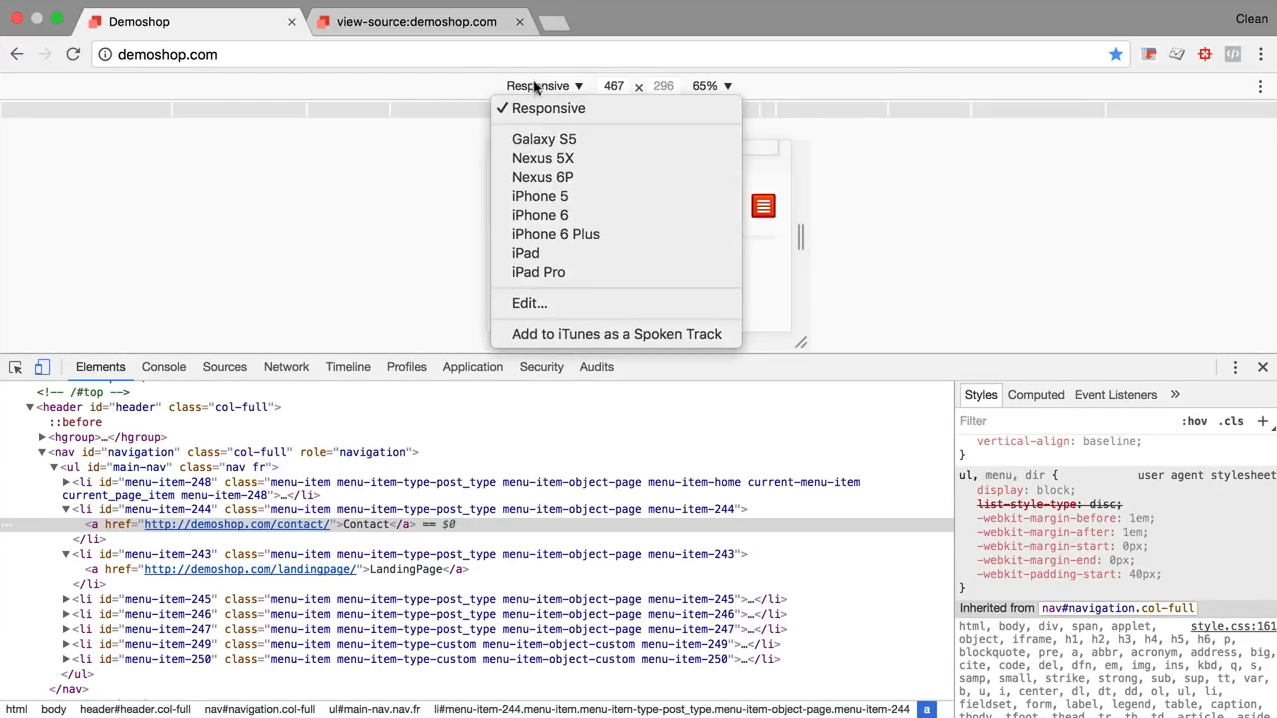
The Toggle device toolbar also lets you choose different devices to see how your website looks on this particular device. There’s also a function to connect Google Chrome Developer Tools to a mobile device.
JavaScript Console
All right, let’s move on to the next panel, which is the JavaScript Console.
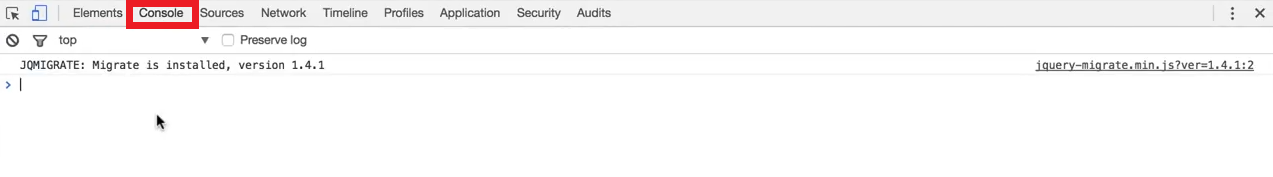
The JavaScript console is a great tool, especially if you work with tracking. I use this often to look up certain variables, such as the Data Layer, and see what the current state of this variable holds.
Now, the JavaScript console is our direct access to the JavaScript runtime environment. It can give us a lot of information. We can even instruct our codes to log out certain information, to make it more visible.
On this browser, I have an extension installed called the GA Debugger and once I activate it, it’s gonna reload the page.

🚨 Note: Besides GA Debugger we also recommend using these 12 Essential Analytics Chrome Extensions.
And now, we have the JavaScript console filled with a lot of Debug information from our Google Analytics implementation.
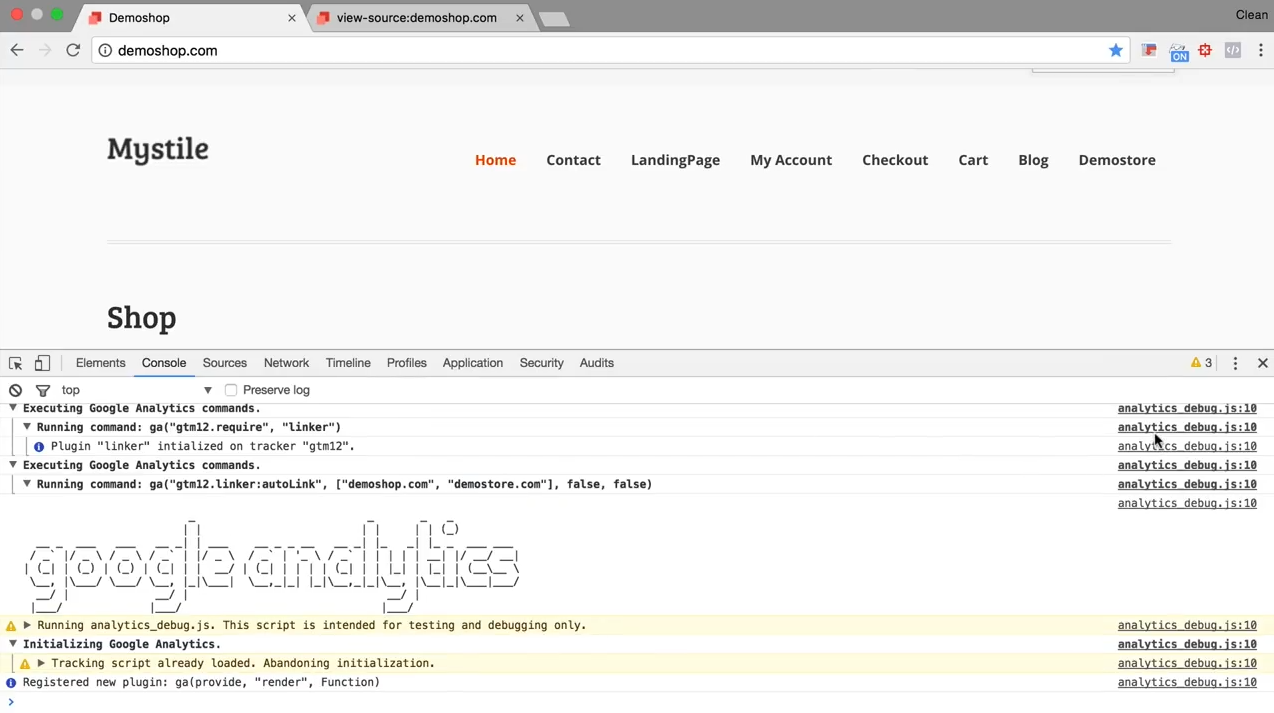
And we can see what data was sent over, and what hit type, and so on. This lets me easily identify any kind of problems if there are any.
The JavaScript console is also great for errors. The Console panel will flag any errors, so they’ll be very visible if you scroll through the log.

In this example, there was something called that is not available.
If you want to see where this error occurred, there’s a link in the log entry that you can click. Once you do this, you can head over to the Sources panel to debug the problem.
🚨 Note: Chrome DevTools now features an AI assistant Gemini, accessible through the AI Assistance panel. Gemini aids in debugging CSS, network requests, source files, and performance traces, helping marketers understand and resolve issues more efficiently.
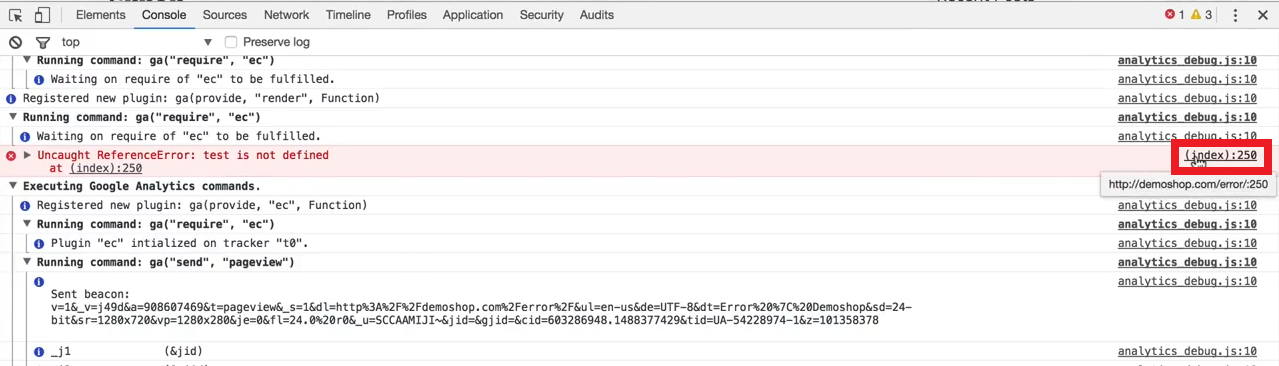
Sources
In the Sources panel, you can see all the different files that were downloaded during the load process of your website.
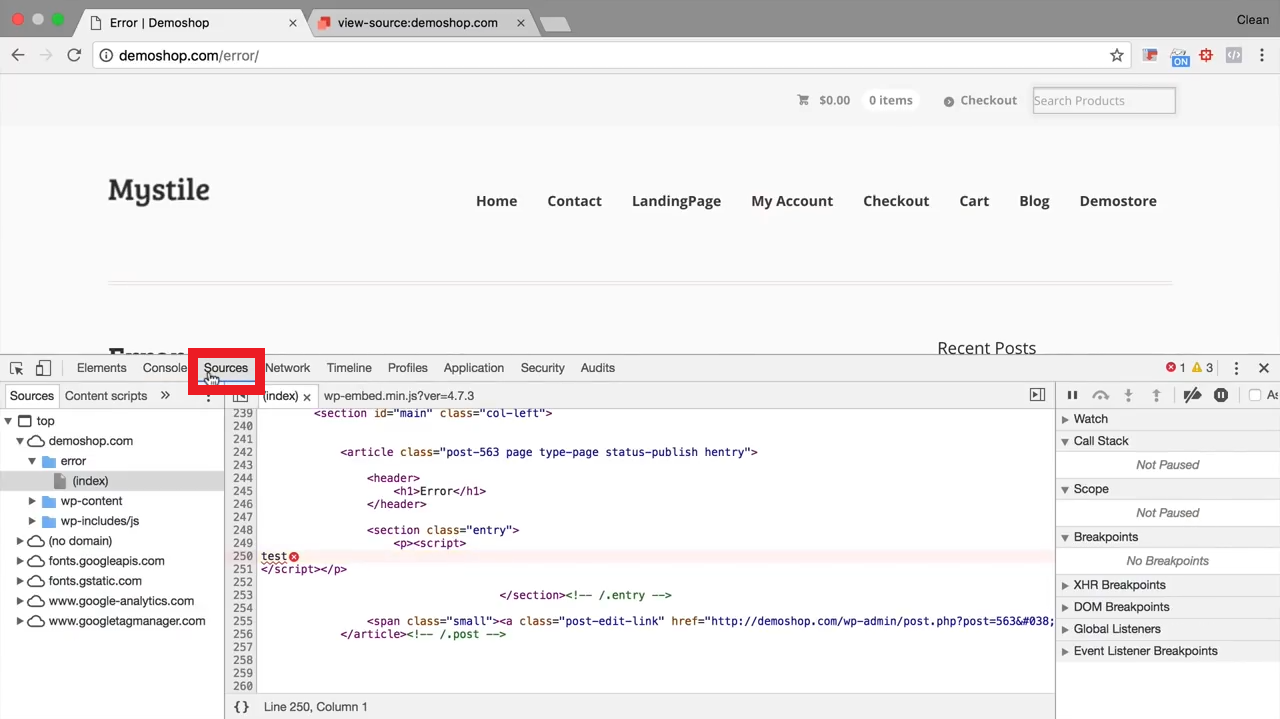
You can open certain files and read their markup to identify any errors.
For example, right here, we can see where the error originated, and I could change that in my markup.

A variable was called that is undefined.
Now, there are many different other JavaScript functionalities to debug this. So, for example, you can set breakpoints.
For you, it might just be important to look at your Console and see if any errors are occurring and how they originate.
Network
Next, let’s move on to the Network panel.
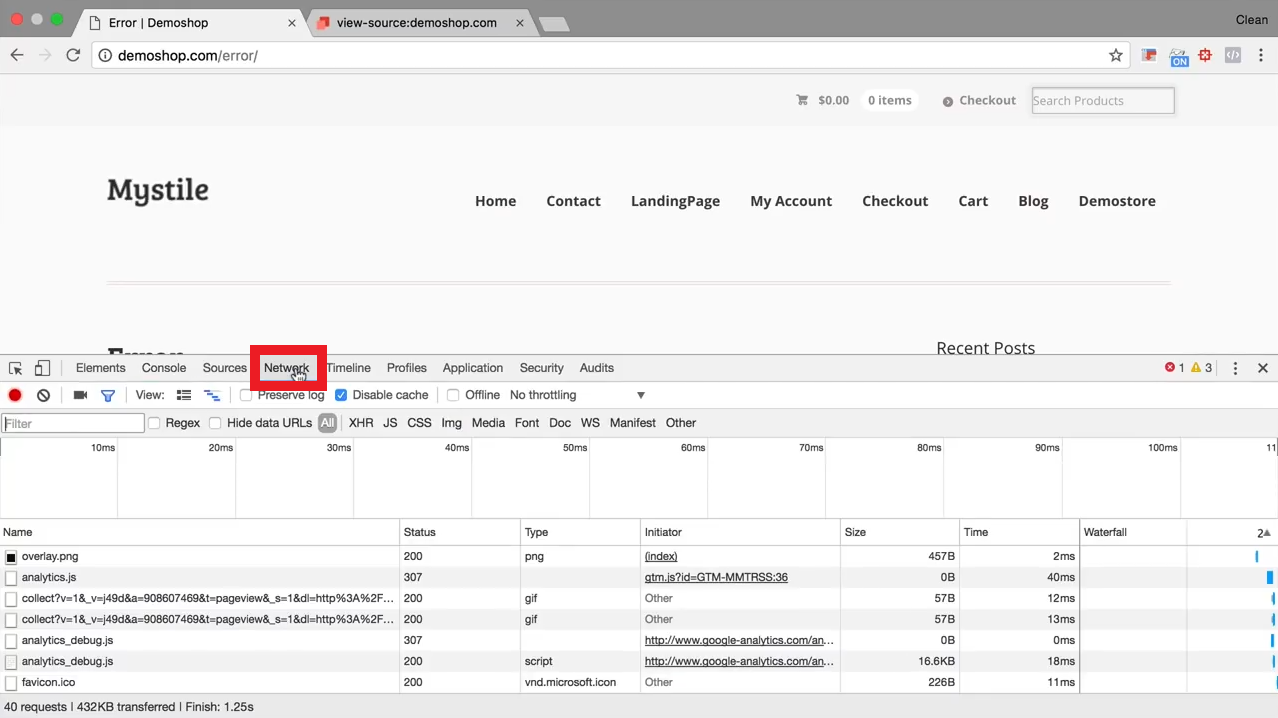
Now, once we reload this page, we see up here that there’s a timeline that develops.
We can mark within that timeline a given point and see what page loaded, or what part of the page loaded, during that time.

So this was the actual document. The HTML has loaded at the beginning.
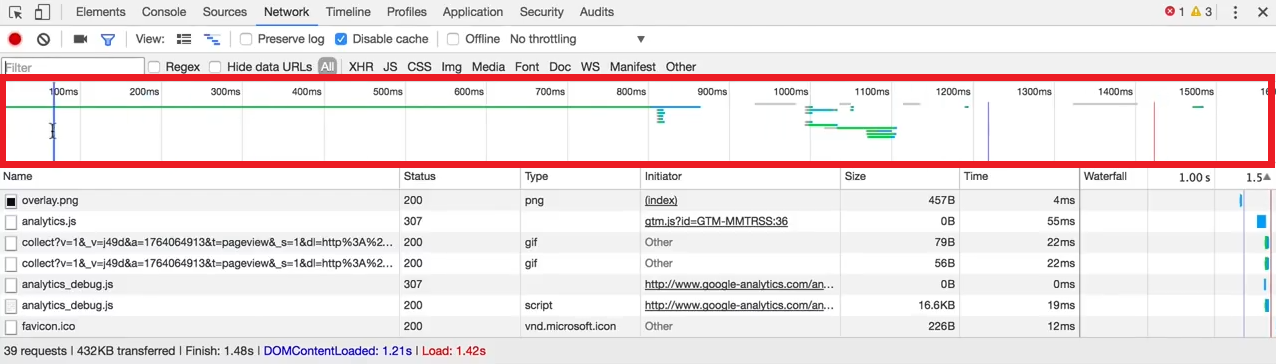
Let’s check another given point within the timeline.
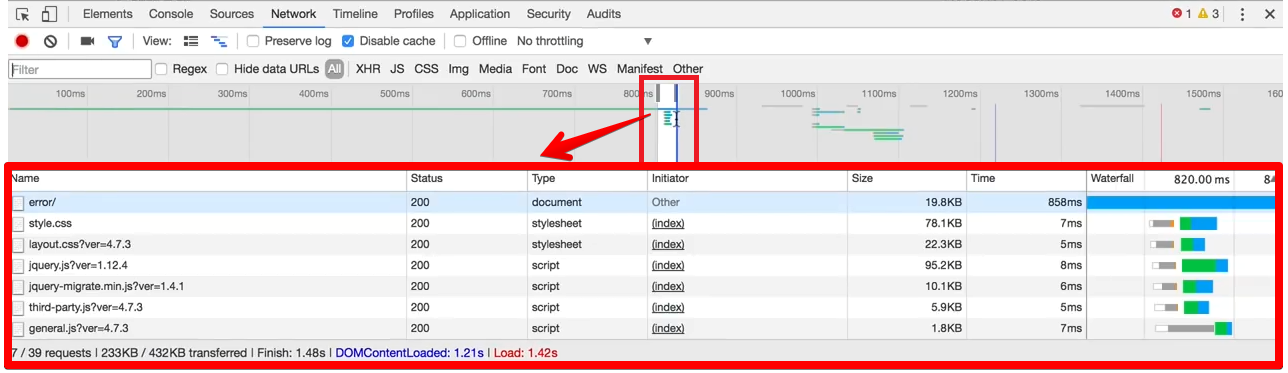
And we see that, at that point, the CSS, a jQuery file, and some other JavaScript had loaded.
This is especially great for SEO folks who want to optimize their website for speed. Here, you can see the markup decides when each element and each file of your website is loaded. This way, you could optimize accordingly and see any kind of bigger files that take a long time.
For example, the file analytics.js takes a bit of time until we get a response and can proceed.

This is also particularly great if you want to see one of the other requests that gets sent from your browser to a server.
So, for example, what is interesting for us, is if we have a Google Analytics code firing, is there a collect request?

It sends over the hidden image file here, and we can read a lot of information.
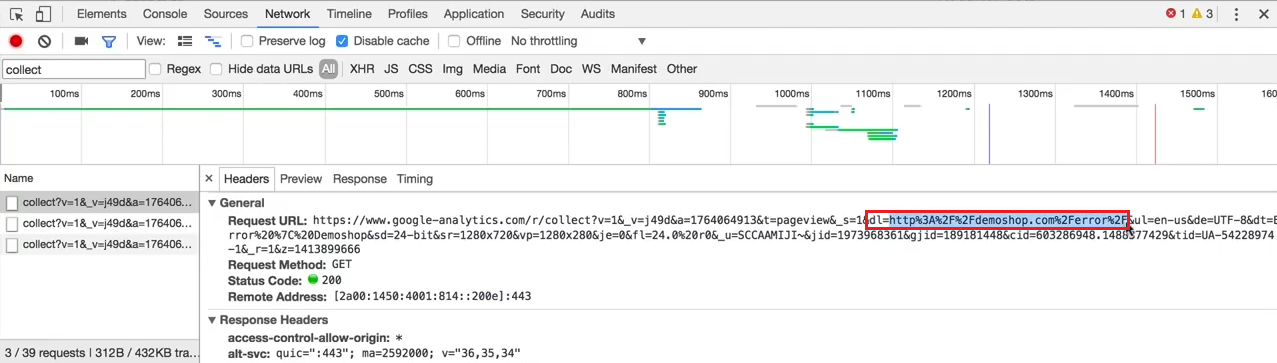
Click on the hidden image file and you can see the Request URL among the other information.
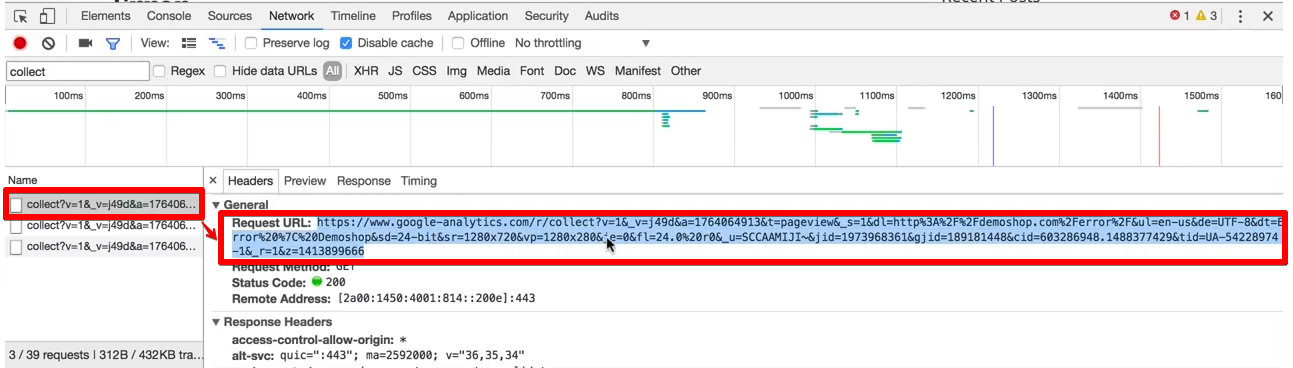
The Request URL has all the different parameters that let the Google Analytics measurement protocol translate it into an actual Google Analytics hit.
Here we have DL, which represents your page path.
You can also find the SR, which represents the resolution of the display.

The Network panel will also show your Client ID, a unique identifier used by Google Analytics

And finally, we have the Google Analytics ID, to which this request belongs.
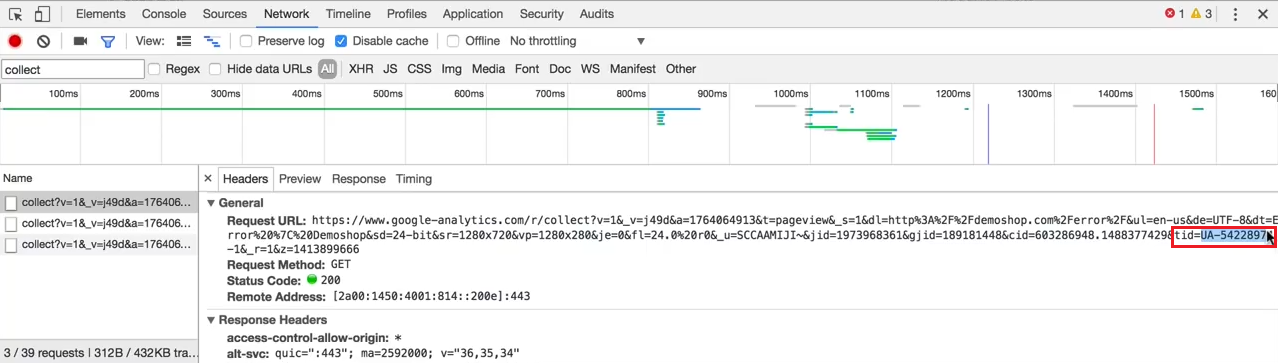
With all of these, we can see a lot of great information about how a request was sent.
We have the Headers right here, and we can see the Status Code of what information was sent.

A little bit cumbersome to figure out. I usually go with the console request here and let it dissect within the JavaScript console.
But if you wanna get more into the nitty-gritty, you can certainly use this Network tab to dissect your requests.
🚨 Note: The Performance panel has been updated to provide detailed insights into Core Web Vitals, including metrics like Largest Contentful Paint (LCP) and Interaction to Next Paint (INP).
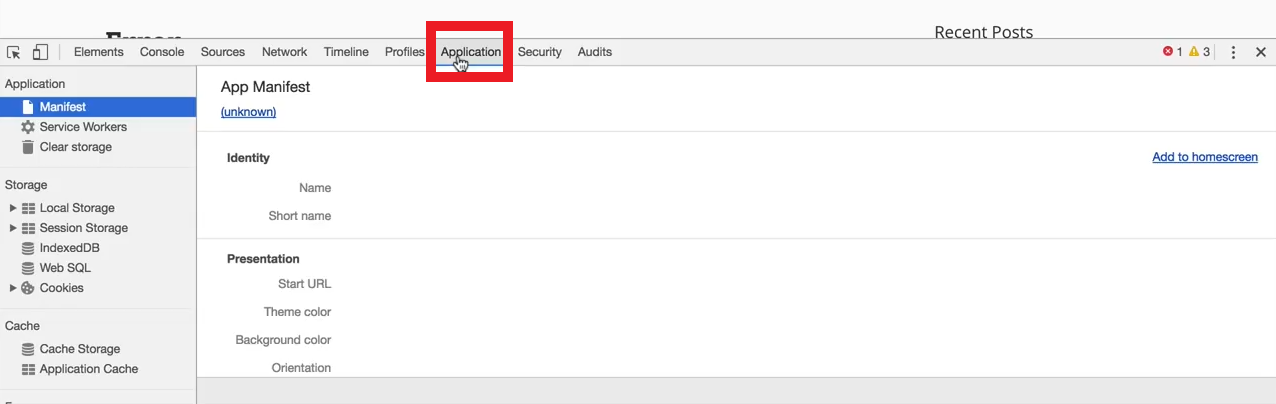
Application
For this guide, we’ll skip over the Timeline and the Profiles panels. These are more advanced functionalities for developers that you won’t need as a marketer.
Instead, I’ll go into the Application tab, just to show you a little bit more of what you can do.
In the Application tab, you can see more interesting information, such as the storage and the cache that have been created during the page load of your website.
The interesting part for people who do any kind of tracking(especially marketers) is the Cookies.
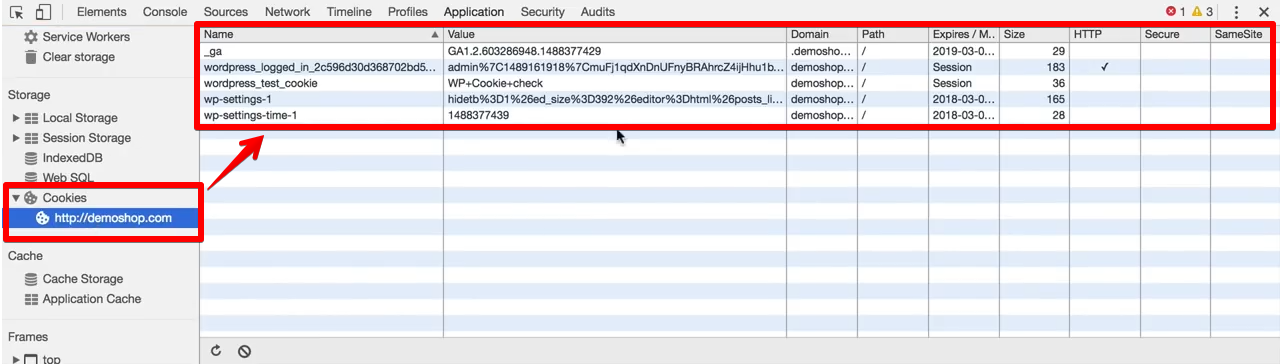
So you can see what Cookies were set on the browser. You can go ahead and see which Cookie was set, and you can also delete them.
This can be quite important if you want to reset the user identification of Google Analytics, for example. You can also clear all your Cookies right away, and, henceforth not Cookied anymore. And you can see, again, how Cookies are built up from a fresh user.
We also have the Local Storage and the Session Storage. These will get more important once HTML5 gets used more and more, instead of Cookies.
Summary
So there you have it. This is how you can use the Chrome Developer Tools as a marketer.
We went through the functionalities of some of the Chrome Developer Tools, which will help you examine the inner workings of your website.
It’s a great toolset for looking under the hood and understanding the more technical bits of digital marketing.
For more Chrome Developer Tools information, check Scraping Data with Chrome Developer Tools + GTM.
I hope you found this post useful! Let me know if you have any questions below in the comments.

Subscribe & Get our FREE GTM for Beginners Course...


")