
Last Modified on March 26, 2025
Total users, active users, new users, returning users, sessions, and the list goes on… so many metrics to look at.
No wonder you can become confused quickly when it comes to understanding the difference between all these metrics and dimensions.

Master the basics with our FREE GA4 Course for Beginners
Besides, what we might think of as a metric can easily differ in terms of how it is defined by a specific tool. So, to have a meaningful analysis, we need to understand what a metric means!
Visitors are often one of the most basic and important metrics used in web analytics to measure the performance of your site.
In this guide, we are going to dive deeper specifically into Google Analytics unique visitors and cover the following topics:
- What are Unique Visitors in Google Analytics 4?
- How Google Analytics 4 Tracks Unique Visitors
- Where to Find Unique Users in GA4
- Best Practices for Using Unique Visitors Data
- Limitations of Unique Users in GA4
What are Unique Visitors in Google Analytics 4?
Visitors are simply people who visit your website/app on a device. A unique visitor is a person who is counted once and can visit your website multiple times. This is what makes them unique because we are not counting them more than once.
But what if the visitor has two or more devices? This is where things get interesting, but more on that later.
In Google Analytics, there is no ‘unique visitor’ metric per se. Instead, there are Total users and Active users that follow a similar concept, albeit with some differences.
Google defines Total users as unique users who trigger any event on the site during a specific date range. An event can only be triggered when its criteria are met.
However, a basic event like page view, once triggered, will lead to a unique user being registered.
But, any custom events you set up will have criteria that depend on your business and the trigger conditions, e.g., trigger ‘sign up’ when a form is successfully submitted.
Active users are different in that they have engaged with your website/app during a specified date range.
So, when are they considered engaged? When they have engaged sessions or when GA4 collects any of the following:
- The first_visit event or engagement_time_msec parameter from the websites
- The first_open event or engagement_time_msec parameter from android apps
- The first_open or user_engagement event (not a parameter this time) from iOS apps
So, if you’re thinking about what is an engaged session or user engagement event, we don’t blame you. See, that’s why it all gets confusing.
A user engagement event is triggered when a webpage is in focus or an app is in the foreground for at least one second.
Well, that’s what the official Google documentation says. However, in experiments online, it has been observed that the user_engagement event fires before you’re about to browse to the next page or, in some cases, have stayed on the same page for more than 10 seconds.
But an engaged session is measured differently. It happens when a user meets any of the following conditions:
- The session lasts 10 seconds or longer
- Triggers one or more conversion events
- Views 2 or more pages
So, as per the above definition, wouldn’t pretty much all users be active at one point? Yes, and that’s why the numbers for both metrics are generally quite close! For instance, look at this data:
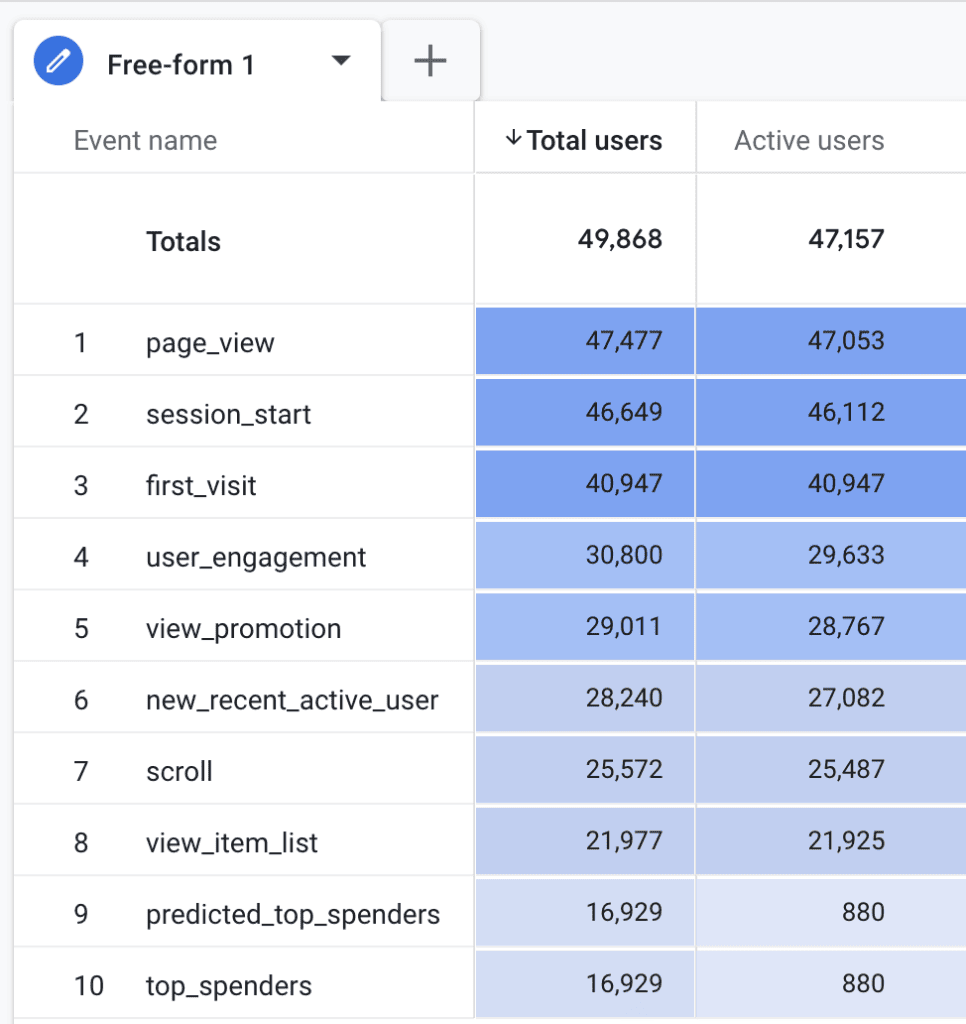
In most standard reports, you will see that Google favors Active users, but you can use pretty much either of them as the numbers are already an approximation.
“Wait a minute. Do you mean the user counts I see are not true?!” If you have a similar reaction, we understand. More on that in the limitations section.
But to give some context, here are some other major reasons why you might see differences in total and active users:
- When a user starts a session but doesn’t do any engagement, then it will show up in Total users but not Active users. The same goes for any session restarts with no engagement. Generally, session_start is one of the first events to fire, but it doesn’t necessarily mean that the user who started the session was also active. Another example is when users start a session and then immediately bounce.
- Total users are calculated based on when they first appeared in the selected date range. Whereas Active users have to meet certain criteria to be counted in the same date range, i.e., a user with a mere page_view will be counted under Total users but not as ‘active.’
- Active users are a ‘subset’ of Total users, so generally you would see them being less than total and/or equal to them depending on the event you’re looking at.
- Consent, when denied, blocks user_engagement events, but the page_view is sent. GA4 models data when consent is denied to estimate user counts, but since engagement is not measured, there won’t be active users.
These are only some of the reasons why it can differ, and there could be more depending on the site and how GA4’s tracking is configured, etc.
The other types of users that are available in GA4 are:
- New users – Users who visit your website for the first time and have first_visit event.
- Returning users – Users who are returning to your website after their first visit; this could be the 2nd or 10th time.
Are they unique, though? In the date range you select, they are, but here’s an important nuance. The same user can be counted in both metrics.
For instance, you visit a site on March 2nd and then again on the 7th. If your date range is March 1st to March 10th, then you will be counted in the new and the returning user metrics.
Just one more thing before we move on to the next topic. You may see Active users being referred to simply as ‘Users’ – don’t panic! It’s not another metric for users.
How Google Analytics 4 Tracks Unique Visitors
Google uses something called ‘client ID’, aka CID/cid, which is stored in a visitor’s browser cookie when they visit your site. This unique identifier is what it refers to as a ‘visitor.’
This is stored in a first-party cookie called ‘_ga’ that assigns an identifier to every new session so it can distinguish if it was initiated by the same user or a new/different one.
By default, it has a 2-year expiration time, but you can modify these settings in Google Analytics’ interface to comply with any privacy regulations where you operate.
Currently, the max time is 25 months, and on the lower end, you have 1 month, 1 week, 1 day, 1 hour, and 0 (expires as soon as the browser session ends).
Not to mention, certain pro-privacy browsers set their own limitations on the life of these cookies that might be much lower than the default 2-year time frame.
For instance, on iOS browsers, this time frame can be limited to 7 days and can go as low as 24 hours. Now, that might inflate your user count, but the person behind it is the same.
So, this randomly generated client ID is then tied to all the actions a user takes on your site and helps to identify that it’s the same person.
It looks something like this: 1242591205.1741664478 – pretty random, right? The first part is random, whereas the second part, i.e., after the period, is the creation time of the client ID in UNIX format.
Remember, this isn’t a user ID – that is a different thing altogether! Client ID cannot track users across different browsers, devices, etc. but a user ID can.
Also, if you delete the _ga cookie or your browser kills it early, the client ID goes with it. So, the next time you visit the site, you’ll be counted as a ‘new’ user.
It’s also limited when it comes to the likes of ad blockers; if cookies are not allowed to be stored, a user won’t be tracked.
Where to Find Unique Users in GA4
You can find them pretty much everywhere where you see a user metric, which means they are unique users.
While Google Analytics 4 favors Active users, it’s a good idea to look at Total users if you are interested in finding the totals, and you can also look at other metrics like engagement rate, average session duration, etc. to get more context.
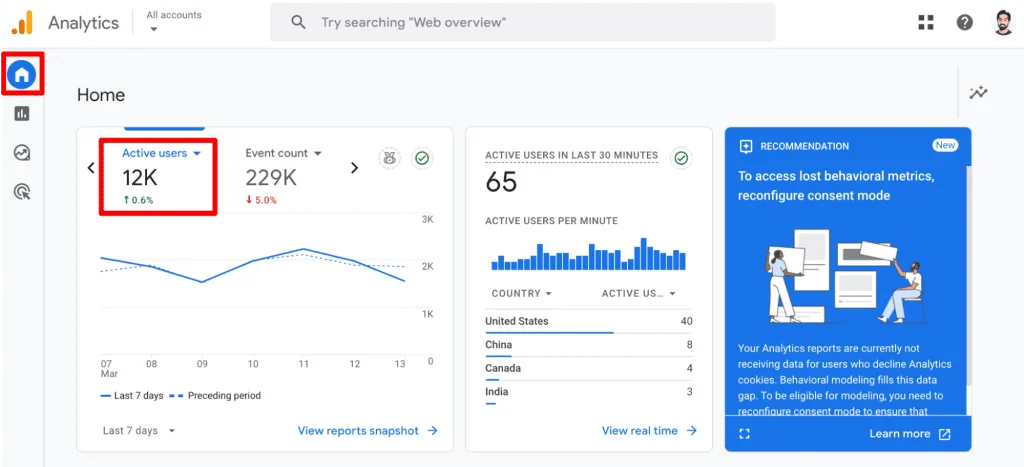
Here are some places where you can find them in ‘Reports.’
1. Home – Active users compared to the previous period.
2. Reports → Reports snapshot – Active and New users.

The snapshot also shows some quick insights like what countries Active users are from in the last 30 minutes and what sources are bringing in New users, along with a few others.
3. Reports → Realtime overview – Active users.

4. Reports → Realtime pages – Active users.
Similar to the Realtime overview, but you can see a list of pages where Active users have been in the last 30 minutes. Anyone getting Universal Analytics nostalgia?

5. Acquisition → Overview cards – Active and New users.
6. User acquisition – Total, New, and Returning users.
7. User acquisition cohorts – New users.
8. Engagement → Overview cards – Active users.
9. Events – Total users.
10. Pages and Screens – Active users.
11. Landing pages – Active and New users.
12. eCommerce – Purchase and Checkout journey → Active users.
13. Retention – New and Returning users.
14. User attributes → Overview cards – Active users.
15. User attributes → Demographic details – Active and New users.
16. User attributes → Audiences – New and Total users.
17. Tech → Overview cards – Active users.
18. Tech → Tech details – Active and New users.
These are all built-in reports you see in GA4. With the right permissions, you can edit some of these reports and change the column order and/or what user metrics you want to see.
In ‘Explore’ aka explorations, you can find all the user metrics and add to your free form reports as needed.
Where you cannot use a specific user metric, it will be grayed out/disabled, so you won’t be able to add it to your exploration.

Best Practices for Using Unique Visitors Data
Some best practices that can help you make the most out of your user data in Google Analytics 4 include:
- Correct Tracking
If you have installed GA4 directly on the website and/or via plug-in as well as with GTM, then you might have duplication.
While it generally causes duplicate events, it’s still an issue where you end up having more data for a single user, e.g., 2 page views, 2 add to carts, etc. This is not very helpful if your end goal is to analyze what actions a user is taking on the site.
There could be other reasons for duplicate events, therefore, it’s important that your tracking setup is correct.
It’s a good idea to have a process to make any changes and review the setup periodically to ensure all is well!
- Monitor Data
It’s good to monitor data regularly for any anomalies, i.e., dips or spikes, so you can look into any issues promptly.
Creating custom insights is a good way to stay on top of important metrics, and you can turn on email notifications as well, so even if you don’t check the data regularly, you’re aware of any big changes.
- Avoid Summing Up Users
Users as a metric is already aggregated like engagement rate – Avg. engagement time per active user, Views per active users, etc., meaning it’s already calculated in the back end.
So, if you try to add up/sum up users for different dimensions, your numbers won’t be accurate.
Let’s say you have a user who visited on Friday and then again on Sunday, and you’re looking at the data for each day in the last 7 days.
The same user will be counted separately on both days. So, if you add up the values, it will say 2; whereas actually you only had 1 user.
While GA4 would only count it as one user for that time range, if you add up your users for separate days, your numbers will be incorrect.
So, unless you’re sure that you’re taking unique user counts with a dimension like user_pseudo_id that’s available in tools like BigQuery, the summation is not a good idea.
- Segment Unique Visitors
For more meaningful insights, segmenting your users by different dimensions can be quite helpful.
For instance, how do users from different traffic sources behave when it comes to engagement and/or conversions? What devices are your users on generally, and where are they located?
What type of content do they consume, and does it have any bearing on conversions? You won’t be able to answer a lot of these questions without using segments.
This would help you understand what type of users are most valuable to achieve your business goals and how you can further optimize their experience.
- Behavior of New vs Returning Users
For starters, you shouldn’t try to sum up the New and Returning users to match with the Total/Active users because people who come in as ‘new’ are also counted as ‘returning’ as well, depending on the date range you select.
So you’ll end up counting the same user twice. Therefore, it’s better to treat them separately. Understanding the behavior of these users can help you develop relevant strategies.
For instance, if you have a lot of new users but they don’t seem to be coming back a lot, then it means your retention strategies need work, e.g., email campaigns, remarketing ads, personalization, etc.
If the number of returning users is higher than the number of new users, your acquisition of new users might be weak, but your retention is pretty good and signals customer loyalty. You can further optimize their experience, provide incentives, and/or upsell.
You might also want to keep an eye on them in case there are any dips pointing toward a potential issue with user experience, content fatigue, or simply a slow website.
The goal is to convert your new users into repeat visitors/customers so you’re not spending a lot on acquisition all the time.
These aren’t the only best practices, but they are just to give you an idea about the possibilities. It is not just about finding the data but also knowing how to use it.
For instance, knowing the right user counts and conversions, etc. can help you plan for AB testing better and make sure the results of your tests are reliable.
Perhaps the most important of best practices would be knowing the limitations of unique visitor data so that the insights you communicate or the decisions that are based on it are on solid ground.
Limitations of Unique Users in GA4
All these user metrics are not without their issues. Once you understand what they are, you’ll have a better context of what’s happening with them.
- Counts are Approximations – Remember how we mentioned that these counts are approximations? It’s because Google uses an algorithm called HyperLogLog++ (HLL++) to estimate users (except New users). This is to enhance the performance, provide a high estimation accuracy, lower the error bounds, and also save on costs. You can read more about it here.
- Privacy and Consent – Browsers that limit tracking, delete cookies early, and are generally more privacy friendly, Ad blockers that don’t allow any tracking, and consent mode can affect the user counts. If that’s what users want, we should respect their choices and not try sneaky methods to track them on our website.
- Bot/Spam Traffic – While GA4 is generally good at filtering bot traffic, there are cases where you will see this type of traffic inflating your numbers. One such example is a site like https://urlumbrella.com/ that can send bot traffic to your site.
These services are unethical, and we don’t encourage or endorse them in any way, but sometimes they’ll send traffic to your site themselves as well to ‘advertise’ what they can do for you. But what’s the point of such traffic if it’s not real?
If you see any such spikes that are not expected, then take time to investigate and work with your team to exclude them from your analysis. - Pre-Calculated – We already touched on this and how we shouldn’t generally sum up users in different dimensions as it won’t show the true picture of users. This means that in GA4 or tools like Looker Studio, these metrics might be limited, but you can use BigQuery to sum them up using user_pseudo_id, as it counts that user only once.
- Cross-Device/Browser Gaps – Users in GA4 are not tracked across devices or different browsers. For instance, if a family uses a shared computer, they’ll all be counted as one user (theoretically), yet 3-4 family members are using the computer.
Another common scenario is the same user visiting on a laptop and later on via mobile (or even a tablet). GA4 will treat them as 2 different users even though, in reality, it’s just one person. Google Signals and User ID (if implemented) can help, but there will always be some gaps. - Sampling and Thresholding – Another issue that you can encounter in GA4’s interface is sampling and thresholding which won’t show you the full picture of your user metrics. Again, the only way to get around them is generally analyzing your data in BigQuery, but if that’s not a choice, then you’ll have to use simple reports (not multiple dimensions, segments, and filters) with a shorter date range.
- Data Processing Time – GA4 can take 24-48 hours to process the data, so if you’re looking at today’s or yesterday’s data, chances are it’s not yet completely processed. This will show you counts that are different and might be updated later on. It shouldn’t be a huge issue unless you need to have accurate data right away.
This sums up some major limitations you can face when working with unique visitors in GA4. As long as you are aware of these nuances, you’ll be able to navigate them better.
Summary
This post covered a lot about unique visitors aka users in GA4. We expanded and built upon any knowledge you may have had, and hopefully clarified any misunderstandings or misconceptions.
We learned about different types of users in GA4 and how they are defined, noting that there is quite a bit of nuance in terms of what is considered an ‘Active user.’
After that, we learned about 18 places/reports in GA4 where we can find different user metrics in the standard reports.
But if you want to customize things a bit more, then you can edit the existing reports to add or move the metric columns or if it’s a one-off then you can use explorations.
When analyzing users, it’s helpful to get more context with the user segments. We looked at them and some other best practices, like how we shouldn’t sum up users across different dimensions and how we should look at the behavior of new vs returning users.
There, we also learned why adding up new and returning users won’t equal the total users. Finally, we learned about some limitations, so when we use user data, we are aware of the issues so we can deal with them better.
Since we talked a lot about what an engaged user is and also the user_engagement event, you can learn more about it in our detailed post, GA4 User Engagement Made Visual and Simple, to understand it even better.
So, how do you use your unique visitor’s data in GA4? What are the challenges you face, and how do you deal with them? Let us and our readers know in the comments below!
Master the basics with our FREE GA4 Course for Beginners


")