
Last Modified on January 7, 2025
Have you heard about the amazing, new features of Google Analytics 4? Well, you are not alone! A lot of people are migrating to it with time and enjoying its flexibility.
Among these features is the Google Analytics 4 DebugView, which is very useful as it allows you to debug real-time events and ensure that you are tracking what you want to.
The DebugView does not exist in Universal Analytics per se, but the real-time reports pretty much do the job for you in terms of testing your tracking implementations.
However, one area in which UA’s real-time reports are quite limited is the Enhanced Ecommerce for which you normally have to wait till you get data in the actual reports. GA4’s DebugView solves this issue along with many others!
In this blog post, we will cover important aspects of GA4’s DebugView and how you can make the most out of it. Precisely, we will be going over the following topics:
- What is GA4’s DebugView and Why Use it?
- How to Enable GA4’s DebugView?
- Overview of GA4 DebugView’s User Interface
- What are the Limitations of the GA4 Debugger?
Ready to learn more about GA4 DebugView? Let’s do it!
What is GA4’s DebugView and Why Use it?
DebugView is a feature of GA4 that allows you to monitor the events hapening on your site in real-time.
This information comes along with user properties which are the attributes of your groups of users such as language or geographic locations.
DebugView is primarily used for troubleshooting your analytics implementations. This feature must be enabled to work.
The DebugView is similar to the real-time reports in UA. It allows you to monitor incoming events and their parameters from a specific device or a web browser for troubleshooting and debugging tracking issues.
However, it first has to be enabled on your device or browser, so that it can receive the events in GA4’s interface while you’re testing your implementations or debugging issues.
In this regard, having a specific device or web browser can be helpful as this will ensure that it is you who is sending those events.
Similarly, it will also help identify if the issue is device-related or browser-specific as you can try using different devices/browsers.
Another benefit of using DebugView is that the testing data you send to your analytics account is filtered out and separated from other devices or browsers that don’t have the debugger enabled. Therefore, you have less polluted data as your numbers are not skewed.
It is also important to reiterate that testing your tracking implementations before going live is always a good practice and highly recommended.
Luckily, GA4’s debugger helps you do that easily!
Compared to UA’s real-time reports, GA4 DebugView provides you with granular data on the events which can help you quickly identify any issues with your events and/or parameters.
GA4 debugger also saves time when it comes to Enhanced Ecommerce tracking as you do not have to wait for the data to show up in the standard reports before you can spot any issues with the data or your tracking. Instead, you can keep checking the incoming data.
Lastly, the GA4 DebugView can show you activity for up to 30 mins. Moreover, you can also pause the events report if you want to investigate something at a granular level.
On the other hand, UA’s real-time reports only look at the past 5 mins of activity and you cannot pause them.
How to Enable GA4’s DebugView?
Before you do any troubleshooting, the first step is to enable your GA4’s DebugView, so that you can start seeing the data flowing into GA4’s interface. There are three ways to enable the debugger:
- GA Debugger Chrome Extension
- Google Tag Manager’s Preview Mode
- Send Debug Event Parameter with GTM
Let’s see how you can use these three methods to enable DebugView so that you can start debugging!
GA Debugger Chrome Extension
A quick and easy way to enable debugging mode in GA4 is to use the Google Analytics Debugger extension for Chrome provided by Google itself.
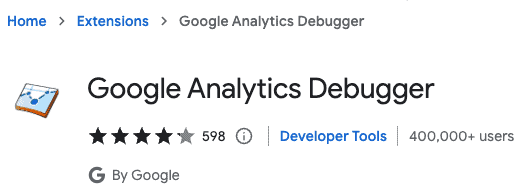
All you have to do is install it, toggle it on, and GA4’s DebugView will start receiving data as shown below:

There you go! You can now start interacting with your website and you will see the data flowing into your GA4’s DebugView.
This extension simply adds a parameter (_dbg) to the events being sent to GA4 to identify that this data should be separated in the DebugView rather than adding it to the general data GA4 receives.
Google Tag Manager’s Preview Mode
This might be one of the most common methods to enable GA4’s debugger to receive any testing data because you can easily access it by going into Google Tag Manager’s Preview mode.

At the backend, it works similarly to the Google Analytics Debugger Chrome extension by adding the _dbg parameter to the event.
On the surface, the method is different and used quite often when tagging solutions are being implemented on the website.
This is so as you would be checking whether the tags are being fired and then see if GA4 is also receiving the correct data.
Send Debug Event Parameter with GTM
This method is a bit more manual compared to the other two! Here, you have to send an additional event parameter with a GTM tag.
You can either send the additional parameter with the GA4 Configuration tag or any other specific tag that you want to debug. The former method will add the parameter to all the events whereas the latter will be specific to that one tag’s event.
🚨 Note: The GA4 configuration tag has been replaced with the new Google Tag.
Let’s have a look at how you would send this additional parameter with GA4’s Configuration tag (the tag that fires on all the pages).
Open your GA4 Configuration tag, navigate to the Fields to Set section → add debug_mode → set its value to true, and save.

Great! You have now enabled GA’s DebugView with the third method!
Next, you can move to your Google Analytics 4 account and go to DebugView to see what data you’re receiving as you interact with your website.
Let’s go into GA4 and see how the data flows into the DebugView user interface!
Overview of GA4 DebugView’s User Interface
At first glance, you might feel a little overwhelmed since a lot might be happening in DebugView’s interface. Thankfully, it’s not that complicated!
You can divide the interface into five sections with each section playing its part to give you the relevant information.
Debug Device
This shows how many devices are connected to the debug mode and lets you select the device you want to debug on. Moreover, it shows the selected device’s name, so that you know which one is sending the data to your Google Analytics 4 account.

Minutes Stream
The Minutes Stream is simply a minute-by-minute account of your interactions on the website in debug mode in the last 30 minutes.
The large blue circle shows the total count of live events in that minute whereas the small circles show the event count on that particular timestamp, which is 6 and 9 in this case.

You might have noticed that the circle around 6 is blue and green as compared to the completely blue circle around 9. You will learn more about this in the Seconds stream discussed below!
Seconds Stream
This is pretty much the center of attention because it lightens up every second with all the events.
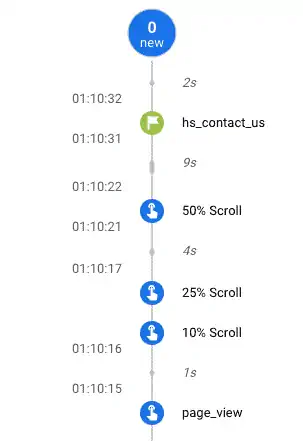
Here, you can see all the events flowing in as you interact with the website. Blue-colored events represent all the generic events, green-colored events with a flag show conversion events, and orange-colored events represent user events.
You can also click on these circles to view the event parameters and any user properties. For instance, if you click on the page_view event, as shown above, you will see the following data:

💡 Top Tip: If you click anywhere on the Seconds stream section, it will pause the events flowing in every second so you can stop and look at the details of different events.
Top Events
This section shows you the top events in the last 30 mins, the total event count, as well as the type of events that occurred (generic, conversion, and error events with an orange bug icon).
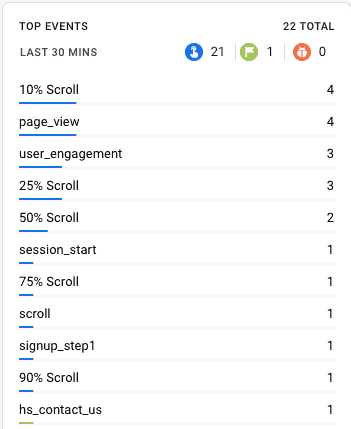
Clicking on any event will show its total event count as well as the parameters sent with it. You will also be able to see the timestamps.
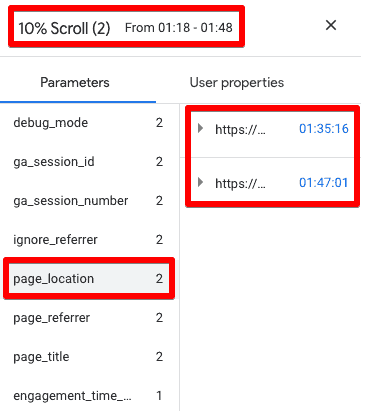
You can also drill down further and see more details on the parameters by clicking on any individual timestamp.

User Properties
The final section allows you to view any user properties that you have received in the last 30 minutes for the selected debug device. You can also click on the clock icon to see how the values have changed in the last 30 mins.
So, there it is! You now know how to navigate the GA4’s DebugView and here’s what the complete puzzle of five sections looks like:

Now that we have seen the good stuff, let’s see if this feature of GA4 has any limitations.
What are the Limitations of the GA4 Debugger?
As a debugger, it does a pretty good job and only a few minor limitations exist!
For instance, the time at which the events show up does not correspond to when they are fired. Instead, the time you see is the one when the event was received by GA4.
In addition to this, there have been occasional yet noticeable delays in the appearance of events and then suddenly all of them start flowing in. So, do not worry if you don’t see your Seconds stream light up right away!
Another potential issue is that if there are multiple people with the GA Debugger Chrome extension turned on the website, then you will see multiple devices in the Debug Device.
As a result, you will have to ensure that you’ve selected only your device to avoid seeing someone else’s interactions.
All in all, there are no major limitations that could stop you from using the debugger.
Common Issues and How to Fix Them
While DebugView is a powerful tool, you might encounter some issues:
- Device Not Detected: Ensure you’ve selected your device in the DebugView report.
- DebugMode Not Enabled: Ensure the “debug_mode: true” parameter is being sent to GA4.
- Extensions Blocking GA4: Some browser extensions, like ad blockers, can prevent GA4 from receiving data. Ensure they’re disabled or configured correctly.
Still can’t fix it? Consult with our guide to 11 ways to fix GA4 DebugView not working.
FAQ
What is GA4’s DebugView and why should I use it?
GA4 DebugView is a feature that allows you to monitor real-time events happening on your website. It provides granular data on events and user properties, making it easier to troubleshoot and debug tracking implementations. Using DebugView ensures that you are tracking the events you want accurately and helps identify issues with your tracking.
How do I enable GA4’s DebugView?
There are three ways to enable GA4’s DebugView:
1. GA Debugger Chrome Extension: Install the Google Analytics Debugger extension for Chrome and toggle it on. It adds a parameter to the events being sent to GA4 to separate them in the DebugView.
2. Google Tag Manager’s Preview Mode: Access Google Tag Manager’s Preview mode, which adds the _dbg parameter to events, similar to the Chrome extension.
3. Send Debug Event Parameter with GTM: Manually send an additional event parameter with a GTM tag. This can be done by adding the debug_mode parameter with a value of true to the GA4 Configuration tag or a specific tag you want to debug.
What are the limitations of the GA4 Debugger?
While GA4 Debugger is a powerful tool, it has a few limitations:
1. Events might not appear immediately as they are fired; there can be occasional delays.
2. The time displayed in DebugView corresponds to when the event was received by GA4, not when it was fired.
3. If multiple people have the GA Debugger Chrome extension turned on for the website, you might see multiple devices in the Debug Device section. Make sure to select your device to view your own interactions.
Summary
Debugging is an important part of analytics implementation and an amazing feature that Google has introduced in GA4 to make our lives easier.
No more waiting for the eCommerce data to show up in the standard reports before you can analyze and possibly fix any data or tracking issues!
If you’ve made it this far, then you know what is the DebugView in GA4, why you should use it, how you can enable it, and lastly, how to navigate the different sections of the GA4 debugger.
So, make sure that you use it before finalizing any implementations or trusting any data to avoid going down a slippery slope.
🚨 Note: If you’re missing GA4 event parameters from your reports, this guide will be able to help you out.
You can also learn about How to track events with GA4 and GTM and then use the DebugView to verify if your events are working as intended and much more.
Have you used Google Analytics 4 DebugView? How has it helped you as compared to Universal Analytics? Any new features you’d love to see in the debugger? Let us know all in the comments below!


")