Last Modified on November 1, 2024
At the time of writing this, there are thousands of analytics Chrome extensions in the Google Chrome Web Store.
Working out which ones will have an impact on your workflow is tough. That’s why we’ve put together a list of 11 Chrome extensions that you should use to gain insights and work smarter with Google Tag Manager and Google Analytics.
From debugging and viewing to enhancing your data, we’ve tested loads of them, and here are the top 11 I find that make my life easier and give me more insight:
- GTM Copy Paste
- PII Viewer
- GTM Variable Builder
- Google Tag Assistant
- GA Debugger
- Da Vinci Tools
- Page Analytics
- Tag Manager Injector
- GTM Sonar
- DataSlayer
- WASP.inspector
Let’s dive in!
1. GTM Copy Paste Extension
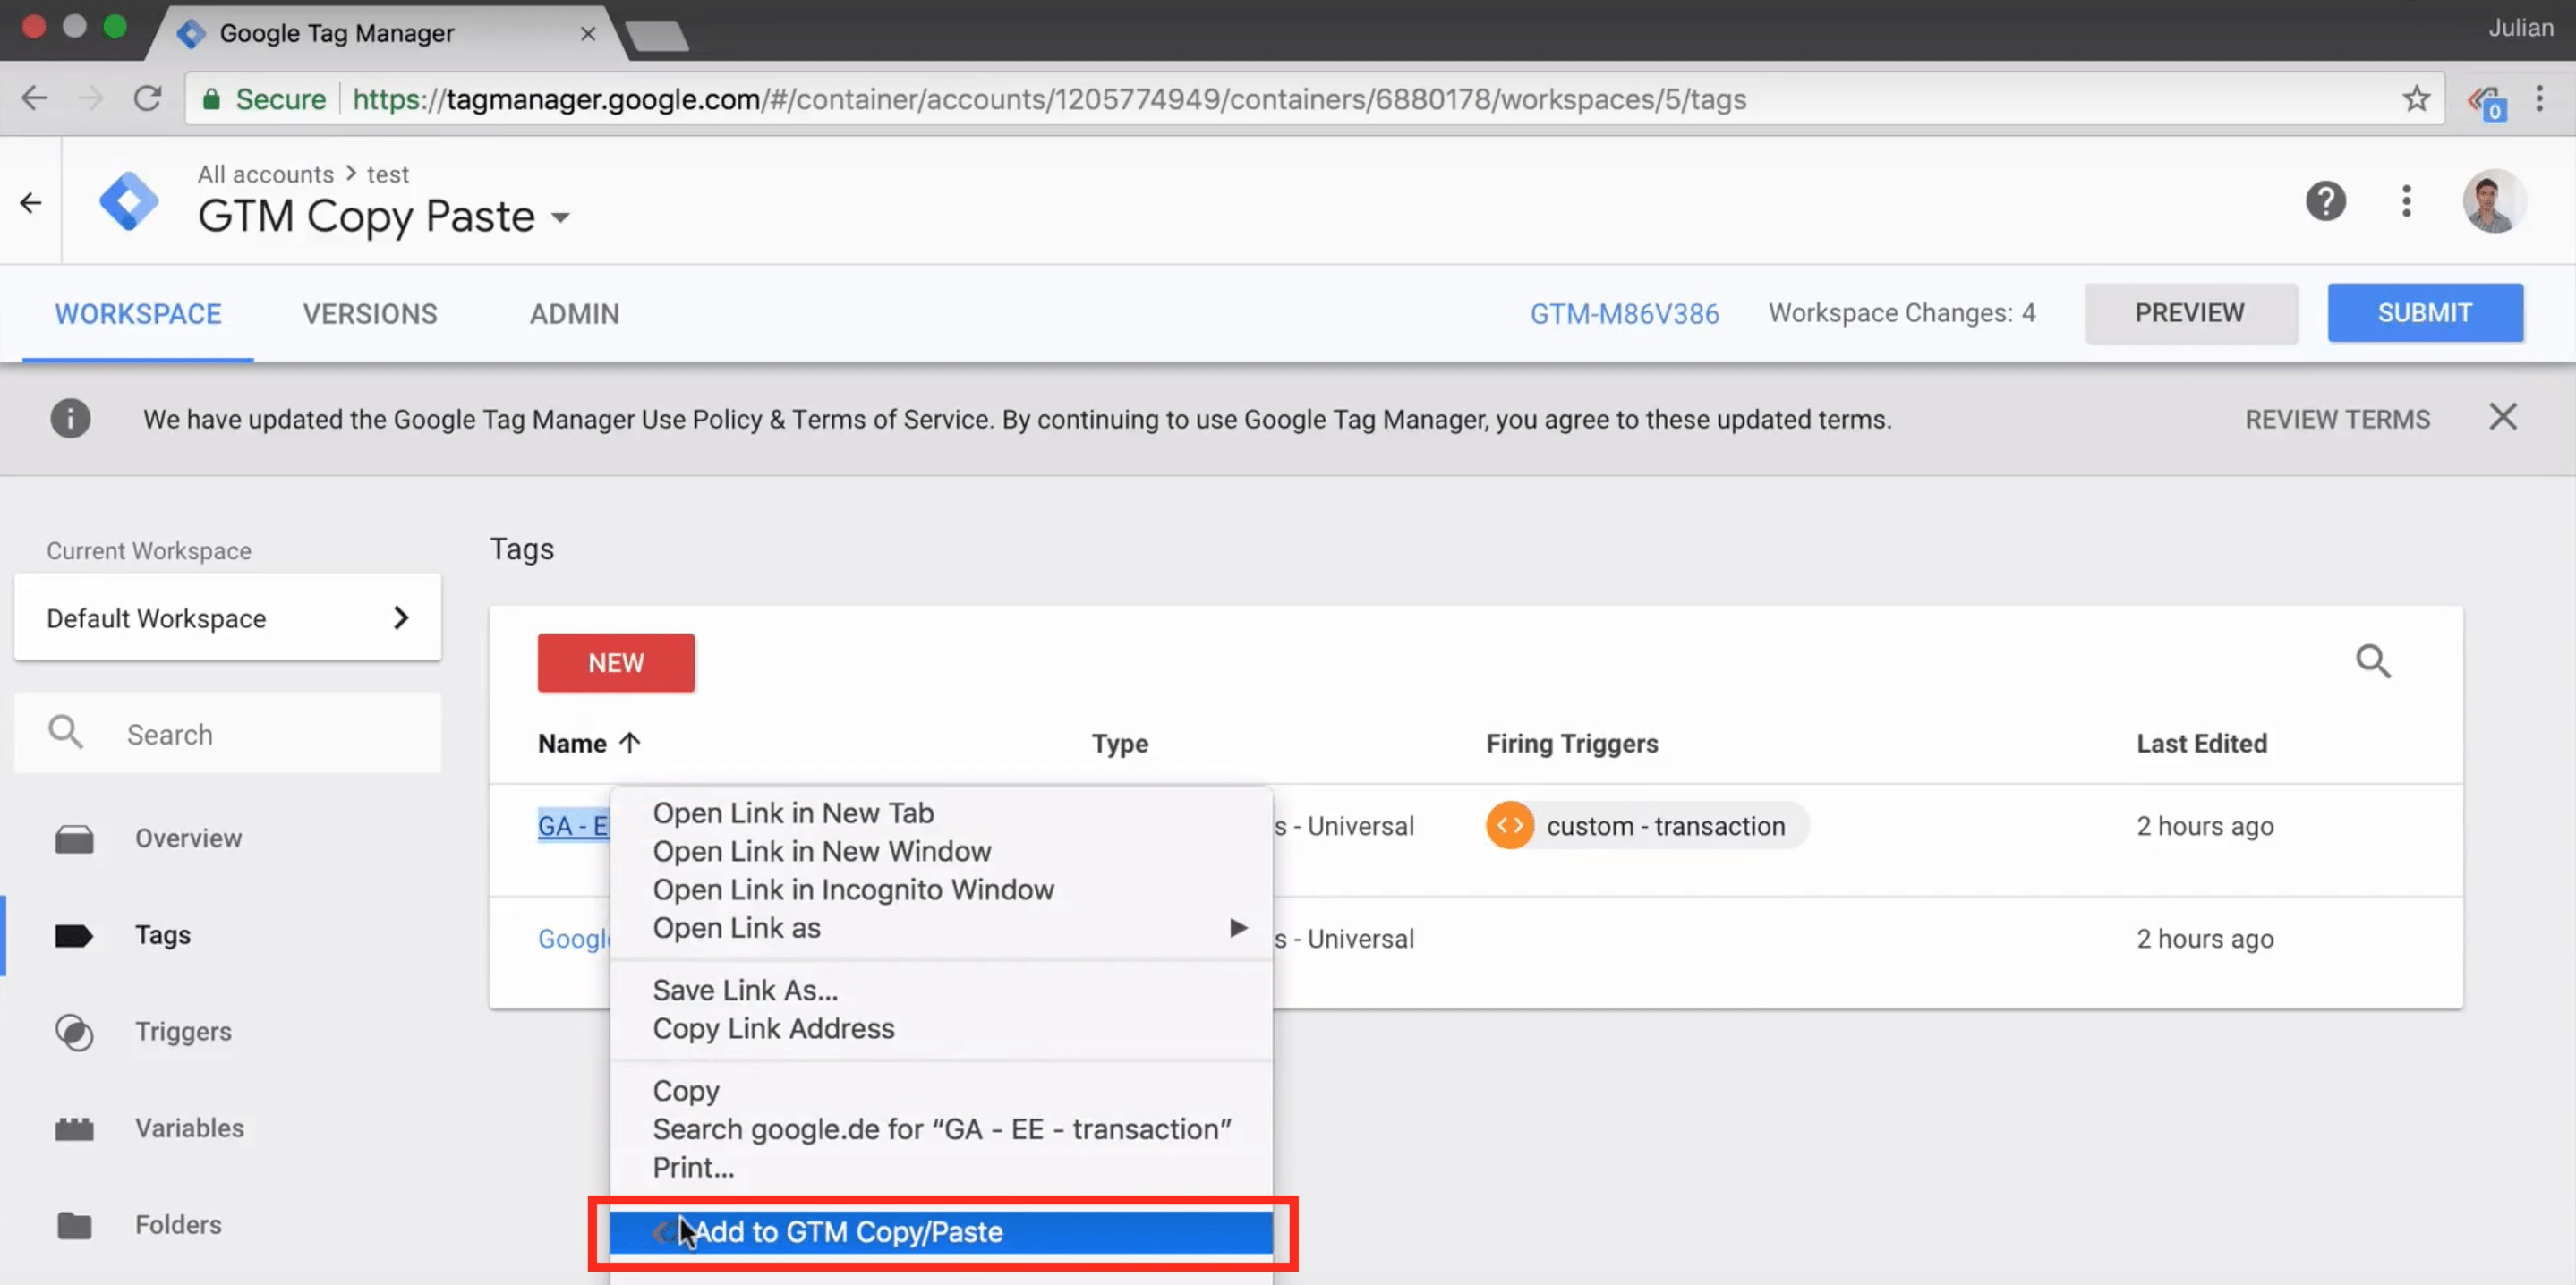
A very useful extension developed by us right here at MeasureSchool. Our Copy/Paste extension allows you to easily copy and paste tags, variables, triggers, and more from one Google Tag Manager Container to another.
This speeds up your work and reduces the chance of human error when copying everything over manually. Check out our quick and easy guide to the GTM Copy/Paste extension!
2. PII Viewer
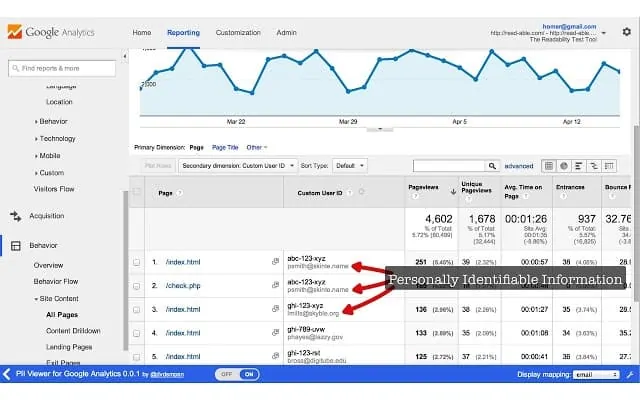
PII stands for Personal Identifiable Information, which is prohibited by the Google Analytics Terms of Service. Any information like the email address or the name is not allowed to be sent and stored in Google Analytics.
Instead, you can send a unique identifier, for example, a user ID. This identifier lets you connect the users’ data in Google Analytics with an external database.
With the PII Viewer extension, you can import information through a CSV and map the data with Google Analytics’ unique ID to see the actual Personal Identifiable Information that is attached to this user ID.
The PII is not stored on the Google Analytics servers, and now you can backtrack exactly the user that has taken a specific action or visited a particular page. Very powerful.
3. GTM Variable Builder
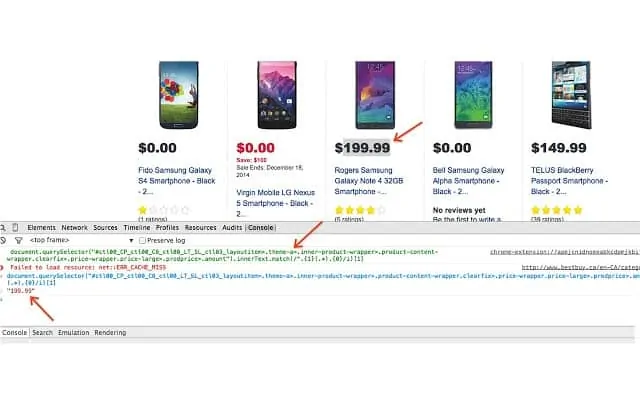
This tool helps you build custom JavaScript variables to scrape your website. It retrieves the values of website elements and shows them in the Chrome Developer Console.
You need to highlight an area on a website, click the extension icon, go to the JavaScript console in Chrome, and view the output.
We encourage you to heavily test this because it still relies on the right CSS selectors and we have found that in some cases you might need to adjust the CSS selection accordingly.
4. Google Tag Assistant Chrome Extension
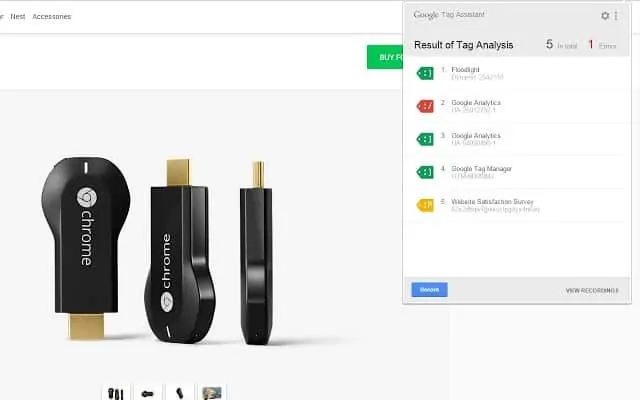
Once you enable this extension, it tells you which codes have fired on your page, including Google Analytics, Adwords Conversion Tracking, Google Tag Manager, and more.
It’s an essential tool for anybody who works with these Google products, and although sometimes the recommendations are off, it’s still a great feature to have.
There are other capabilities with this extension. You can start recording a session, visit other websites, and view the recording with a report that shows you which codes fired on which pages.
5. GA Debugger
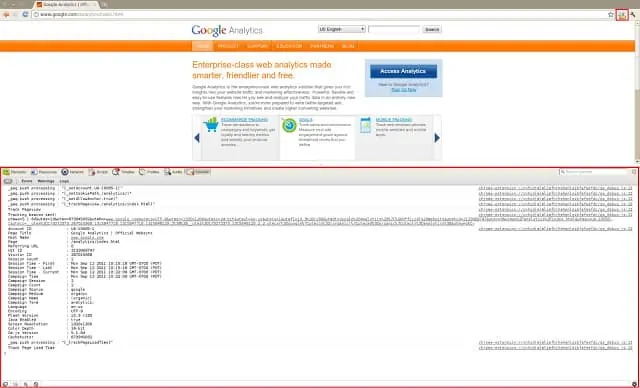
When it comes to the first line of debugging your Google Analytics installation, GA Debugger is the go-to extension.
Open the browser Developer tool, go to the JavaScript console when you want to go in-depth and see what data gets transferred over to Google Analytics.
Everything about dimensions, events, tracking IDs, and more is pulled out. Every time you open a page, you see the information loading in the Console.
6. Da Vinci Tools
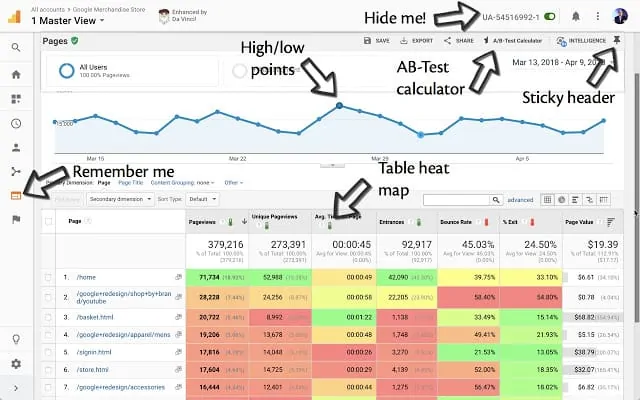
This useful extension enhances your experience with your Google Marketing Platform tools like AdWords, Google Analytics, Google Tag Manager, and Data Studio. I cannot recommend this enough.
Da Vinci Tools brings handy enhancements to you directly within the interface. For example, you can enable heat maps in your Google Analytics reports, which is quite useful when analyzing because you can quickly spot trends.
Easily calculate the metrics that you want to compare for an A/B test and then calculate the statistical significance.
🚨 Note: Support for this analytics Chrome extension has recently been discontinued.
7. Page Analytics Chrome Extension
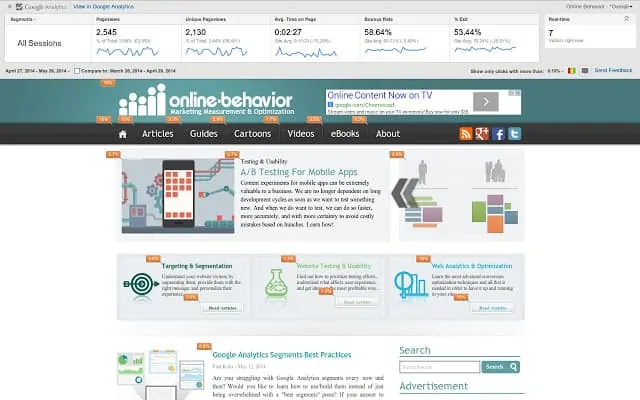
This tool was part of Google Analytics but now is deployed via a Chrome extension.
It gives you some data about a page, and you can visually see how users interact with your website. For example, how many people are on this website at this time, a heat map here for the clicks, and so on.
8. Tag Manager Injector

A great extension that marketers often use to deploy a Google Tag Manager container. It works even on pages that you don’t have access to, and all you need is a Google Tag Manager ID. Additionally, you can push any data layer values.
It is a handy extension to add a Google Tag Manager container if you don’t have access to the website. Consider it when you want to prepare for client demonstrations or just for practice.
9. GTM Sonar
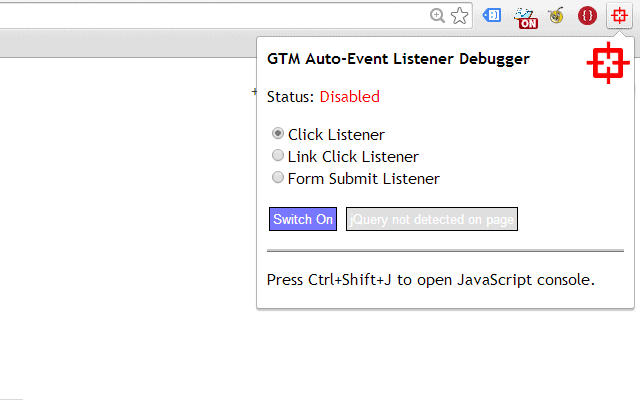
When you are testing the triggers for links, clicks, or similar events, once you click the element, the website often forwards you to the next page. This makes inspecting what happened inside of the preview and debug mode a bit hard sometimes.
Simo Hava has built an extension called the GTM Sonar which automatically stops the browser so you can inspect the variables or data layer.
It is handy when working with auto event triggers and is an alternative to stopping the page load or using the CTRL or command key to open it in a new tab (sometimes this doesn’t work).
10. The DataSlayer Chrome Extension
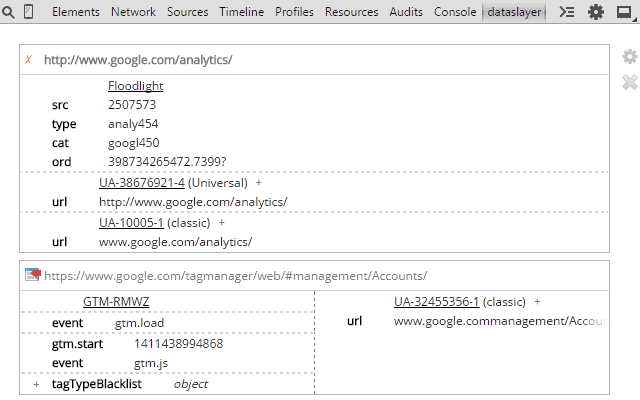
This extension helps you look at the data layer in a different format than the Console. Open up the DataSlayer tab in the Developer tools, and you will find the different data layer values that were loaded.
With this tool, you can quickly identify any errors or shortcomings that you might want to implement in the data layer.
11. WASP.inspector
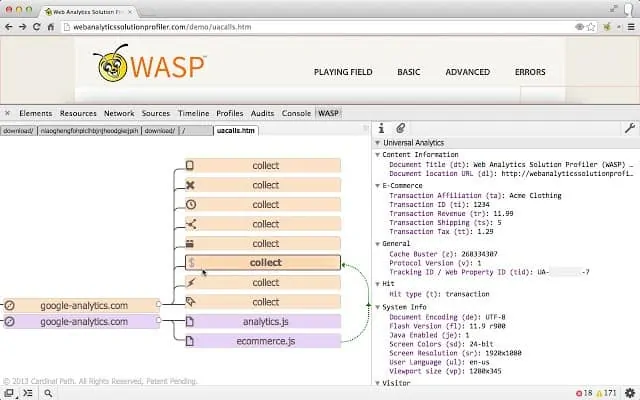
Last, WASP is an Analytics Chrome Extension that has been around for a while. You can do a lot of validation because it gives you an overview of what is pushed into the data layer, how tags load, via which script, and how they work together.
This is particularly interesting once you want to identify where a tag comes from when you don’t see the tag in the actual source code.
Another use case is when you find multiple Google Analytics codes deployed, and you need to figure out where different connections come from. This tool is a lifesaver in regards to finding out where a tag is placed.
FAQ
How does the Google Tag Assistant Chrome Extension work?
The Google Tag Assistant Chrome Extension provides information about which codes have fired on your page, including Google Analytics, AdWords Conversion Tracking, and Google Tag Manager. It helps you troubleshoot and verify if the codes are working correctly. Additionally, it allows you to record sessions on other websites and view a report showing which codes fired on each page.
What is the GA Debugger extension used for?
The GA Debugger extension is a debugging tool for Google Analytics installations. It helps you examine the data being transferred to Google Analytics, including dimensions, events, tracking IDs, and more. By opening the browser’s Developer tool and accessing the JavaScript console, you can see the information loading in real time.
How does the Tag Manager Injector extension work?
The Tag Manager Injector extension is used to deploy a Google Tag Manager container even on pages where you don’t have access. With just a Google Tag Manager ID, you can add a container and push data layer values. This extension is useful for preparing client demonstrations or practicing with Google Tag Manager.
Summary
There you have it, my top 11 Analytics Chrome extensions that I use all the time.
In our recent post, our creator Sofiia also shared her top 10 Chrome extensions.
Now of course new ones are developed all the time. So, what is your favorite Chrome extension? Let us know in the comments.
And, head over here if you want to check out more of the tools that MeasureSchool develops.

